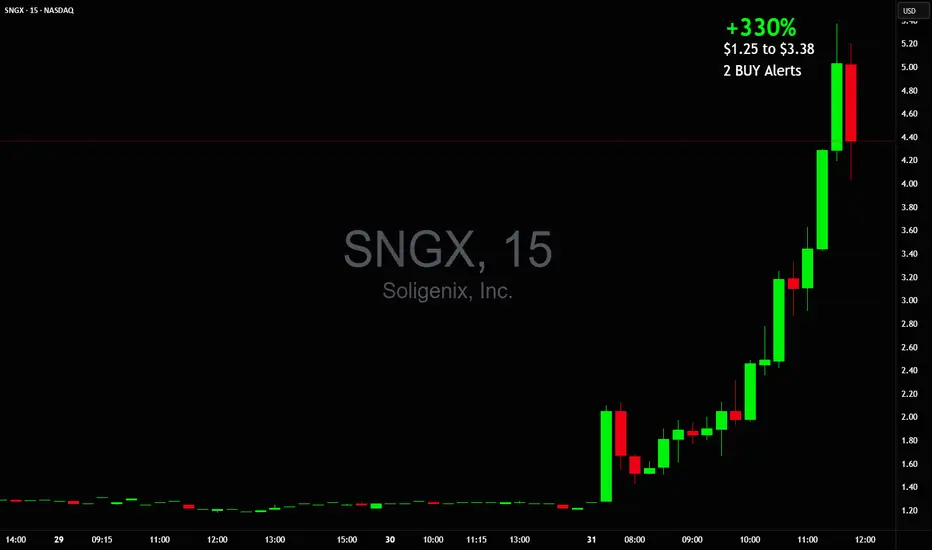
+330% this morning $1.25 to $5.38 on massive 270 million volume🚀 +330% this morning 💥 $1.25 to $5.38 on massive 270 million shares traded volume so far
NASDAQ:SNGX money maker of the day!
2 Buy Alerts sent out, also posted it in my premarket watchlist while it was still up only +30%!
Forget about NASDAQ:MSFT NASDAQ:META NASDAQ:AMZN NASDAQ:NVDA NASDAQ:AAPL AMEX:SPY NASDAQ:QQQ they will never be able to create such gains in a single day or should I say minutes
This isn't options trading either, it's a stock that went up that much this morning
Daytrading
Market Stuck in Limbo? XAGUSD Update & Likely Range AheadLet’s talk silver.
The market's clearly undecided — no real momentum, just hesitation.
We’re approaching overextended RSI levels, so don’t expect fireworks just yet.
Im Skeptic from Skeptic Lab and In this quick update, I’ll show you what I’m watching for both long and short triggers …
and why a range might dominate the next few days.
👉 Watch till the end to avoid getting trapped by fake breakouts.

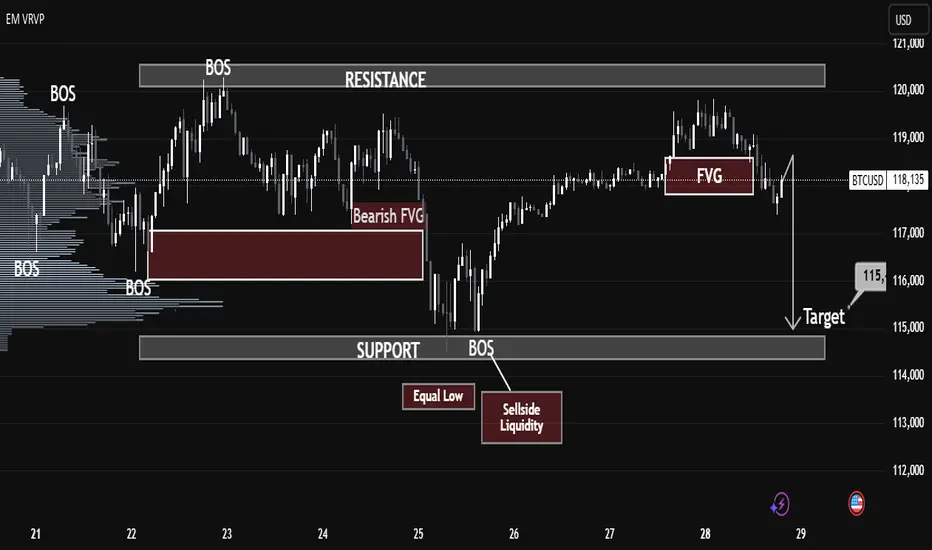
BTCUSD Market Breakdown – Liquidity Sweep Incoming?BTCUSD Market Breakdown – Liquidity Sweep Incoming?
🔍 Technical Analysis (July 29, 2025)
Chart Observations:
1. BOS (Break of Structure):
Multiple BOS events are identified, confirming key directional shifts in market structure. The last BOS near the support zone signals bearish intent.
2. Bearish Fair Value Gap (FVG):
A clean bearish FVG is left behind after a sharp drop on the 25th, indicating institutional imbalance and potential retracement area. Price rejected from that FVG later.
3. Equal Low & Sellside Liquidity:
The highlighted equal lows around July 25-26 mark areas of resting liquidity—prime targets for smart money manipulation.
4. New FVG Formed (July 28):
Another bearish FVG appears just before the projected breakdown, strengthening the case for a bearish continuation.
5. Support Zone Target – $115K:
A clean support zone (marked between 114,500–115,500) sits directly below the current market price. This is the likely liquidity target after sweeping equal lows.
6. Volume Profile (VRVP):
Low-volume nodes between the current price and support suggest minimal resistance to a sharp downward move.
⸻
🎯 Conclusion:
The structure, FVGs, and liquidity pools all point toward a liquidity raid below the equal lows, aiming for the support target near $115K. Traders should watch for a decisive break below the current range, especially if the FVG acts as resistance again.
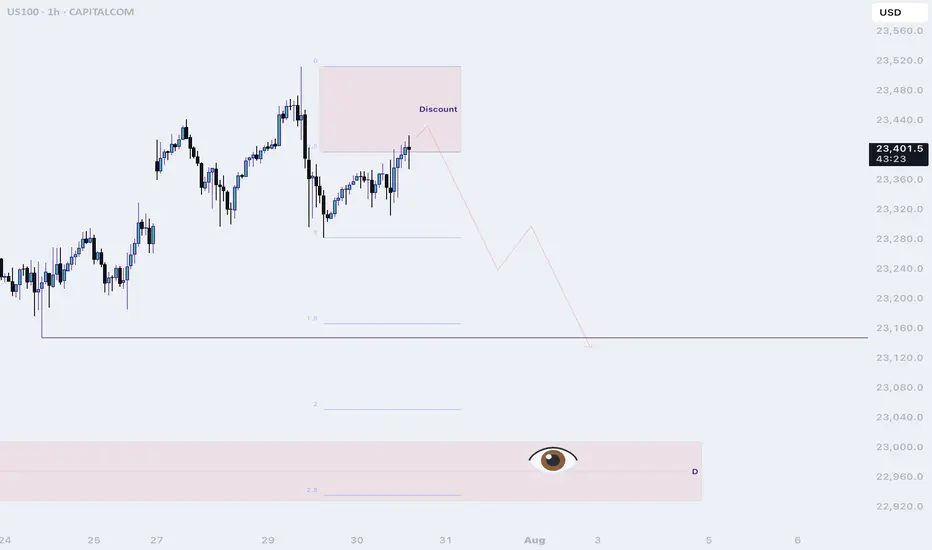
US100/NQ short idea PM session I expect yesterdays high to hold. For NQ reaching a discount, a 400 point move can happen. WATCH A 5m FVG formation for entry
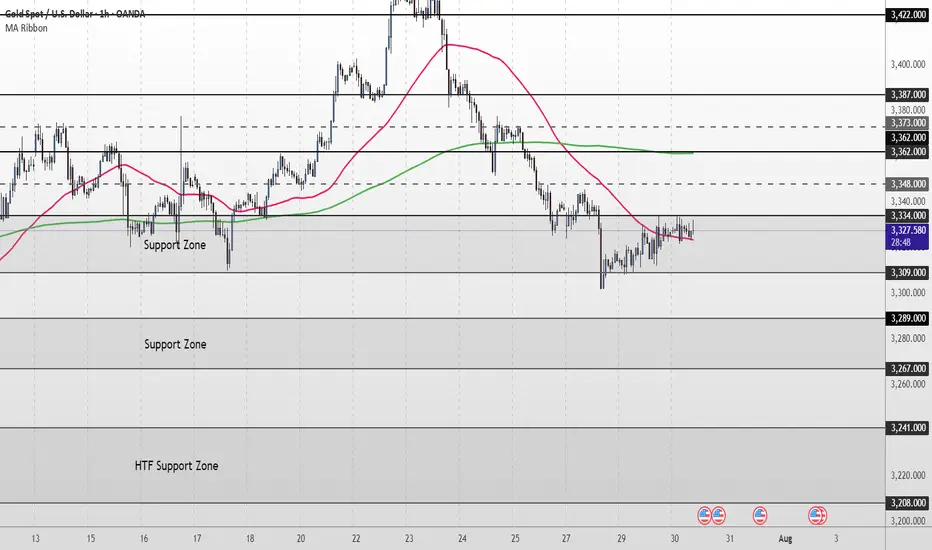
XAU/USD Intraday Plan | Support & Resistance to WatchGold remains in a bearish structure, consolidating in a narrow range after the sharp drop earlier this week. Price is trading around 3,330, testing the 3,334 resistance zone while still below the 200MA (3,362), which may act as dynamic resistance.
As long as price stays below 3,348–3,362, the bias remains to the downside, with a break below 3,309 likely exposing the 3,289–3,267 support zone.
A clean reclaim above 3,334- 3,348 would neutralize the immediate downside pressure and open the path back toward 3,373–3,387.
📌 Key Levels to Watch
Resistance:
‣ 3,334
‣ 3,348
‣ 3,362
‣ 3,373
‣ 3,387
Support:
‣ 3,309
‣ 3,289
‣ 3,267
‣ 3,241
🔎Fundamental Focus – FOMC
The FOMC rate decision and Powell’s press conference later today will be the key driver for gold. Expect sharp volatility and potential whipsaws around the release.
⚠️ Manage risk carefully, avoid chasing initial spikes, and wait for clear direction once the event dust settles.
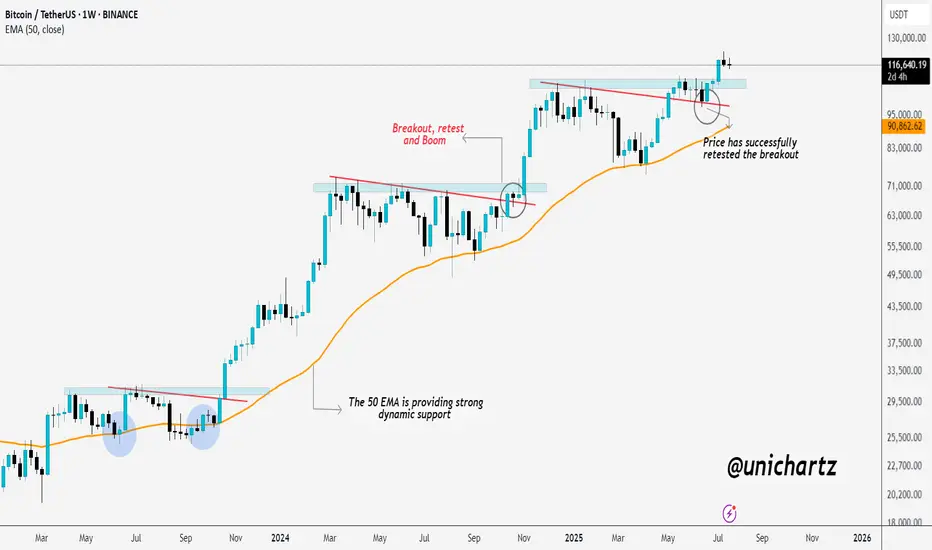
BTC Retested and Ready for the Next Leg Up?This CRYPTOCAP:BTC weekly chart shows a clean pattern of breakout → retest → rally.
The 50 EMA has been acting like a strong dynamic support throughout the uptrend, keeping the structure intact. Every time price broke out of a consolidation or resistance zone, it came back, retested it, and then continued moving higher.
Most recently, BTC broke above a key resistance, pulled back to retest it, and now it looks like the breakout has held. This is a classic bullish continuation setup, and historically, it’s led to strong follow-through moves.
As long as BTC stays above the 50 EMA and holds support, the bullish structure remains intact.
Thanks for reading! Stay sharp and trade safe.
Gold – 24 July: Watching H4 OB Zone for Bullish ReversalGold – 24 July Outlook
Watching H4 OB Zone for Potential Reversal
📌 Recap of 23 July Trade:
As outlined in yesterday’s analysis, the M15 Order Block ( 3417–3412 ) held well. The market reacted precisely from this level, and our long setup successfully hit the defined 120-pip target .
However, after reaching a high near 3434 , the price failed to break above and instead rejected sharply, breaking the recent M15 higher low — a key structural sign that signals the start of a possible H4 pullback phase.
🔍 Current Market Context:
Trend Overview:
While the overall bias remains bullish, this break of M15 structure suggests short-term weakness and a corrective move in progress on the H4 chart.
Key Zone in Focus:
H4 Order Block Zone: 3359 – 3345
This is a critical zone to watch today. The market is currently trading around this area, and it could act as a potential reversal point where the uptrend resumes.
🎯 Trading Plan:
– Closely monitor the price action within the 3359–3345 zone.
– If price respects this zone and LTF (e.g., M1) shows signs of structure flip or ChoCH + BoS , it could present a fresh long setup opportunity.
– As always, only act on the trade if multiple confluences align — don’t anticipate, let the market confirm.
📈 Summary:
Bias: Watching for a bullish reversal from the 3359–3345 zone.
Setup Condition: Wait for clear LTF confirmation before entering.
Risk Management: Stick to 1:3 RR — 40 pip SL and 120 pip TP as per system.
Let the market come to your setup. Patience is your greatest edge.
📘 Shared by @ChartIsMirror

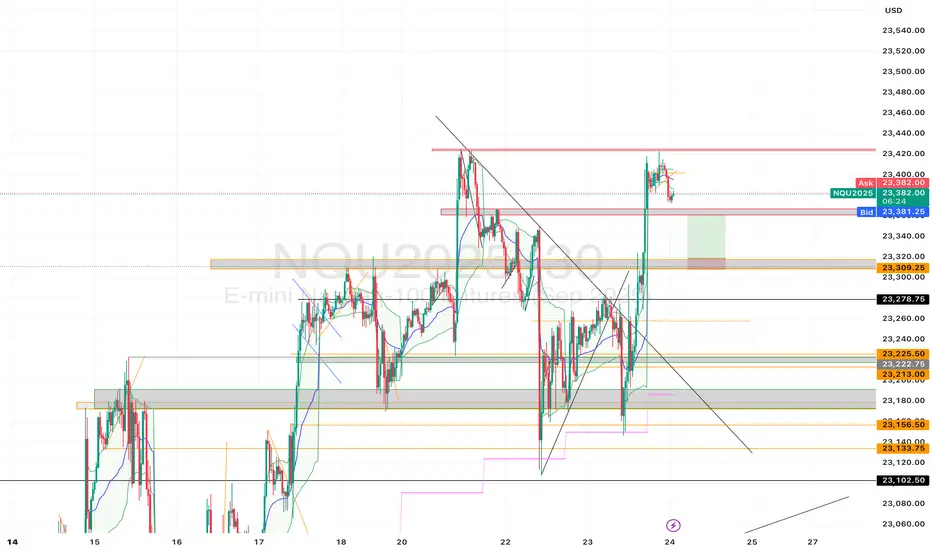
Overnight/Thursday 7/24 trade idea. Looking for some pull back to the 23,310 area for a 50 point gain. I’m actually going to enter with two positions with micro contracts four micros at 310 and another four at 300 with a stop around 290.
Educational EUR/USD Chart Breakdown – Price Action at Key LevelsEducational EUR/USD Chart Breakdown – Price Action at Key Levels
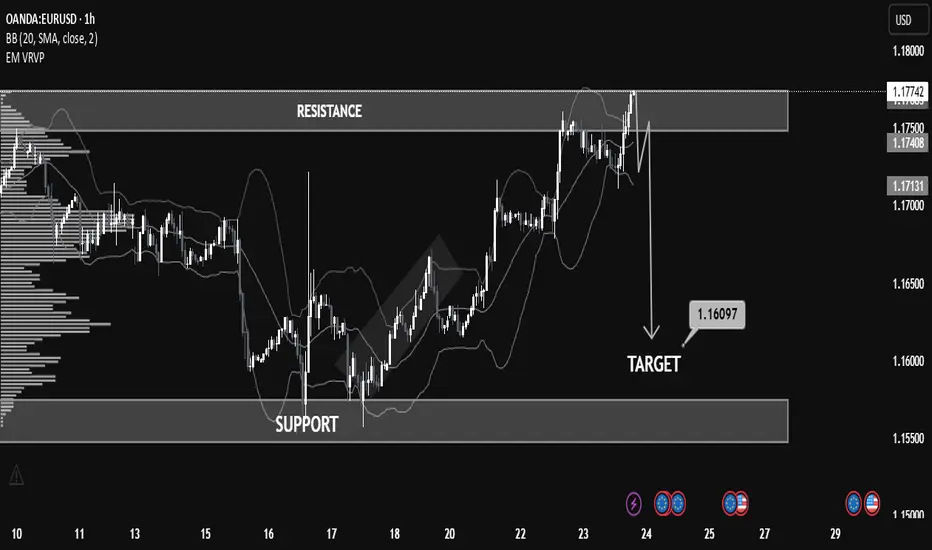
This EUR/USD (1-hour) chart provides a great example of how support and resistance zones, combined with price action and indicators like Bollinger Bands, can help anticipate market moves.
🔹 Resistance Zone Tested:
The pair recently approached the 1.17500–1.17800 resistance zone. This level had previously acted as a supply zone, and price once again showed rejection here, indicating selling pressure.
🔹 Bollinger Band Overextension:
Notice how the price extended beyond the upper Bollinger Band—this often signals that the market is overbought in the short term, leading to a potential reversal or correction.
🔹 Bearish Reaction & Target:
After rejection from resistance, the chart outlines a bearish move with a target at 1.16097. This level lies just above the next strong support zone (1.15500–1.16100), offering a realistic area for price to stabilize if the downtrend continues.
🔹 What to Learn:
Support & Resistance: Prices often react at key zones; previous resistance can turn into support and vice versa.
Confluence Tools: Use indicators like Bollinger Bands with price structure to increase confidence.
Target Planning: Identify likely reaction zones for risk management and profit-taking.
📚 Summary
This setup is a clean example of trading within a range and using technical confluence to plan entries and exits. If price breaks below 1.17130 with strong momentum, the probability increases for the market to reach the 1.16097 target.
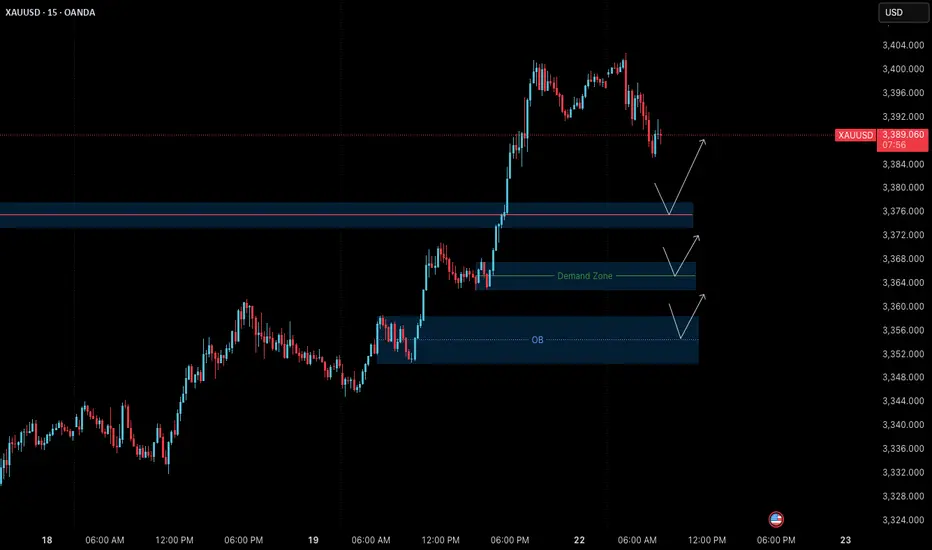
Gold (XAUUSD) – 22 July Outlook | Reversal Zones in FocusGold (XAUUSD) – 22 July Outlook | Three Key Reversal Zones to Watch
Yesterday, Gold gave a strong breakout above the key resistance level at 3377 , shifting the M15 structure bullish and confirming upside strength.
Today, the market is likely entering a retracement phase on both the H4 and M15 timeframes — a healthy pullback after a breakout, which may lead to the next leg of the uptrend.
So where should we focus for long opportunities?
We are observing three key zones as potential bases for the continuation move:
📍 Zone 1 – 3377.6–3373.5 (Breaker Block):
This is the immediate structure zone — previous resistance which may now flip into support.
→ If price respects this area, we can anticipate a classic S&R Flip setup.
📍 Zone 2 – 3367.5–3363 (Demand Block):
If the first level doesn’t hold, this zone becomes critical. It lies just under the breakout base and could act as the next level of defense by bulls.
📍 Zone 3 – 3358.5–3350.5 (H4 Order Block):
This is the most significant support zone for the day. It aligns with a higher-timeframe order block, making it a high-probability POI for a deeper pullback and reversal.
But remember, we do not predict blindly .
Plan of Action:
– Observe price behavior at each zone
– Wait for confirmation via M1 internal structure shifts + BoS
– Trade only when all conditions align
– SL: 40 pips | TP: 120 pips
Risk-Reward: Always 1:3
Summary:
✅ Structure is now bullish on M15 and H4
✅ We’re in a pullback phase — ideal for continuation trades
✅ Three clear POIs mapped — now we wait for the market to speak
Patience. Precision. Discipline.
Let the trade come to you — not the other way around.
📘 Shared by @ChartIsMirror
GOLD: Pre-market PrepSo for gold today, I see a lot of confluence around the prior week's high, prior day's high, and the prior value area high. We also had a poor high last Friday that we've clearly broken through.
Right now, we're in balance up above these key levels. My immediate plan is to continue going long up to the prior month's value area high. If we get a pullback to the confluence area, I want to take it up from there.
If the market opens and we accept back into the previous area, I'll be looking to go short from that area and take it down. That's my main analysis for gold today. Let’s trade smart, peace!

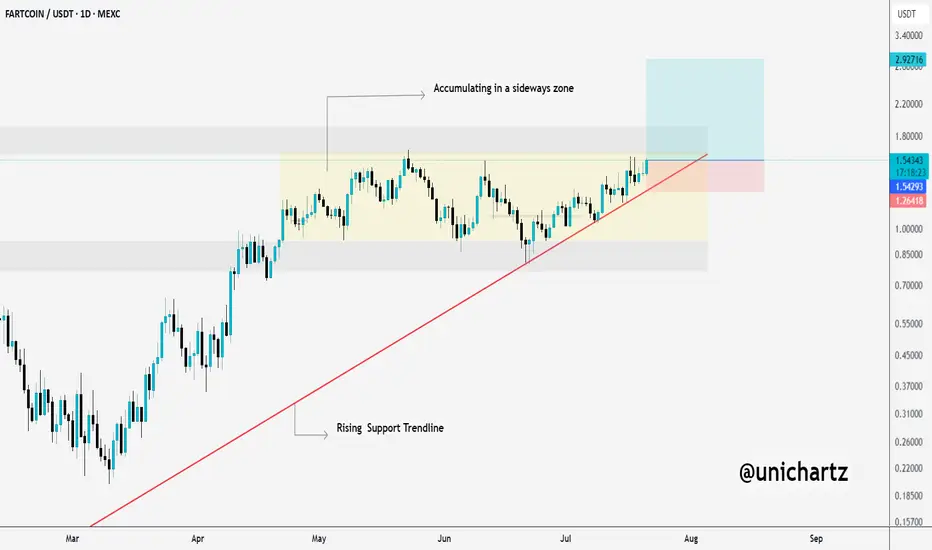
Fartcoin Coiling Up for a Parabolic Move$FARTCOIN is bouncing perfectly from the rising trendline and continuing to accumulate within the sideways range.
If it manages to break above the marked resistance zone, we could see a parabolic move ahead.
The structure looks strong, and momentum is building, keep a close watch on this one, things could get explosive soon.
DYOR, NFA
XAUUSD Outlook: Bullish Bias Hi Traders
I am a profitable full time trader with 7 Years experience and I would like to share my journey including profits analysis and signal indicators.
Attached is the XAUUSD chart showing current areas of interest above and below current price which can used to trade profitably.
I still have a bullish bias, but will wait patiently for a retracement into one of the support levels. I will assess price action at lower levels before looking for buy trades.
Key support levels
3,335–3,338
3,320–3,324
Key resistance levels
3,352–3,355
3,367–3,371
Price respected last week’s high (3,377) and is pulling back. The moving averages are also proving a confluence to support our bullish outlook.
Also, please take into account news releases throughout the week before placing any trades to avoid market volatility.
We will share updates throughout the week.
Please let me know your bias for gold this week in the comments.
If you found this helpful, please drop a like to support my work.
Thanks,
PrestigeGoldFX

Pre-Market Prep 7.18.2025What it do, everyone! Here’s my pre-market prep for Friday, July 18th. Just to give you a quick overview, I'm using my prior value areas, the prior day's high and low, and the CVA levels from my market profile. I use all this history to help me plan my trades for the day.
So, starting with the S&P, as of now we’re green across the board. We’re in balance up from the prior day’s range, value area, and the CVA. My main plan is to look for acceptance and a pullback to a confluence area for longs. If we get rotational and break out of that area, I’m ready to go short.
For the NASDAQ, it's a similar story. We’re rotational in the prior value area and range, but we’re balanced up from the recent CVA. Right now, I’m waiting to see if we can confirm acceptance and then I’ll look for a short from that rotational area down to the prior value area low.
In the Russell, I’m seeing clear acceptance above all levels, so a pullback to the confluence area for a long would be ideal.
For Gold, I’m also seeing it in balance up on all fronts. My first move would be a long from the prior day’s high. If we drop a bit lower, I’ll be looking at that CVA and PVA area for another long.
The Euro is a bit more mixed. We’re rotational in the prior day’s range but balanced up in the value area and CVA. I want to clear the prior day’s high before taking any big moves.
The Yen is also rotational, so I’m looking to trade the extremes, maybe some scalps while we’re balanced in the prior value area.
For the Aussie Dollar, we’re in balance up from the PVA, but rotational in the prior day’s range and CVA. I’m looking for shorts near the top area and longs at the bottom, staying out of the middle for now.
And finally, Crude Oil is rotational on all fronts. My first plan is to look for shorts from the confluence area down to the prior day’s range.
That’s my pre-market prep for today. Let’s trade smart. Happy Friday, peace!

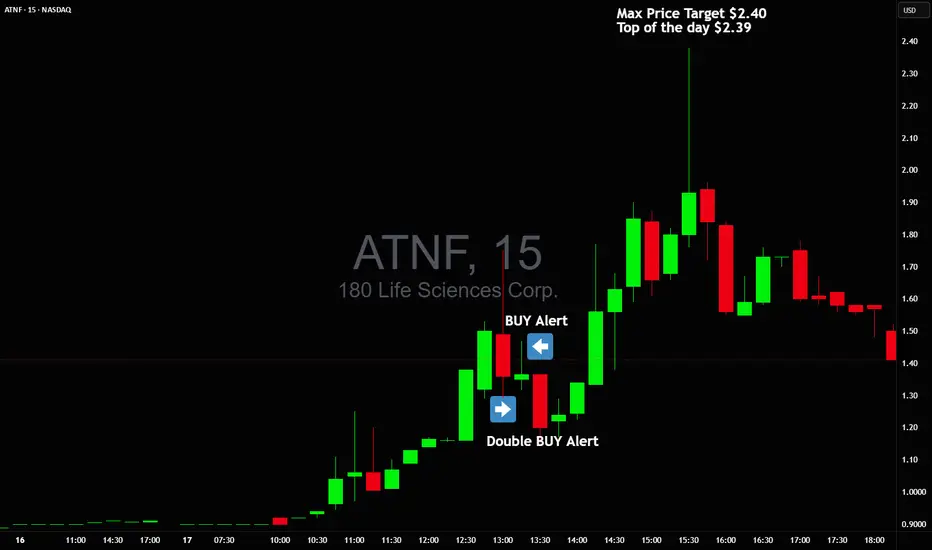
Double Buy Alert $1.35 avg with $2.40 max targetDouble Buy Alert $1.35 avg with $2.40 max target 🚀 High of the day was $2.39 🎯 NASDAQ:ATNF
Price action clearly signaled manipulation, I warned everyonw about it and sent out Double buy alert with new highs squeeze target!
Those who held all the way made +150% profit on this trade alone in 2 hours 💪🏻
NASDAQ:TELO NASDAQ:ABVE NASDAQ:NVDA NASDAQ:TSLA
Pre-Market Prep
Today, I'm narrowing down to six key markets. For the S&P, it's all about waiting for a pullback from the prior day's high or a breakout above the CVA. If it dips back inside the range, I'm ready to go short with some scalps.
For the NASDAQ, it's looking strong. I'm thinking about a long position if it pulls back to the prior day's high.
Gold is in a downtrend across all areas, and I'm already in a short position from the CVA low. I'm thinking about adding to that if it pulls back to the prior day's low.
Crude Oil is pretty balanced. I'm looking at the high of the CVA for a short opportunity if it gets there.
For the Yen and Euro, both are rotational. I'm eyeing long opportunities if they show some acceptance and pullbacks from key levels.
That's the vibe for today. Let's trade smart, avoid the chop, and keep it moving. Peace!

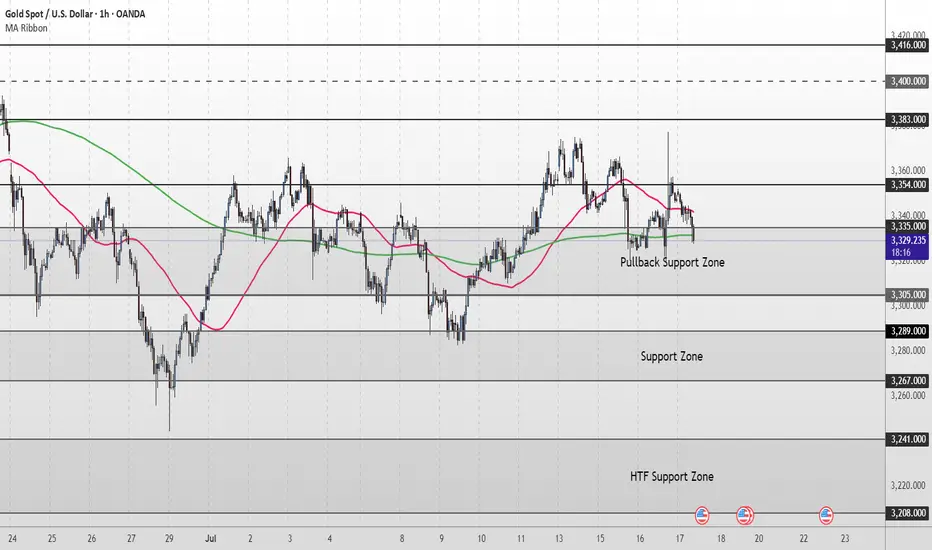
Gold Short Term OutlookYesterday, gold staged a strong rally, pushing up toward 3,377, which was followed by a strong rejection. Price has pulled back sharply and is now testing the Pullback Zone once again.
Currently trading around 3,329, price is caught between the 50MA overhead acting as dynamic resistance and the 200MA below offering dynamic support.
For the bullish structure to regain momentum, we need to see a clean break and hold back above 3,354. This would reopen the path toward 3,383 and 3,400, with 3,416 as a higher‑timeframe target.
If buyers fail to defend the Pullback Support Zone, and price breaks decisively below 3,305, attention shifts to the Support Zone (3,289–3,267). A deeper selloff could then expose the HTF Support Zone (3,241–3,208).
📌 Key Levels to Watch
Resistance:
‣ 3,354
‣ 3,383
‣ 3,400
‣ 3,416
Support:
‣ 3,335
‣ 3,305
‣ 3,289
‣ 3,267
‣ 3,241
🔎 Fundamental Focus – High‑Impact U.S. Data Today
A packed U.S. calendar could drive volatility:
📌Core Retail Sales m/m and Retail Sales m/m
📌Unemployment Claims
📌Philly Fed Manufacturing Index
These red‑folder releases can create sharp intraday swings.
Additionally, multiple FOMC member speeches later in the session could add headline‑driven moves.
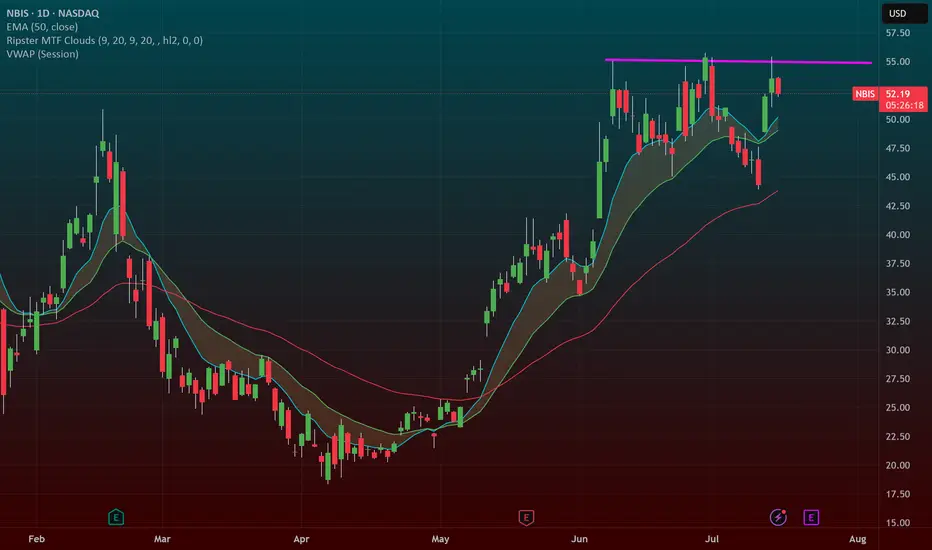
NBIS 55 BREAKOUT in the works!NBIS is an AI darling and a big momentum stock. When it goes it goes! it has been testing this 55 level for some time now.
We recently had a big GS upgrade that "woke" it up. A rest day here and another one will let the 9ema catch up to it and allow for a big breakout. If we take out this trendline at 55 ill put the stop 9ema and swing this.

Using 1 min time frame for entries on VX algo & day tradingwhat time frames do you use to confirm entries outside of a buy signal?
If I am day trading, I will mainly use the 1 minute time frame to look for moving average support and resistance, and read the candle stick patterns as well from that chart.
However, there are times I'll switch to a 5 minute and 10 minute time frame to take a look at levels for moving averages and see what the candle stick patterns are from there.
So for example, today we had 3 of the x1 sell signals around 9:31, so we pull up the 1 min chart, we are getting confirm break of the 1st moving average support = bearish confirmation #1, follow by DHC = Bearish confirmation #2 , and the sell signal is already 3 confirmations, so we need to short ASAP.

Trading Day SummaryTrading Day Summary
Today wasn’t a winning day on the books, but it was a major win in discipline.
I hit my daily loss limit before 10 AM, stopped live trading, and switched over to paper trades to protect my capital.
The setups I took—especially in Gold and Euro—lacked full confirmation, and one overnight trade didn’t align with my plan.
I experienced around $200 in slippage, which added to the loss.
The bright side? I stayed in control. No revenge trades. No emotional spirals.
My paper trade afterward was textbook—5R+ potential. That tells me the strategy is sound. Execution and timing just need to be sharper.
Bottom line: this is a marathon, not a sprint. I’m proud of the discipline and the mindset. Tomorrow, we reset and refocus.

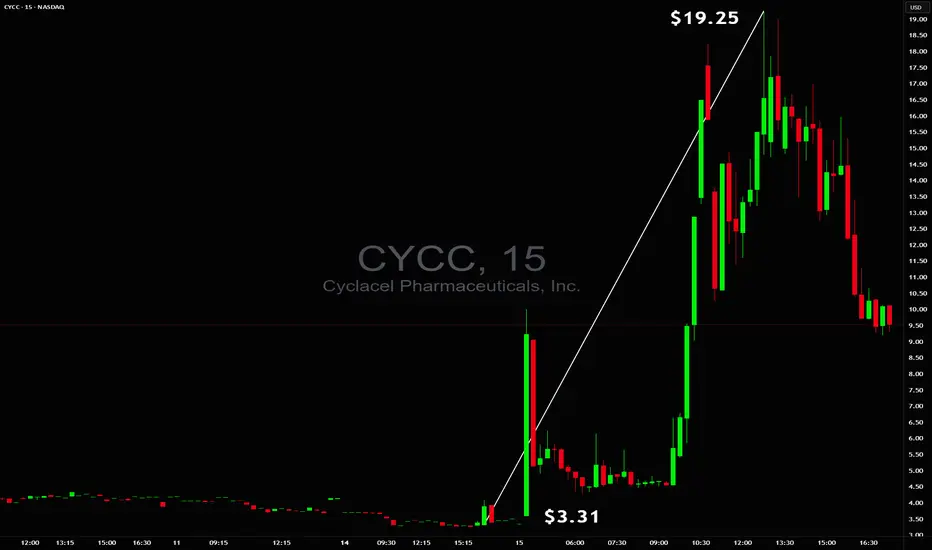
$3.31 to $19.25 in minutes$3.31 to $19.25 in minutes 🚀 but without a safe trade setup ❌ NASDAQ:CYCC
Too unstable to trade early while end of day there was a chance for power squeeze but even on 60M+ volume, tiny float and huge borrow fee they were able to reverse it so safe stop had to be respected ✔️
Mid-Session Market ReviewMid-Session Market Review
S&P 500: After some initial volatility from the 8:30 news, the market accepted above the prior day’s levels but has since pulled back within range, consolidating just below the highs.
NASDAQ: The NASDAQ remains above all of yesterday’s levels and is currently balancing between the high of the day and the 23,100 level, showing a rotational pattern.
Russell 2000: This market is rotational within the prior day’s range and has accepted below the CVA and PVA. Potential trade opportunities might come with a pullback to the 2,245 area.
Gold: Gold has accepted below the prior value area and is still rotational within the CVA. Trade opportunities could present themselves near the prior day’s low.
Crude Oil: The market is quite choppy, hovering around the prior day’s low and value area low. Caution is advised, with potential long opportunities on a pullback, as long as conditions align.
Euro Dollar: The Euro is dropping significantly, moving below all key levels without much respect for them. This could provide short opportunities if there’s a pullback.
Yen: Similar to the Euro, the Yen is also pushing below previous levels. It’s getting choppy near the CVA low, so caution is needed until it shows more respect for those levels.
Natural Gas: The market is rotational within the prior day’s range and respecting the CVA high. Long opportunities might be possible if conditions are right.
Aussie Dollar: It’s showing some respect for the CVA low and is still rotational. There could be a potential long setup forming, depending on how it plays out.
British Pound: The Pound has accepted below all key levels, and a pullback to the CVA low might provide short opportunities, though caution is needed around the VWAP.
