Mid-Session Market InsightsMid-Session Market Insights
In today's session, I'm closely monitoring eight different futures markets: S&P 500, NASDAQ 100, Russell 2000, Gold, Crude Oil, Euro Dollar, Yen Dollar, and Aussie Dollar.
S&P 500: We're seeing a rotational pattern within the prior day's value area and the CVA. I'm eyeing long opportunities from the prior value area low up to the high.
NASDAQ 100: The market is a bit choppy around the PVA and CVA highs, with a slight upward intraday trend. I'm staying cautious here.
Russell 2000: Also choppy, but we've got acceptance within the CVA. I'm looking for long opportunities from the CVA low, which aligns with the prior day's low.
Euro Dollar: I'm currently short from the CVA high, with the first target at the prior day's low. We've broken below the prior value area, so I'll trail this trade and see how it develops.
Yen Dollar: It’s been a bit of a mixed bag. I took a short below the CVA and prior day's low, got stopped out, but it was still a decent setup.
Aussie Dollar: I took some long positions that weren't the best setups, as it was quite choppy near the CVA high and prior day's low. Lesson learned for next time.
Crude Oil: I took a short from the CVA and PVA highs, hit my target at the low of those areas, and we’re currently hovering around that level.
Daytrading

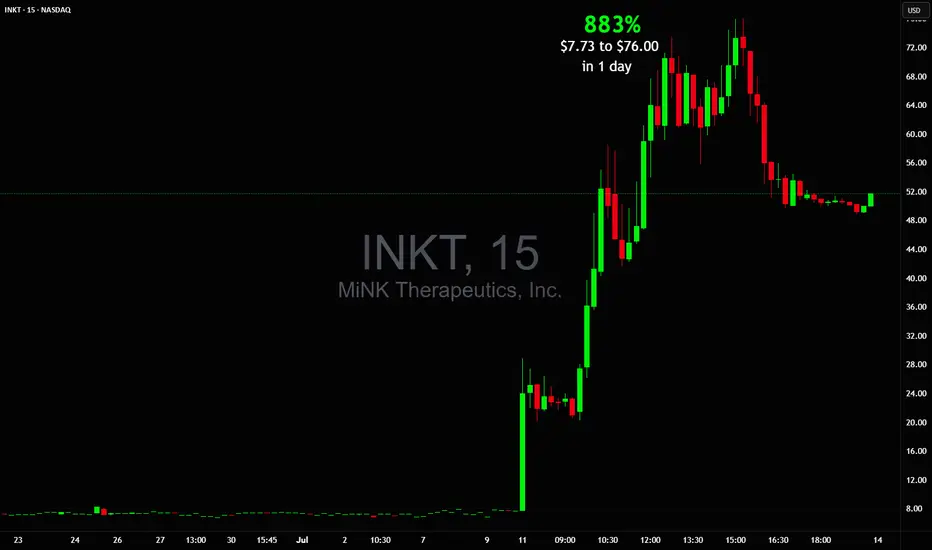
$7.73 to $76.00 in 1 day! Another 800% runner $INKTAGAIN? Another 800% runner in a day? 🚀 Such massive moves became a daily thing these days? 😲 NASDAQ:INKT
Can't wait to see new one in the morning!
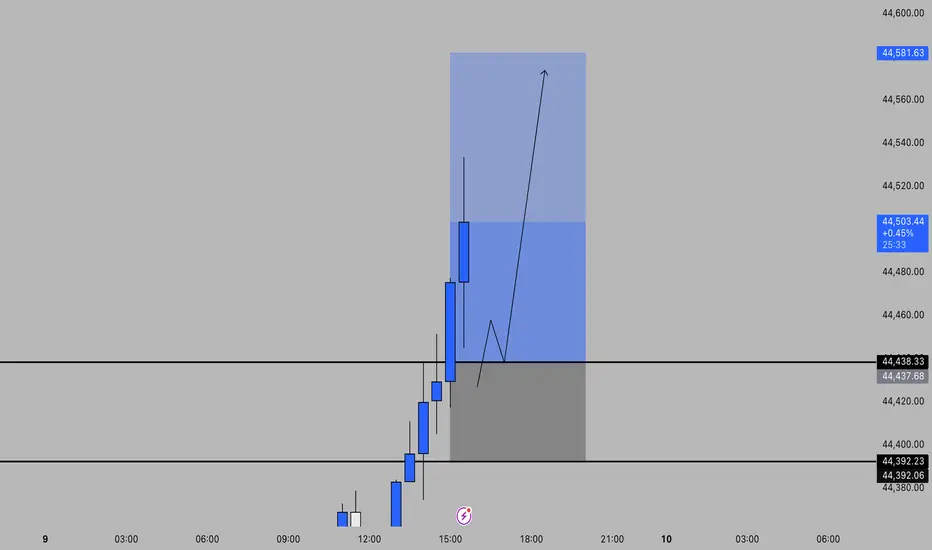
Us30 Long Day Trade New York OpenIm looking for a long on the Us30 for a 1:3 min , im trade a long after a the retest due to the the trend has been bullish
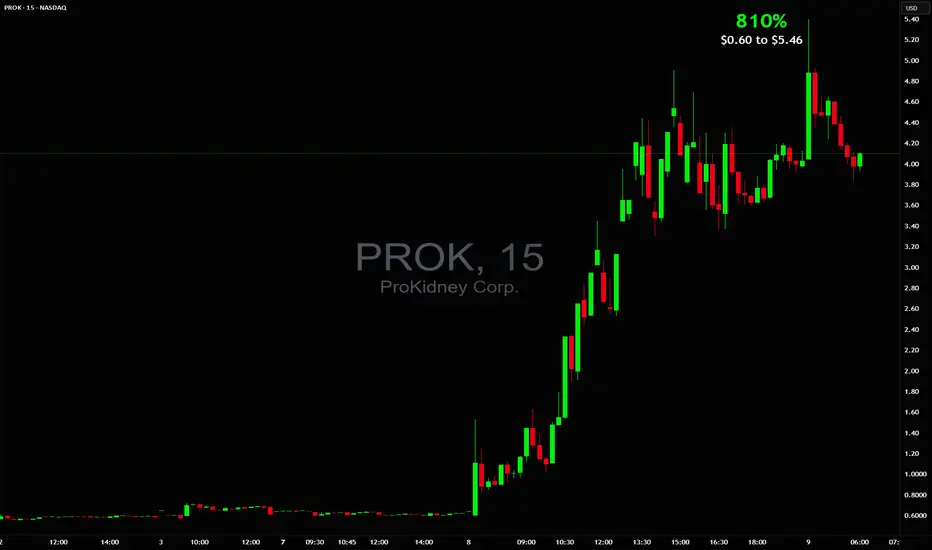
BIG 810% in 1 day $0.60 to $5.46💥BIG 810% in 1 day 📈 $0.60 to $5.46 there were almost more halts than candlesticks that's how wildly it traded NASDAQ:PROK
Other active stocks: NASDAQ:SCAG NASDAQ:BTCS NYSE:SRFM NASDAQ:BMGL NYSE:WOLF
#stocks #stockmarket #trading #trader #daytrade #strategy #teamwork #chart #analysis
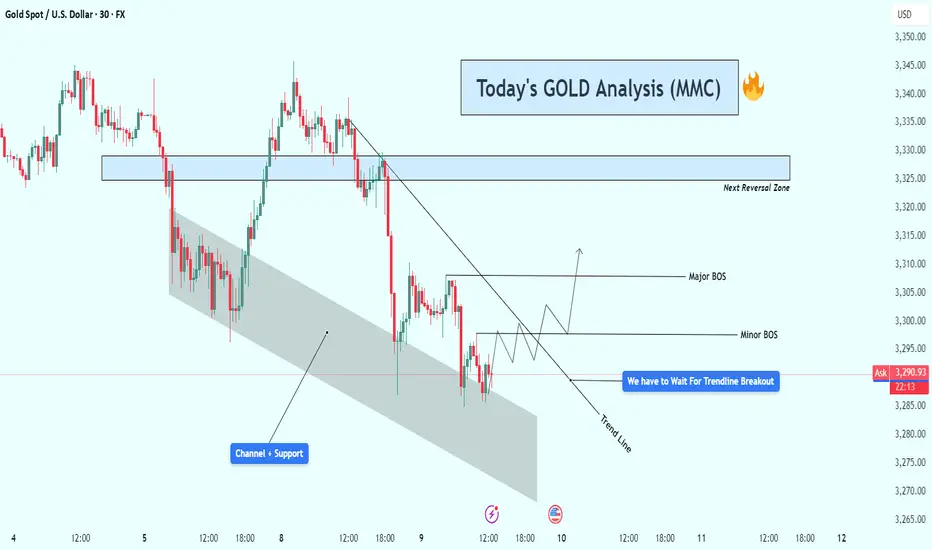
Gold (XAU/USD) Technical Analysis : Structural Analysis + TargetGold is currently trading near $3,292 on the 30-minute timeframe, showing classic signs of accumulation and compression within a well-respected descending channel. The current price action is approaching a critical decision zone, and the market is offering potential clues for both short-term and swing traders.
🔎 Detailed Breakdown of Chart Elements:
🔷 1. Descending Channel & Dynamic Support
Gold has been moving inside a falling channel, with price repeatedly reacting to both the upper and lower boundaries.
The lower boundary of the channel, currently acting as support, has been tested multiple times, suggesting a strong buying interest at this level.
This channel also aligns with the broader downtrend structure, giving sellers confidence while also creating interest for counter-trend buyers looking for reversal setups.
📐 2. Trendline Pressure and Compression
A downward sloping trendline, drawn from the recent swing highs, continues to apply bearish pressure.
Price is squeezing between the channel support and this descending trendline — a tight range compression, which often precedes a volatile breakout.
The analysis notes: “We have to wait for a trendline breakout” – this is a crucial technical signal that will determine the next move.
🚧 3. Break of Structure (BOS) Zones
Two potential bullish BOS (Break of Structure) levels have been identified:
Minor BOS (~$3,300):
A break above this level may signal short-term bullish intent and invalidate minor lower highs.
Early confirmation for buyers to enter with tight risk management.
Major BOS (~$3,310):
This is the key swing high which, if broken, would invalidate the current bearish structure and flip market sentiment bullish.
A strong bullish candle closing above this level could signal the start of a larger upward leg.
📍 4. Next Reversal Zone (Supply Area: $3,320 – $3,330)
This zone represents a strong supply area where previous price action saw heavy selling.
If bulls manage to clear the BOS zones, this area becomes the next target/resistance.
Price reaching this level could lead to a pullback, making it an ideal area for partial take-profits or reassessment of continuation trades.
📈 5. Scenario Planning & Strategy
✅ Bullish Bias (If Breakout Occurs):
Wait for a confirmed breakout above the trendline and Minor BOS with volume.
Ideal long entry would be on the retest of the trendline (now acting as support).
First target: Major BOS, then extend to the Reversal Zone.
Stop-loss can be placed below the channel support or latest swing low.
🚫 Bearish Continuation (If No Breakout):
If price fails to break above the trendline and continues to reject at resistance, sellers may look to short the retest of the trendline.
Targets can be set at the channel's lower boundary or previous lows.
Confirmation: Bearish engulfing patterns, rejection wicks, or divergence.
🧠 Technical Summary & Outlook
Gold is currently in a neutral to slightly bullish consolidation, showing early signs of demand at the bottom of the channel. The market is in "wait-and-watch" mode — traders should focus on the trendline breakout, which will serve as the trigger for directional bias.
The structure is clean, zones are well defined, and potential is high for both scalping and intraday setups. Traders are advised to stay patient and follow price action confirmation before entering trades.
📌 Key Levels to Watch:
Support Zone: $3,280 – $3,285 (Channel Base)
Trendline Resistance: ~$3,294–$3,296
Minor BOS: ~$3,300
Major BOS: ~$3,310
Reversal Zone (Supply): $3,320 – $3,330
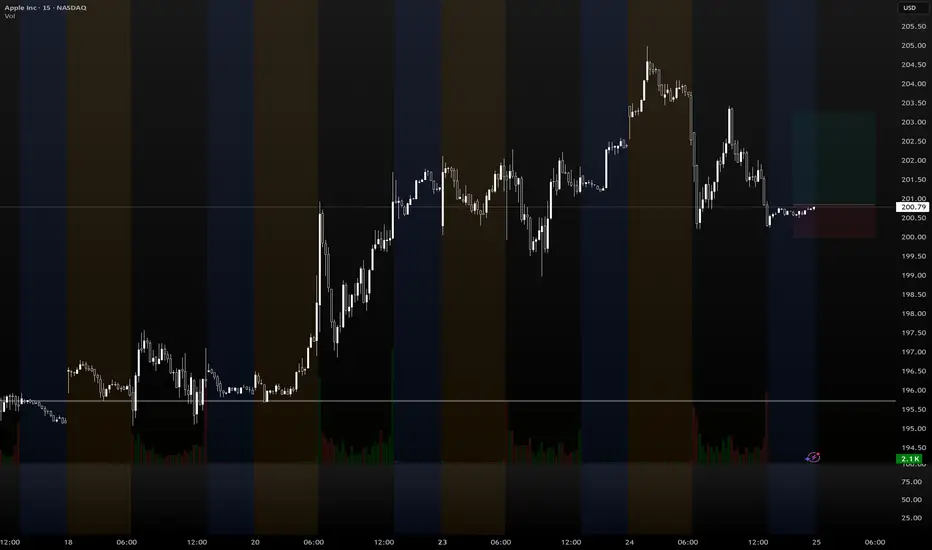
(Daytrading) APPL going upH1 chart is respecting the uptrend.
Price has retested the 50 SMA on the H1 timeframe.
Price also touched the Ichimoku Cloud on H1.
→ Based on the risk-to-reward ratio, I’m expecting a Call position.
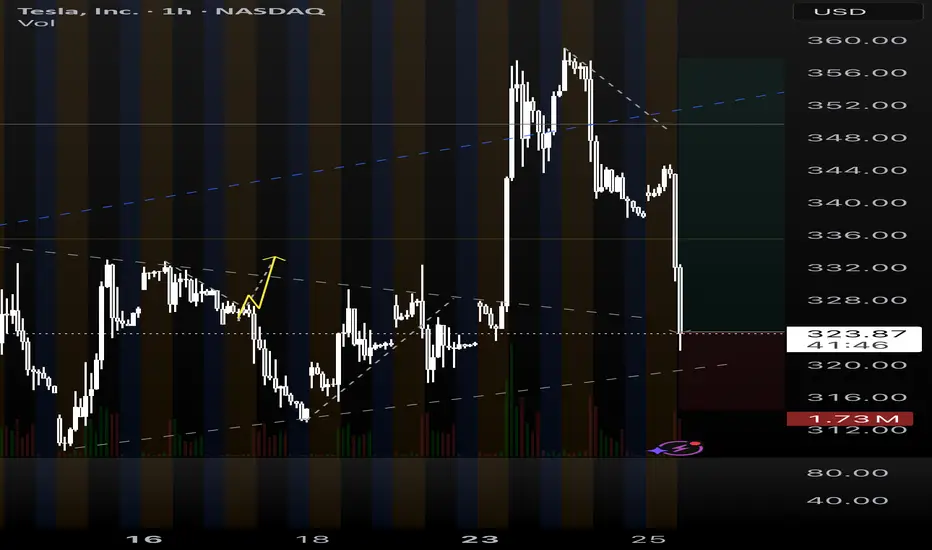
TSLA (daytrading) break out and retest1. Still watching here (down trend is too strong)
We can see break out patterm
2. And came back to restest. But i worry about that tsla usually doesnt restest like that.
3. Hit sma 200 h1
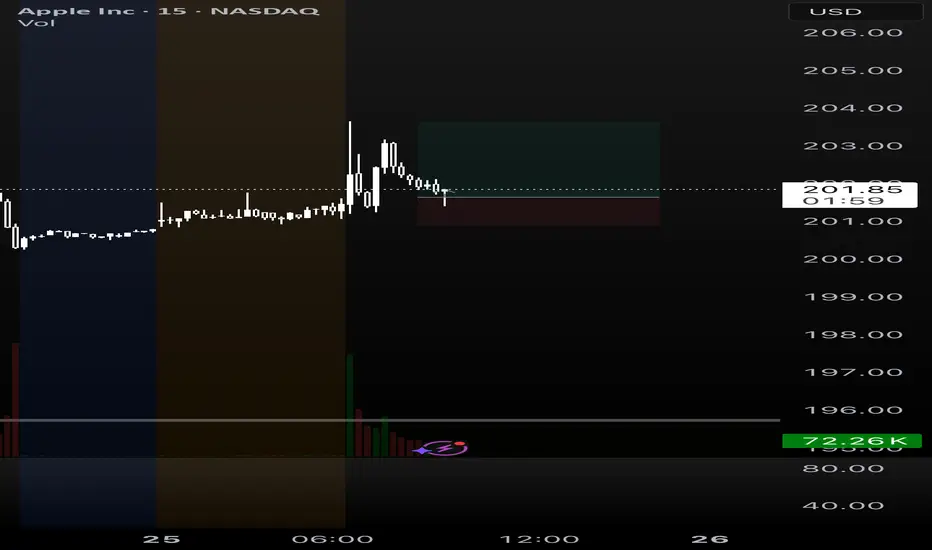
(Daytring) APPL quickly trade1. Premarket created a support line
2. Sma 200,50 is here
3. Price goes up in the moring just pull back to retest.
=> entry. Take profit whenever i feel good
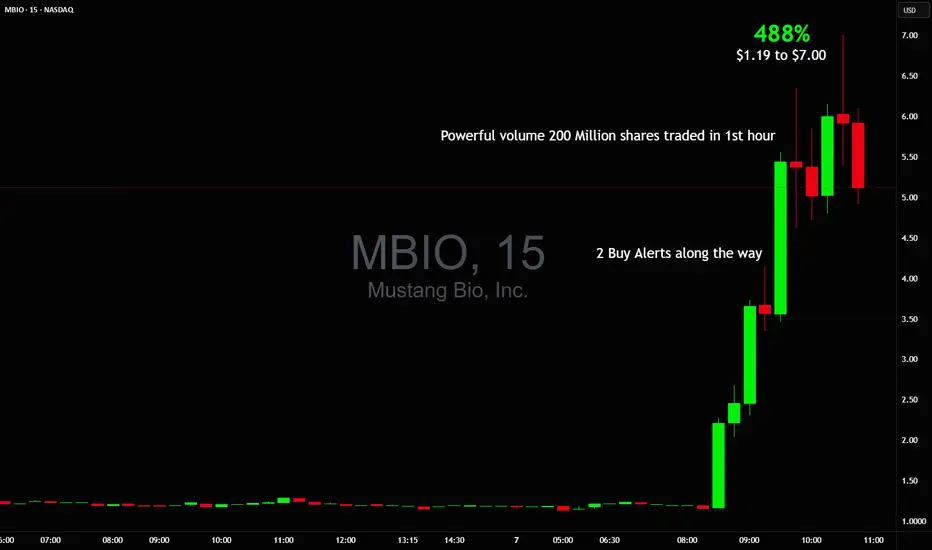
$1 to $7 in minutes +488% vertical $MBIO$1 to $7 in minutes 🚀🤑
Week barely started, already sitting on +30% realized profit from 3 sniper trades NASDAQ:MBIO 2x and NYSE:WOLF
Gold buying levels Hello everyone today Monday 7 july gold
Support 3330 level the price support this level if you plan for gold buy wait confirmation candle like bullish engulfing etc tp - 3343 sl - 3325 try at least 1:2 trade 1% risk overall captial
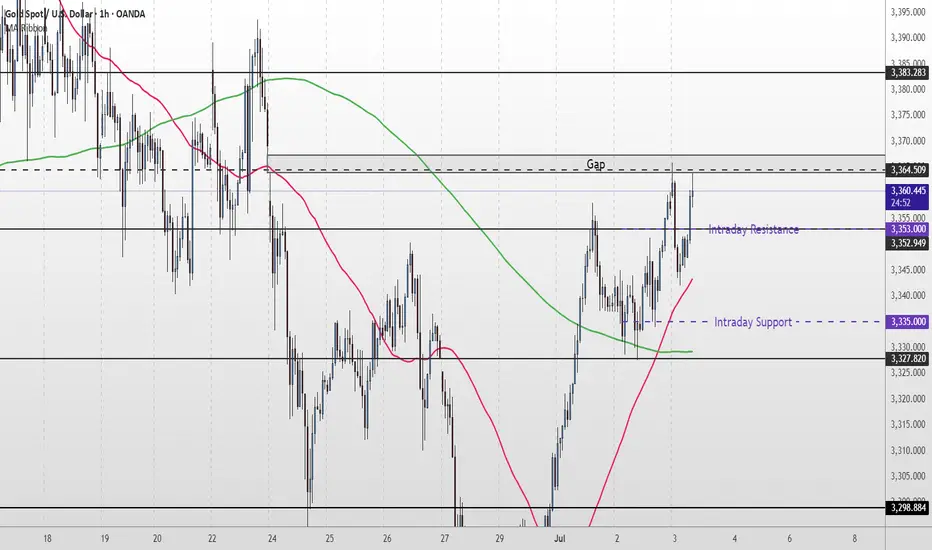
Gold Short Term OutlookYesterday, we highlighted that gold had reclaimed the 200MA and that the $3,327 support level needed to hold for further upside. Since then, price has steadily climbed and is now testing the $3,364 resistance — a level that also aligns with an unfilled gap.
Price action remains bullish for now, with price holding firmly above both the 50MA and 200MA.
If buyers manage to clear and hold above $3,364, we could see further upside toward $3,383 and $3,400, with possible extension into $3,418.
However, if price fails to break above $3,364, we may see a pullback into the $3,335–$3,327 zone. A break below there could open the door for a deeper drop into $3,298 or even $3,270.
📌 Key Levels to Watch:
Resistance:
$3,364 • $3,383 • $3,400 • $3,418
Support:
$3,352 •$3,335 - $3,327 • $3,298 • $3,270
🧠 Fundamental Focus:
📌 ADP Non-Farm Employment Change
📌 Initial Jobless Claims
📌 ISM Services PMI
📌 ISM Non-Manufacturing PMI
⚠️ With multiple red folder events on the calendar, expect elevated intraday volatility. Manage risk accordingly.
HUGE +979% day $4 to $46 on 100M shares traded $BMNR🚀 HUGE +979% day $4 to $46 BMNR on 100M shares traded 🤯
Shortsellers were trying all kinds of manipulations during the day but at the end got squeezed after hours
#stockmarket #stocktrading #trader #daytrading #chart #10X

GBP/CAD (Two Trade Recaps) EUR/NZD Long and GBP/JPY LongEUR/NZD Long
Minimum entry requirements:
- If tight non-structured 15 min continuation forms, 5 min risk entry within it if the continuation is structured on the 5 min chart or reduced risk entry on the break of it.
- If tight structured 15 min continuation forms, reduced risk entry on the break of it or 15 min risk entry within it.
- If tight non-structured 1H continuation forms, 15 min risk entry within it if the continuation is structured on the 15 min chart or reduced risk entry on the break of it.
- If tight structured 1H continuation forms, 1H risk entry within it or reduced risk entry on the break of it.
GBP/JPY Long
Minimum entry requirements:
- Tap into area of value.
- 1H impulse up above area of value.
- If tight non-structured 15 min continuation follows, 5 min risk entry within it if the continuation is structured on the 5 min chart or reduced risk entry on the break of it.
- If tight structured 15 min continuation follows, reduced risk entry on the break of it or 15 min risk entry within it.

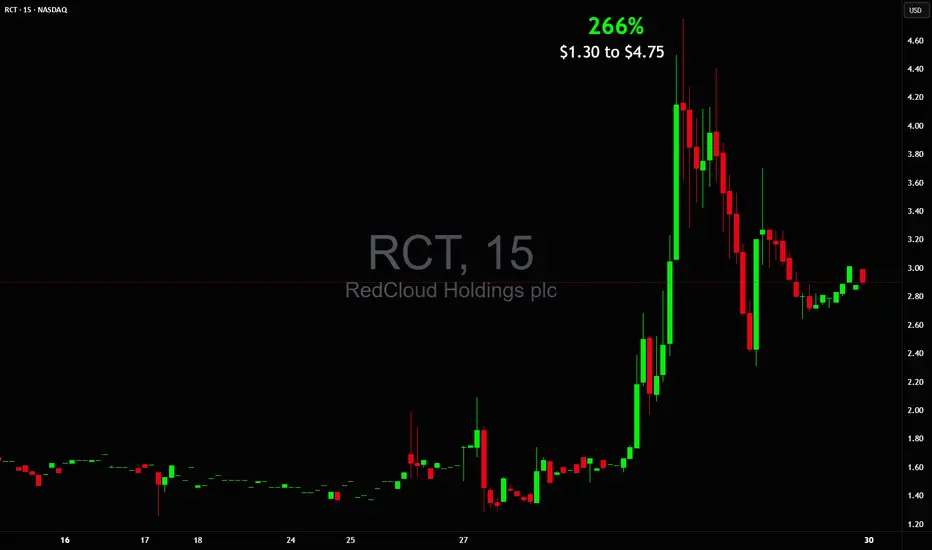
+266% in ONE DAY from $1.30 to $4.75 $RCT🔥 +266% in ONE DAY from $1.30 to $4.76 🚀
Spotted the setup early, but my official safety criteria checklist wasn't all green due to price action until later when it was too late NASDAQ:RCT
Sometimes discipline keeps you out early on even when the move goes wild
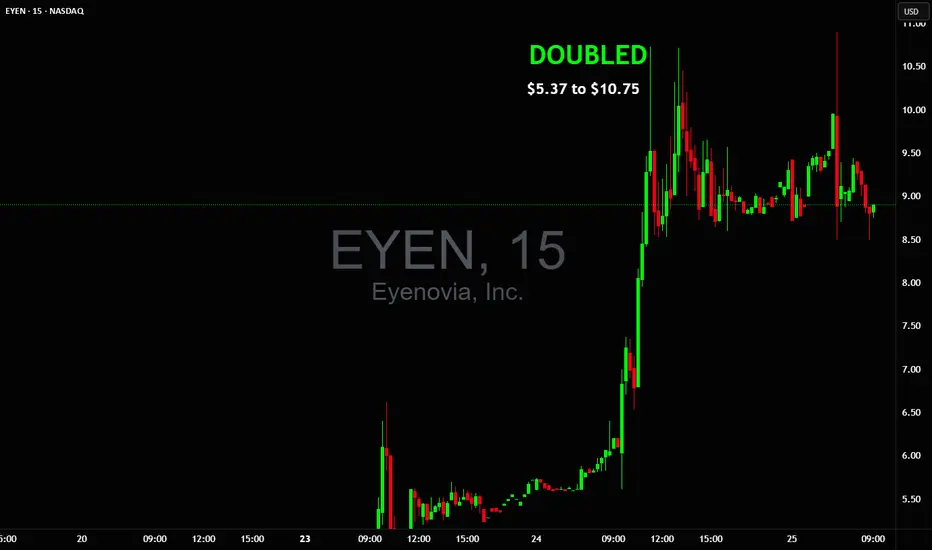
Ready for a new day, please bring another doubler like $EYENReady for a new day, please bring another doubler like NASDAQ:EYEN $5 to $10 or NYSE:SRFM yesterday which were the only 2 trades made and 2 nice wins🙏🏻
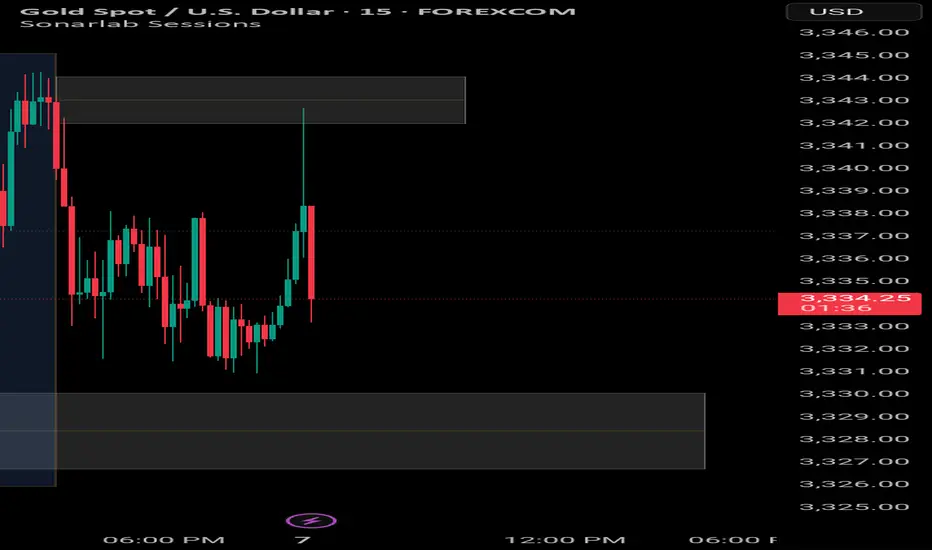
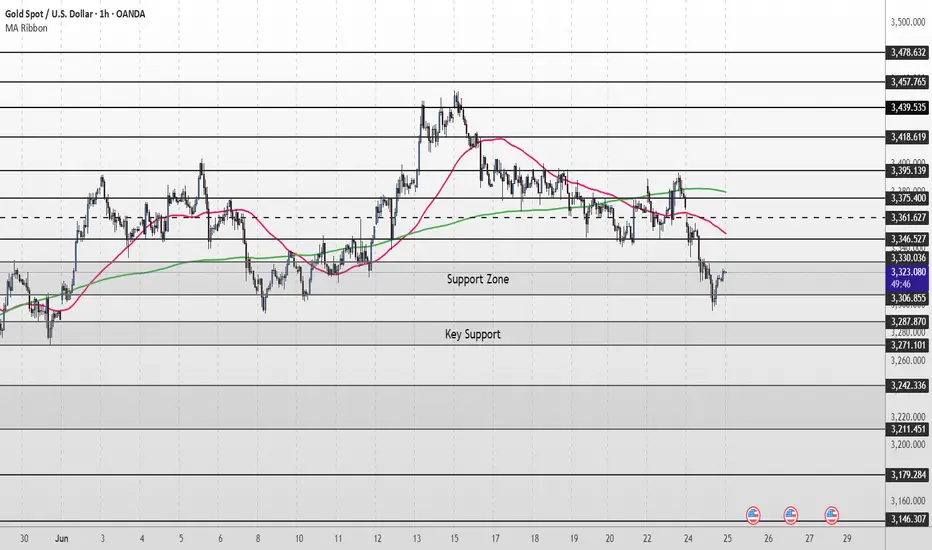
Gold Short Term OutlookGold dipped into the Support Zone but failed to sustain the breakdown below it. After briefly breaking below the zone, price has rebounded and is now attempting a short-term recovery.
However, structure remains bearish, with price trading below both the 50MA and 200MA, signalling continued downside pressure unless momentum shifts.
For bullish momentum to continue, we need to see a clean break and hold above $3,330, which may open the path toward $3,346, then $3,361.
If the move up doesn’t hold, the next reaction is expected near key support.
🔑 Key Levels:
Resistance:
$3,330 • $3,346 • $3,361 • $3,375
Support:
$3,306 • $3,287 • $3,271 • $3,242
📌 Stay patient and wait for confirmation before committing to a direction.
06/24/25 Trade Journal, and ES_F Stock Market analysis EOD accountability report: -717.50
Sleep: 4.5 hours - heat waves in nyc
Overall health: meh
** VX Algo System Signals from (9:30am to 2pm)** 4/4
9:40 AM Market Structure flipped bullish on VX Algo X3! 5 pts
9:42 AM VXAlgo NQ X3 Buy Signal (failed)
11:00 AM Market Structure flipped bullish on VX Algo X3! 20pt
11:58 AM VXAlgo NQ X1 Sell Signal (failed)
What’s one key lesson or takeaway from today?
and What major news or event impacted the market today?
There are days that the algo will lose but you just gotta trust the process and execute accordingly with a stoploss.
What are the critical support levels to watch?
--> Above 6130 = Bullish, Under 6125= Bearish
Video Recaps -->https://tradingview.sweetlogin.com/u/WallSt007/#published-charts

EUR/AUD Short, EUR/NZD Short, NZD/USD Long and AUD/NZD ShortEUR/AUD Short
Minimum entry requirements:
- If tight non-structured 1H continuation forms, 15 min risk entry within it if the continuation is structured on the 15 min chart or reduced risk entry on the break of it.
- If tight structured 1H continuation forms, 1H risk entry within it or reduced risk entry on the break of it.
EUR/NZD Short
Minimum entry requirements:
- If tight non-structured 1H continuation forms, 15 min risk entry within it if the continuation is structured on the 15 min chart or reduced risk entry on the break of it.
- If tight structured 1H continuation forms, 1H risk entry within it or reduced risk entry on the break of it.
NZD/USD Long
Minimum entry requirements:
- If tight non-structured 1H continuation forms, 15 min risk entry within it if the continuation is structured on the 15 min chart.
- If tight structured 1H continuation forms, 1H risk entry within it.
AUD/NZD Short
Minimum entry requirements:
- If tight non-structured 1H continuation forms, 15 min risk entry within it if the continuation is structured on the 15 min chart.
- If tight structured 1H continuation forms, 1H risk entry within it.

EUR/AUD ShortEUR/AUD Short
Minimum entry requirements:
- 1H impulse down below area of interest.
- If tight non-structured 5 min continuation follows, reduced risk entry on the break of it.
- If tight structured 5 min continuation follows, reduced risk entry on the break of it or 5 min risk entry within it.
- If tight non-structured 15 min continuation follows, 5 min risk entry within it if the continuation is structured on the 5 min chart or reduced risk entry on the break of it.
- If tight structured 15 min continuation follows, reduced risk entry on the break of it or 15 min risk entry within it.

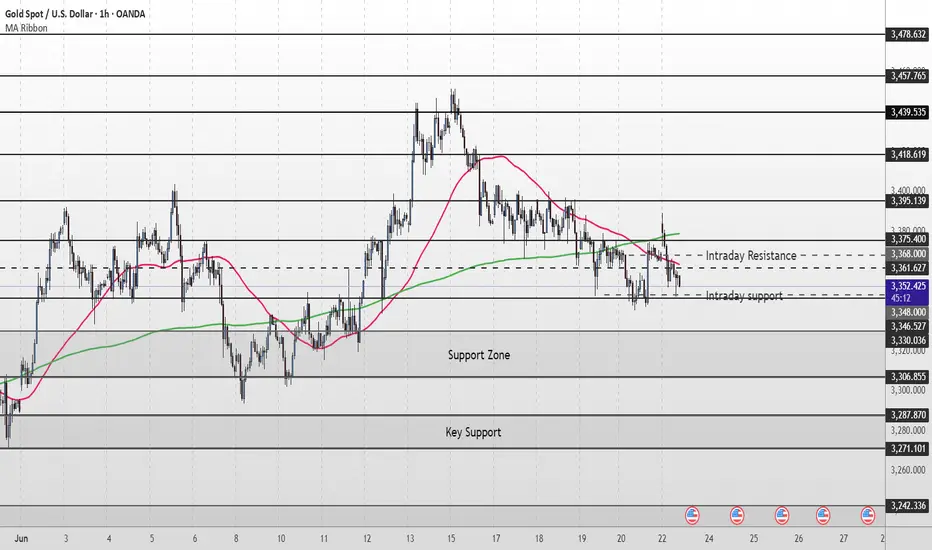
Gold Short Term OutlookGold is currently trading around $3,368, caught between dynamic moving average resistance and an intraday resistance zone.
Price must break and hold above the $3,378 resistance to open the path toward $3,395. A confirmed break above the key $3,395 level could signal the start of the next bullish leg.
However, repeated failure to break above $3,395 — or even $3,378 — may drag gold lower into key support zones.
📌 Key Levels to Watch:
Resistance:
$3,375 • $3,395 • $3,418 • $3,439
Support:
$3,361 • $3,346 • $3,330 / $3,306
$3,287 – Critical demand zone
🧠 Fundamental Insight:
Gold remains supported amid rising geopolitical tensions. Over the weekend, U.S. airstrikes targeted Iranian nuclear sites, escalating concerns over a broader conflict in the Middle East. This has reignited safe-haven demand, with gold catching a bid despite recent technical pullbacks.
Meanwhile, traders are weighing softer U.S. inflation signals against the Fed’s cautious stance. If tensions persist and economic data weakens, gold could benefit from both risk-off flows and increased speculation around potential rate cuts.
Gold Medium Term OutlookGold is currently trending within a rising channel after rejecting the $3,439 resistance zone, which marked a new Higher High (HH). Price is respecting the ascending channel support and is now testing the 50MA. The uptrend remains intact, with a sequence of Higher Lows (HL) and Higher Highs (HH) forming within the channel.
A break and hold above $3,378 could open the path for a re-test of $3,439 and potentially $3,501. However, failure to hold the rising channel support may shift momentum bearish, with $3,303 and $3,226 as the next major downside targets.
📌 Key Levels to Watch This Week:
Resistance: $3,378 • $3,439 • $3,501
Support: $3,303 • $3,226 • $3,171
🧠 Fundamental Insight:
Gold remains supported amid rising geopolitical tensions. Over the weekend, U.S. airstrikes targeted Iranian nuclear sites, escalating concerns over a broader conflict in the Middle East. This has reignited safe-haven demand, with gold catching a bid despite recent technical pullbacks.
Meanwhile, traders are weighing softer U.S. inflation signals against the Fed’s cautious stance. If tensions persist and economic data weakens, gold could benefit from both risk-off flows and increased speculation around potential rate cuts.

+177% in last hour $1.33 to $3.69 $NXTTThis is what I mean when I say Power Hour 🚀 NASDAQ:NXTT
The move triggered exactly at 15:00 and went into power vertical
Can't wait for market to open next week, hot summer coming 🤑

Another Banger $2.82 to $13.10 with 364% total move $APVOCatching just a piece of this kind of move pays a lot when moves are 300%+
Sitting at +72% realized gain over the past 3 days since the week started, from just 5 trades!
More to come this market is awesome
NASDAQ:APVO
