DCR/USDT Breaks 3-Year Downtrend – Macro Reversal in Motion📍 Macro Overview:
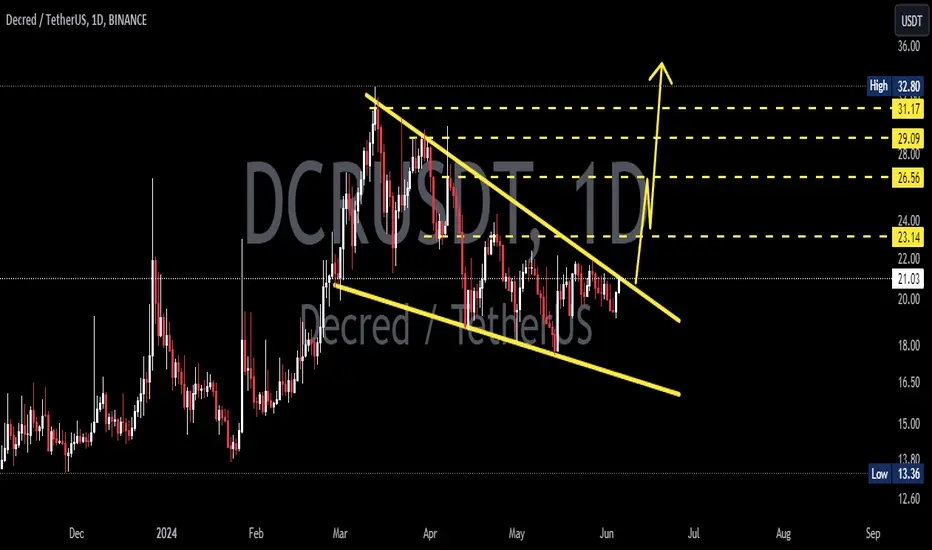
After being trapped in a multi-year downtrend since early 2021, Decred (DCR) has now shown signs of a major breakout from the long-term descending trendline. This moment could mark a pivotal shift from accumulation to expansion, offering a strong bullish macro setup.
🧠 Technical Pattern & Structure Analysis:
🔸 Dominant Pattern:
A long-standing descending triangle has formed, with a solid demand zone between $11.00 - $13.00, tested multiple times over the past 2 years.
While traditionally a bearish pattern, breaking to the upside here signals a reversal structure and the start of bullish momentum.
🔸 Breakout Confirmation:
Price has now clearly broken above the long-term downtrend line originating from the 2021 top.
This breakout implies a macro trend shift, opening the door for a series of higher highs and higher lows.
🔸 Strong Accumulation Zone:
The yellow zone ($11–$13) has proven to be a high-conviction demand area, likely indicating institutional accumulation.
✅ Bullish Scenario (High Probability):
If the breakout holds and volume confirms:
📌 Key Upside Targets:
1. $24.71 → First major resistance
2. $28.44 → Psychological level and historical S/R flip
3. $34.00 → Local top from recent past
4. $39.46 → Strong horizontal resistance
5. $67.89 → 2022 resistance and bullish confirmation level
6. $104.40 → Mid-term parabolic extension target
📈 Likely structure: Breakout → Retest → Multi-wave rally upward.
> Strategy: Ideal for Buy on Retest or Swing Long setups.
❌ Bearish Scenario (Low Probability – Risk Management):
If the breakout fails and price dips back below $13:
Expect potential pullback to $11.00 - $10.00 support
Worst-case bearish continuation could revisit $6.00 (macro support)
Would signal a false breakout and continuation of the bearish trend
> Risk Strategy: Watch the volume – weak volume could imply a fakeout.
🔍 Supporting Technical Signals:
📊 Volume: Strong volume confirmation is essential for breakout validity
📈 Indicators Supporting Bullish Bias:
Weekly RSI hovering at neutral-bullish zones
Potential for a weekly EMA crossover (golden cross)
OBV shows signs of increasing accumulation pressure
🧭 Conclusion & Strategy Insight:
This chart is signaling a high-conviction macro opportunity.
Breaking out from a 3-year downtrend is a rare technical event that has historically led to exponential moves. The key is confirmation through volume and healthy consolidation above the breakout line.
> "The longer the base, the stronger the breakout."
#DCR #Decred #AltcoinBreakout #MacroReversal #CryptoChartAnalysis #BullishSetup #CryptoTechnicalAnalysis #TrendReversal #AltcoinSeason
Dcrusdsignals
DCRUSDT 1WDCR ~ 1W Analysis
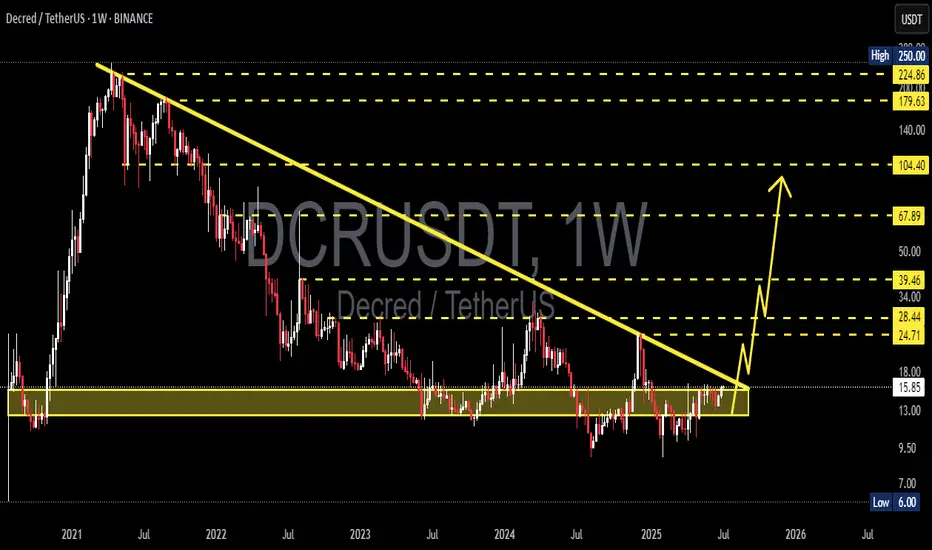
#DCR Buy gradually from here with a short -term target of at least 20%+. This is a very good support to start buying again.
DCRUSDT 1WDCR ~ 1W Analysis
#DCR In Time Frame 1W re -test this support block. Buy from here if you still have a Conviction on this coin with a minimum target of 20%+
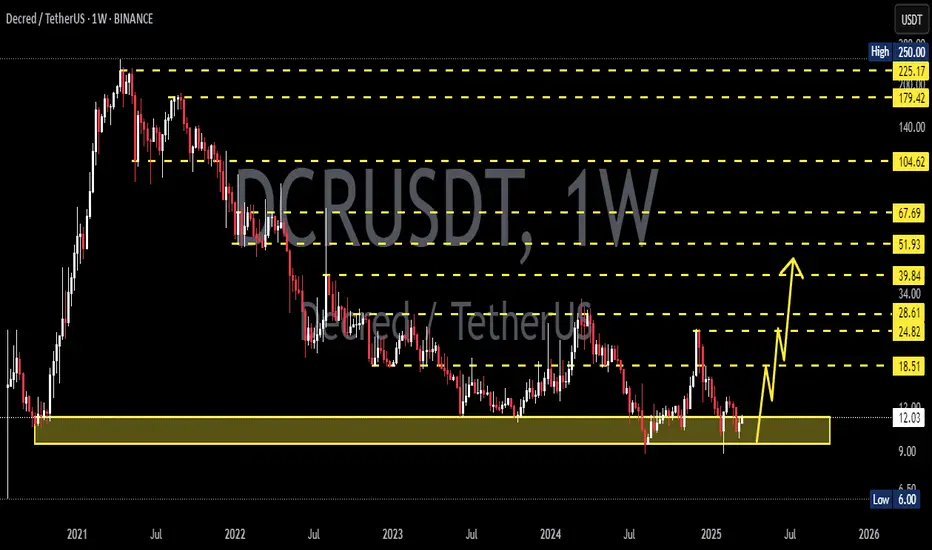
DCRUSDTDCR ~ 1W ✅
#DCR If you have Conviction on this coin,. maybe you need to consider this support block to place a small purchase here. at least for the short term 20%+

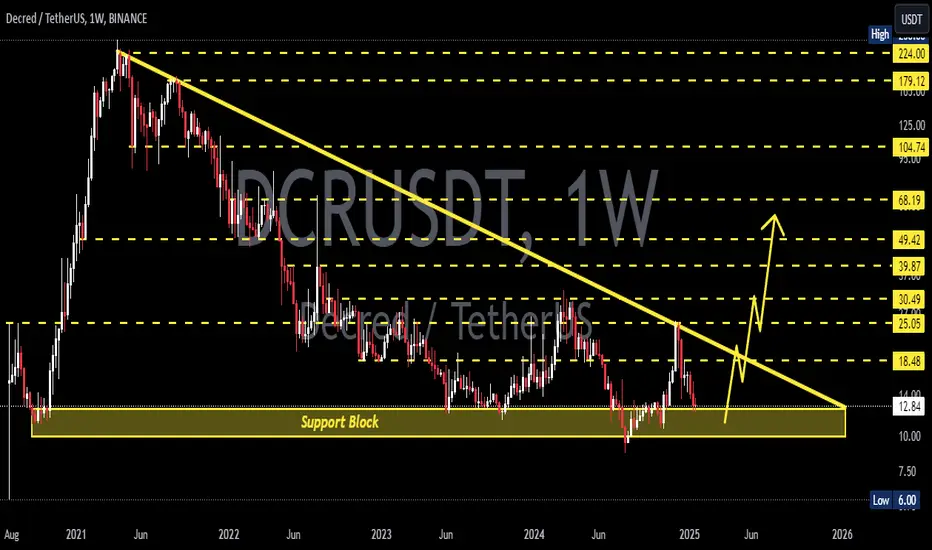
DCRUSD 1DDCR ~ 1D
#DCR Make purchases gradually after successfully breaking through the resistance line in this pattern, with a minimum target of 15%+
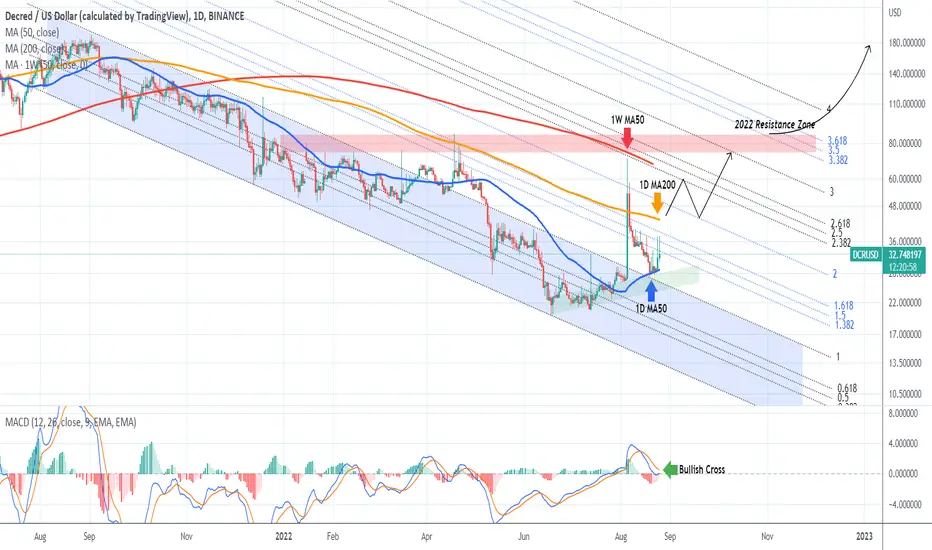
DCRUSD held the 1D MA50. Path to the 2022 Resistance Zone.Decred (DCRUSD) is staging a short-term rise after holding the 1D MA50 (blue trend-line) as a Support since the August 19 pull-back. The 1D MA200 (orange trend-line) is the first Resistance but this has already been broken on the August 05 spike, which was though rejected near the 1W MA50 (red trend-line).
Those are basically the next pivot levels with the ultimate test being the 75.6500 - 86.4000 Resistance Zone, which has been holding for the majority of 2022.
--------------------------------------------------------------------------------------------------------
** Please support this idea with your likes and comments, it is the best way to keep it relevant and support me. **
--------------------------------------------------------------------------------------------------------