DCR/USDT Breaks 3-Year Downtrend – Macro Reversal in Motion📍 Macro Overview:
After being trapped in a multi-year downtrend since early 2021, Decred (DCR) has now shown signs of a major breakout from the long-term descending trendline. This moment could mark a pivotal shift from accumulation to expansion, offering a strong bullish macro setup.
🧠 Technical Pattern & Structure Analysis:
🔸 Dominant Pattern:
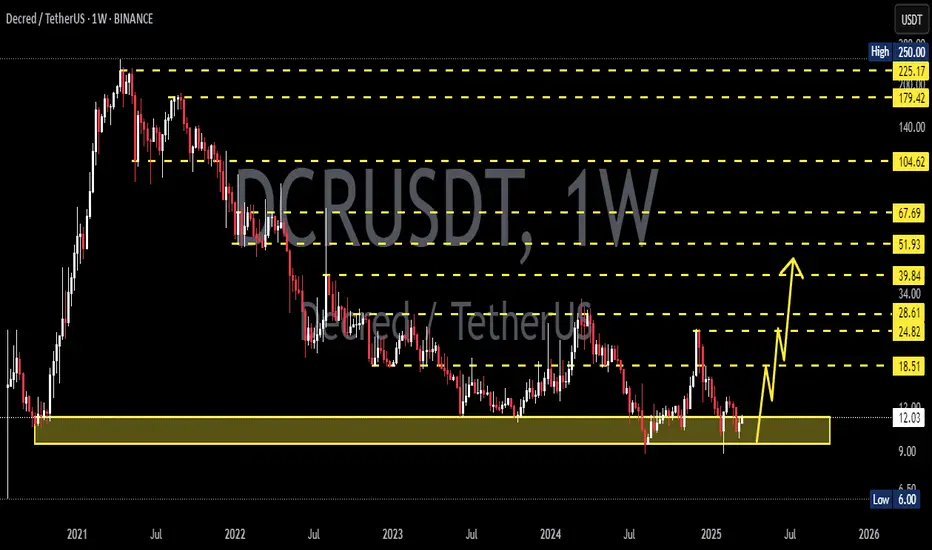
A long-standing descending triangle has formed, with a solid demand zone between $11.00 - $13.00, tested multiple times over the past 2 years.
While traditionally a bearish pattern, breaking to the upside here signals a reversal structure and the start of bullish momentum.
🔸 Breakout Confirmation:
Price has now clearly broken above the long-term downtrend line originating from the 2021 top.
This breakout implies a macro trend shift, opening the door for a series of higher highs and higher lows.
🔸 Strong Accumulation Zone:
The yellow zone ($11–$13) has proven to be a high-conviction demand area, likely indicating institutional accumulation.
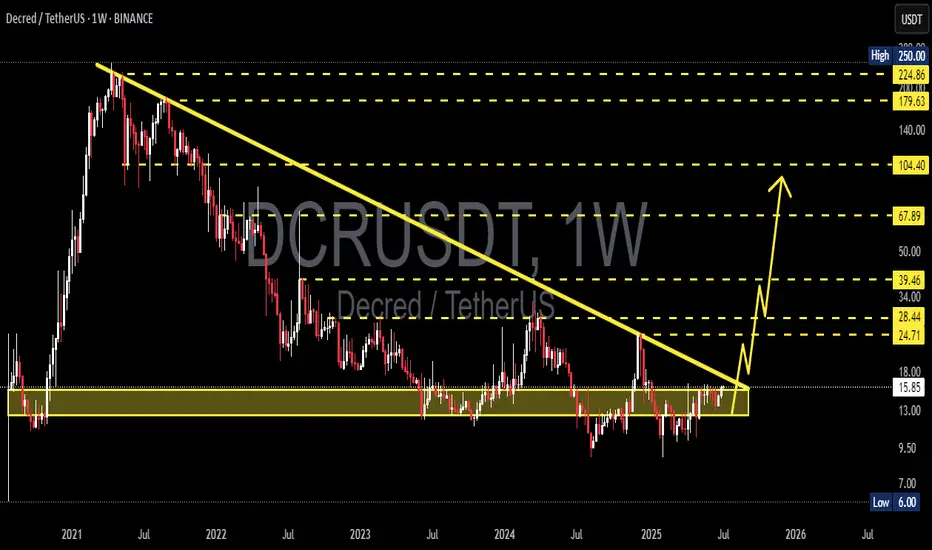
✅ Bullish Scenario (High Probability):
If the breakout holds and volume confirms:
📌 Key Upside Targets:
1. $24.71 → First major resistance
2. $28.44 → Psychological level and historical S/R flip
3. $34.00 → Local top from recent past
4. $39.46 → Strong horizontal resistance
5. $67.89 → 2022 resistance and bullish confirmation level
6. $104.40 → Mid-term parabolic extension target
📈 Likely structure: Breakout → Retest → Multi-wave rally upward.
> Strategy: Ideal for Buy on Retest or Swing Long setups.
❌ Bearish Scenario (Low Probability – Risk Management):
If the breakout fails and price dips back below $13:
Expect potential pullback to $11.00 - $10.00 support
Worst-case bearish continuation could revisit $6.00 (macro support)
Would signal a false breakout and continuation of the bearish trend
> Risk Strategy: Watch the volume – weak volume could imply a fakeout.
🔍 Supporting Technical Signals:
📊 Volume: Strong volume confirmation is essential for breakout validity
📈 Indicators Supporting Bullish Bias:
Weekly RSI hovering at neutral-bullish zones
Potential for a weekly EMA crossover (golden cross)
OBV shows signs of increasing accumulation pressure
🧭 Conclusion & Strategy Insight:
This chart is signaling a high-conviction macro opportunity.
Breaking out from a 3-year downtrend is a rare technical event that has historically led to exponential moves. The key is confirmation through volume and healthy consolidation above the breakout line.
> "The longer the base, the stronger the breakout."
#DCR #Decred #AltcoinBreakout #MacroReversal #CryptoChartAnalysis #BullishSetup #CryptoTechnicalAnalysis #TrendReversal #AltcoinSeason
Dcrusdtcoin
DCRUSDT 1WDCR ~ 1W Analysis
#DCR Buy gradually from here with a short -term target of at least 20%+. This is a very good support to start buying again.
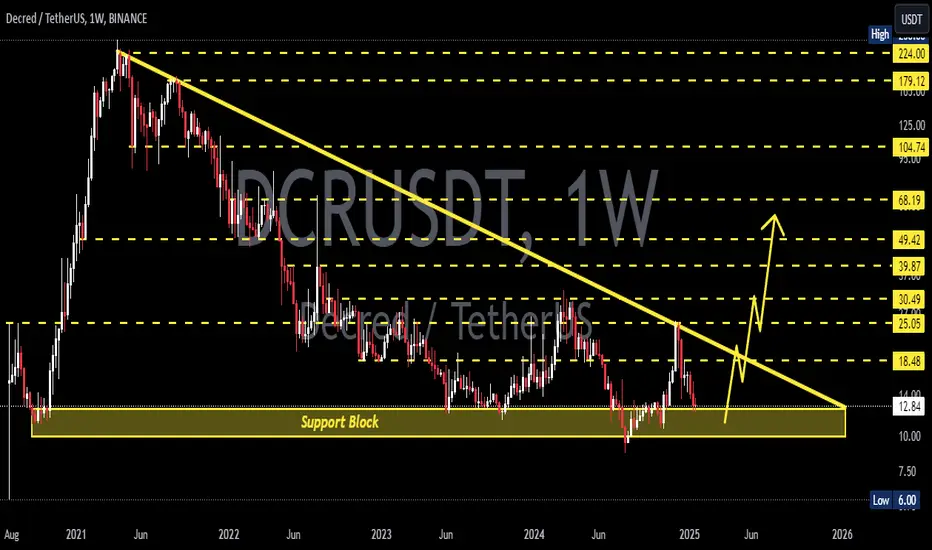
DCRUSDT 1WDCR ~ 1W Analysis
#DCR In Time Frame 1W re -test this support block. Buy from here if you still have a Conviction on this coin with a minimum target of 20%+
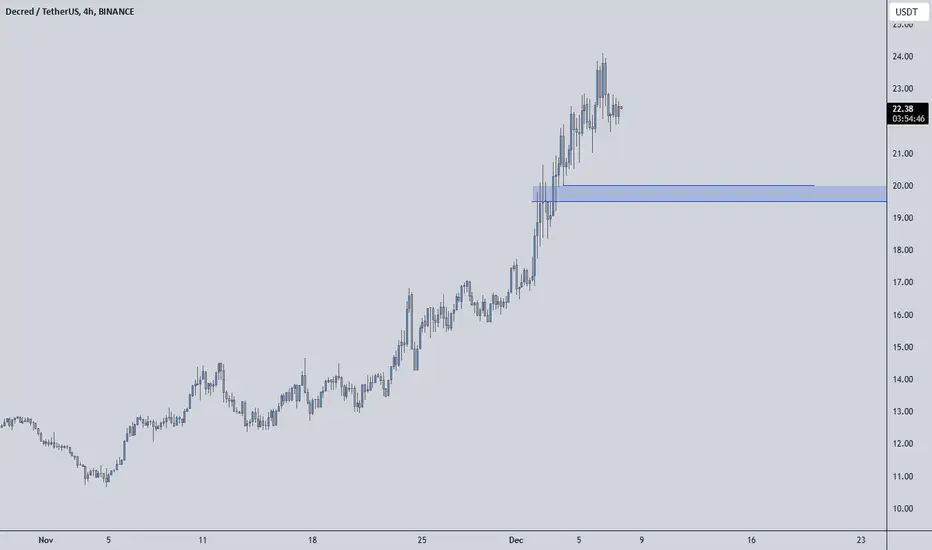
DCRUSDT Analysis: Key Demand Zone IdentifiedThe blue box displayed on the chart represents a valuable demand zone , where potential buying interest could arise. This area is carefully chosen based on advanced analysis techniques.
Highlights:
Demand Zone: The blue box is a strong candidate for a reaction from buyers.
Market Awareness: Align trades with overall market conditions for better success.
Confirmation Tools:
When trading within the blue box, I rely on indicators such as:
CDV (Cumulative Delta Volume)
Liquidity Heatmap
Volume Profile
Volume Footprint
Upward Market Structure Breaks on Lower Time Frames
Want to Learn?
If you'd like to learn how to use these techniques effectively, DM me for guidance on trading with precision.
Reminder:
Maintain disciplined risk management and always adapt to market conditions. Wishing you successful trades!
If you think this analysis helps you, please don't forget to boost and comment on this. These motivate me to share more insights with you!
I keep my charts clean and simple because I believe clarity leads to better decisions.
My approach is built on years of experience and a solid track record. I don’t claim to know it all, but I’m confident in my ability to spot high-probability setups.
If you would like to learn how to use the heatmap, cumulative volume delta and volume footprint techniques that I use below to determine very accurate demand regions, you can send me a private message. I help anyone who wants it completely free of charge.
My Previous Analysis (the list is long but I think it's kinda good : )
🎯 ZENUSDT.P: Patience & Profitability | %230 Reaction from the Sniper Entry
🐶 DOGEUSDT.P: Next Move
🎨 RENDERUSDT.P: Opportunity of the Month
💎 ETHUSDT.P: Where to Retrace
🟢 BNBUSDT.P: Potential Surge
📊 BTC Dominance: Reaction Zone
🌊 WAVESUSDT.P: Demand Zone Potential
🟣 UNIUSDT.P: Long-Term Trade
🔵 XRPUSDT.P: Entry Zones
🔗 LINKUSDT.P: Follow The River
📈 BTCUSDT.P: Two Key Demand Zones
🟩 POLUSDT: Bullish Momentum
🌟 PENDLEUSDT.P: Where Opportunity Meets Precision
🔥 BTCUSDT.P: Liquidation of Highly Leveraged Longs
🌊 SOLUSDT.P: SOL's Dip - Your Opportunity
🐸 1000PEPEUSDT.P: Prime Bounce Zone Unlocked
🚀 ETHUSDT.P: Set to Explode - Don't Miss This Game Changer
🤖 IQUSDT: Smart Plan
⚡️ PONDUSDT: A Trade Not Taken Is Better Than a Losing One
💼 STMXUSDT: 2 Buying Areas
🐢 TURBOUSDT: Buy Zones and Buyer Presence
🌍 ICPUSDT.P: Massive Upside Potential | Check the Trade Update For Seeing Results
🟠 IDEXUSDT: Spot Buy Area | %26 Profit if You Trade with MSB
📌 USUALUSDT: Buyers Are Active + %70 Profit in Total
🌟 FORTHUSDT: Sniper Entry +%26 Reaction
🐳 QKCUSDT: Sniper Entry +%57 Reaction
📊 BTC.D: Retest of Key Area Highly Likely
I stopped adding to the list because it's kinda tiring to add 5-10 charts in every move but you can check my profile and see that it goes on..

DCRUSDT: Blue Box as a Buyer ZoneThe blue box on the chart represents a key buyer zone, identified through meticulous technical analysis. This area signals a region where the price is likely to find strong support and attract buying interest, potentially leading to a reversal or upward movement.
1. Understanding the Buyer Zone
A buyer zone is a specific area on the chart where demand exceeds supply, often causing the price to bounce or rally.
Significance of the Blue Box: This zone highlights a demand area where institutional or retail buyers are expected to show interest.
Confluence Factors: The zone is supported by technical indicators such as Fibonacci retracements, historical support levels, or order block formations.
2. Why This Zone?
The blue box is not arbitrarily drawn; it is derived from a combination of the following analyses:
Market Structure: Price has consistently respected this area as a key level in the past, indicating its reliability.
Volume Analysis: High volume at this price range suggests a strong likelihood of buyer activity.
Fibonacci Retracement: The zone aligns with critical retracement levels, further solidifying its validity.
3. How to Trade the Blue Box
The blue box should be approached with a clear plan to manage risk and maximize returns.
Entry Strategy: Wait for the price to enter the blue box and look for confirmation signals like bullish candlestick patterns or volume spikes before entering a long position.
Stop-Loss Placement: Position your stop-loss just below the lower boundary of the blue box to account for false breakouts.
Take-Profit Levels: Target recent resistance areas or Fibonacci extensions for a favorable risk-to-reward ratio.
4. Key Notes
Keep an eye on market conditions and additional confirmations to refine your trade setup.
Volume spikes or bullish divergences can further validate the zone's strength.
Breakouts above nearby resistance after bouncing from the blue box may indicate a continuation of the uptrend.
I keep my charts clean and simple because I believe clarity leads to better decisions.
My approach is built on years of experience and a solid track record. I don’t claim to know it all, but I’m confident in my ability to spot high-probability setups.
My Previous Analysis
🐶 DOGEUSDT.P: Next Move
🎨 RENDERUSDT.P: Opportunity of the Month
💎 ETHUSDT.P: Where to Retrace
🟢 BNBUSDT.P: Potential Surge
📊 BTC Dominance: Reaction Zone
🌊 WAVESUSDT.P: Demand Zone Potential
🟣 UNIUSDT.P: Long-Term Trade
🔵 XRPUSDT.P: Entry Zones
🔗 LINKUSDT.P: Follow The River
📈 BTCUSDT.P: Two Key Demand Zones
🟩 POLUSDT: Bullish Momentum
🌟 PENDLEUSDT: Where Opportunity Meets Precision
🔥 BTCUSDT.P: Liquidation of Highly Leveraged Longs
🌊 SOLUSDT.P: SOL's Dip - Your Opportunity
🐸 1000PEPEUSDT.P: Prime Bounce Zone Unlocked
🚀 ETHUSDT.P: Set to Explode - Don't Miss This Game Changer
🤖 IQUSDT: Smart Plan
⚡️ PONDUSDT: A Trade Not Taken Is Better Than a Losing One
💼 STMXUSDT: 2 Buying Areas
DCRUSDTDCR ~ 1W ✅
#DCR If you have Conviction on this coin,. maybe you need to consider this support block to place a small purchase here. at least for the short term 20%+

#DCR/USDT#DCR
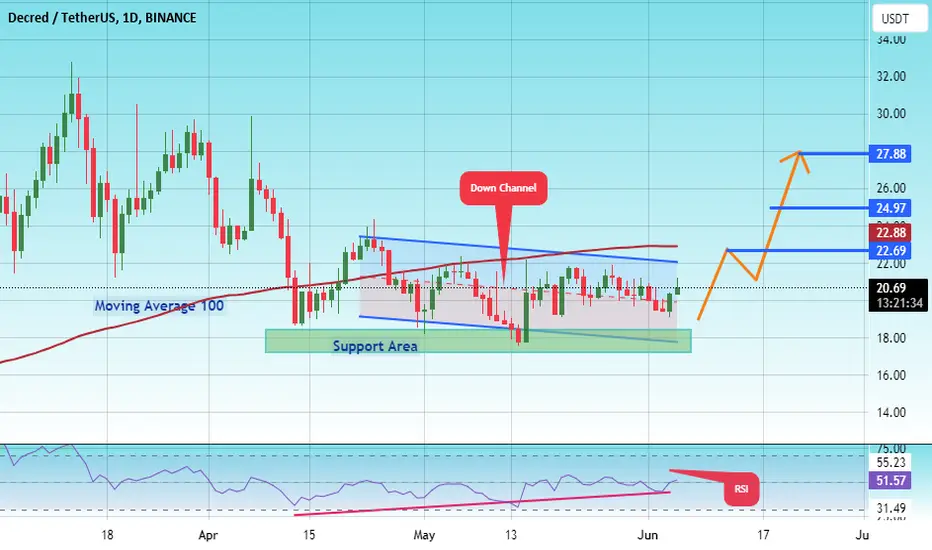
The price is moving within a 1-day descending channel pattern, which is a retracement pattern
We have bounced from a green support area at 18.00
We have a tendency to stabilize above the Moving Average 100
We have an upward trend on the RSI indicator that supports the rise and gives greater momentum
Entry price is 19.00
The first goal is 22.69
The second goal is 25.00
Third goal 27.88
DCRUSD 1DDCR ~ 1D
#DCR Make purchases gradually after successfully breaking through the resistance line in this pattern, with a minimum target of 15%+
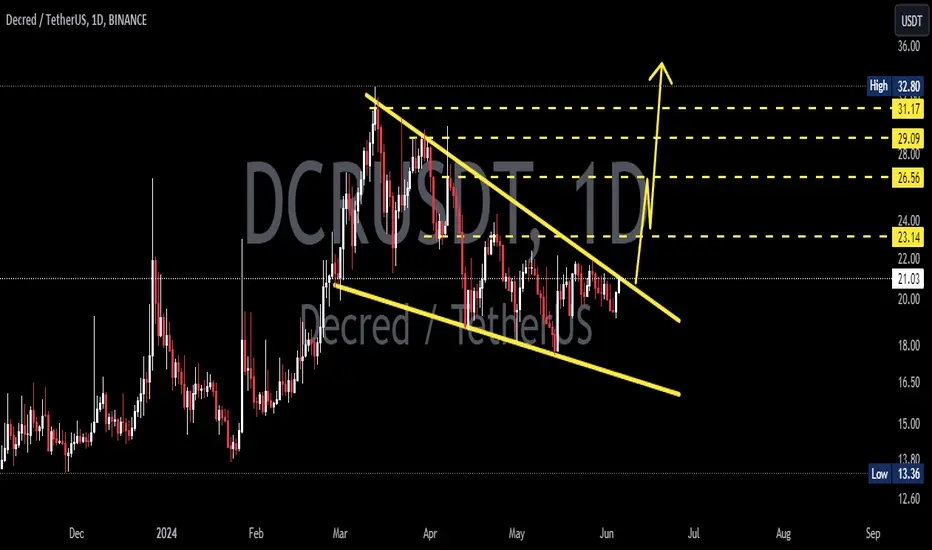
#DCRUSDT#DCR
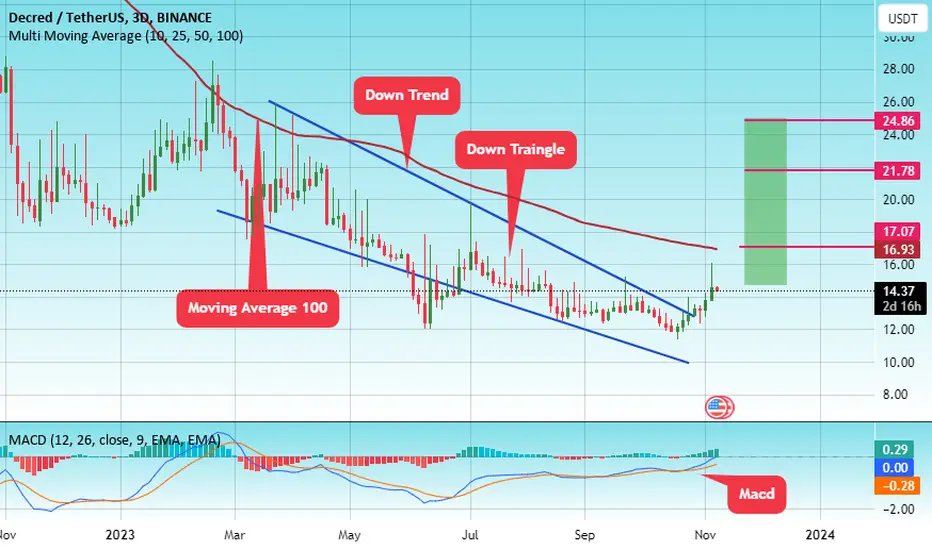
The price achieved approximately 35% rise since breaking the downtrend and the price reached $16
It is the main resistance price at Moving Average 100
This rise occurs after breaking the downtrend, which is the upper border of the descending triangle
It is supported by my selling saturation on the MACD
First goal 16
Second goal 21.78
Third goal 24.86
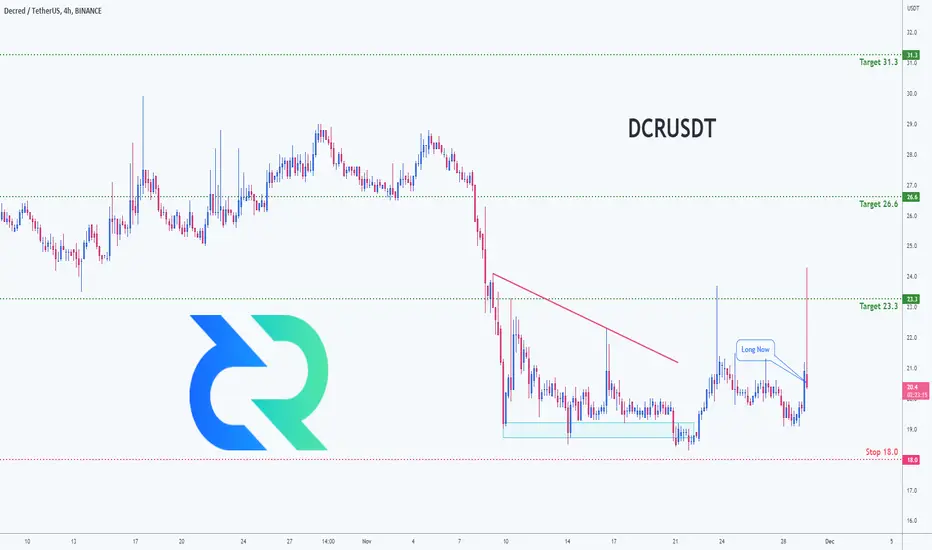
Trading opportunity for DCRUSDT DecredBased on technical factors there is a Buy position in :
📊 DCRUSDT Decred
🔵 Buy Now 20.6
🧯 Stop loss 18.0
🏹 Target 1 23.3
🏹 Target 2 26.6
🏹 Target 3 31.3
💸RISK : 1%
We hope it is profitable for you ❤️
Please support our activity with your likes👍 and comments📝
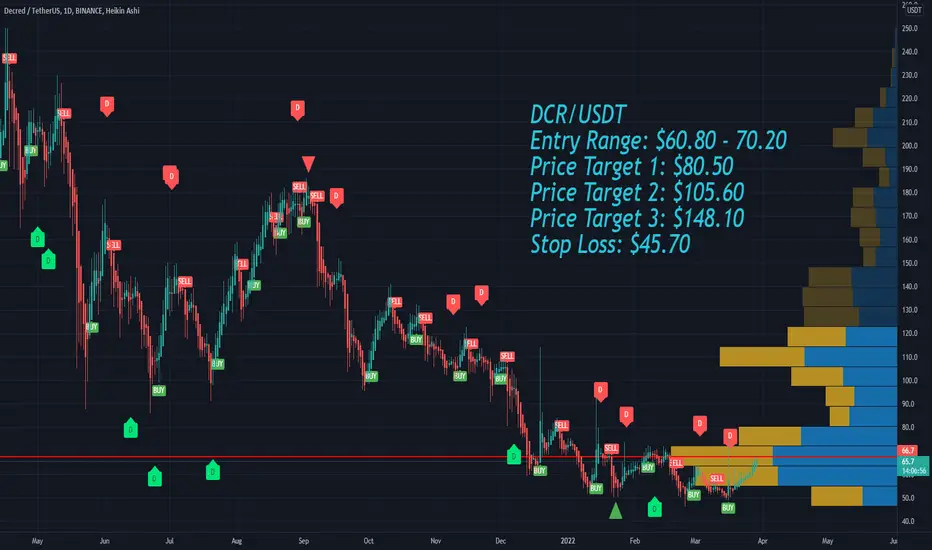
Decred DCR Price Targets and Stop Loss DCR/USDT
Entry Range: $60.80 - 70.20
Price Target 1: $80.50
Price Target 2: $105.60
Price Target 3: $148.10
Stop Loss: $45.70
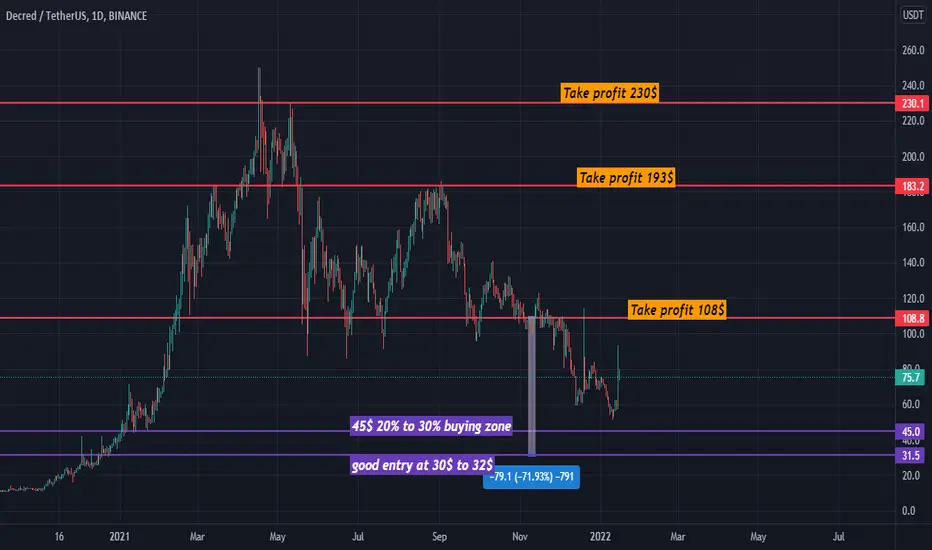
DCR PRICE PREDICTIONWe do not fall in love with any type of asset. We are here to make money. AND TAKE PROFIT WITH ABSOLUTELY NO EMOTIONS!
10% of the earnings will go to Charity found
DCR
support:
45$
32$
30$
Target:
108$
193$
230$