Turning leveraged ETF decay into preyWelcome to this guide on harnessing the natural decay in leveraged ETFs as a strategic edge, rather than fighting against it. We’ll assume you have a basic understanding of options and are comfortable using at-the-money (ATM) strikes as a conservative reference point—advanced users can tailor strike selection to their own edge.
Overview of Leveraged ETFs
What they are and how they reset
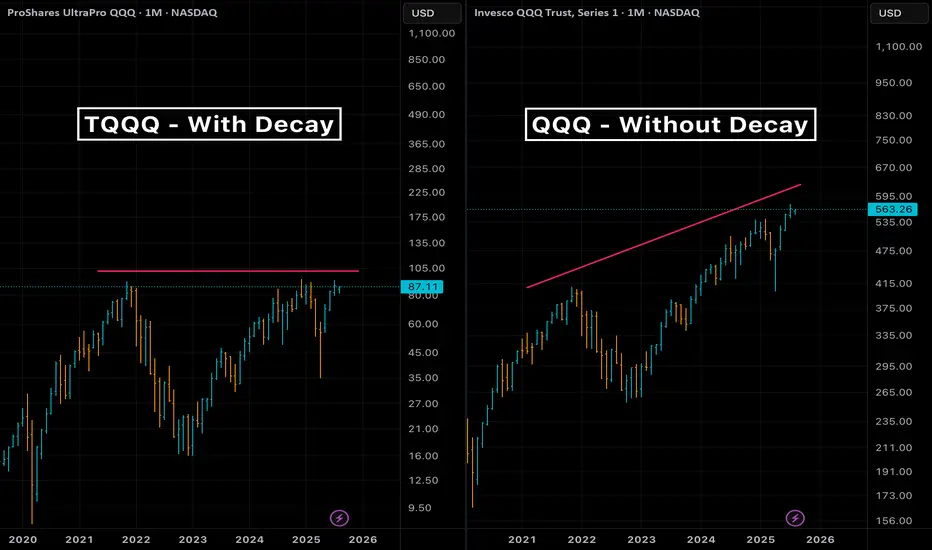
• Leveraged ETFs (e.g. NASDAQ:TQQQ , NASDAQ:SQQQ ) aim to deliver a constant multiple (×2 or ×3) of daily returns of an index.
• Inverse ETFs provide –2× or –3× daily exposure without using options.
• Daily reset and compounding create path dependency, leading to “decay” over multi-day holds.
The Decay Mechanism
A quick reminder
• Volatility drag (aka “gamma decay”) causes leveraged ETFs to underperform their stated multiple over longer horizons in sideways or choppy markets.
• The longer you hold beyond one day, the more cumulative leak you face.
Using Decay as a Tailwind
• Rather than avoiding decay, structure trades to benefit from it when your directional bias is robust.
• Combine traditional technical setups with the telescoping of leverage + decay to magnify returns on the correct market view.
• Small notional capital can control large effective exposure via a leveraged ETF + ATM option.
Strategy Execution
• To short the market : buy long puts on a bullish leveraged ETF (e.g. NASDAQ:TQQQ puts).
• To go long the market : buy long puts on an inverse leveraged ETF (e.g. NASDAQ:SQQQ puts).
• Use ATM options for defined risk and to capture both directional move and extra tailwind from ETF decay.
• Position size example: controlling $10k of market exposure might only require $200–$500 in option premium, depending on expiry.
Time Horizon for Decay Tailwind
• Empirically, decay compounds meaningfully over more than one trading day.
• Short-term horizons (2–5 trading days) often capture a useful drift without excessive market risk.
• Back-test your preferred ETF to find the sweet spot for your volatility regime.
High-Volume ETFs to Watch
Bear (inverse) ETFs:
• AMEX:BITI • AMEX:LABD • NASDAQ:SQQQ • AMEX:TZA • AMEX:SOXS • AMEX:SPXS
Bull (long) ETFs:
• AMEX:BITU • AMEX:LABU • NASDAQ:TQQQ • AMEX:TNA • AMEX:SOXL • AMEX:SPXL
Closing Thoughts & Disclaimers
This tutorial highlights how to position decay as a tailwind when your outlook aligns with market direction. Leveraged instruments and options carry amplified risks—only trade with capital you can afford to lose and always define your risk parameters before entry.
Decay
The Phenomenon of Alpha DecayIntroduction:
In the realm of cryptocurrency investing, patterns are often perceived, strategies are formed, and indicators are developed to capture potential opportunities. However, there's an underlying factor that traders and investors must be aware of: the concept of alpha decay. Here, we will delve into the nuances of alpha decay, especially in the context of MVRV Z-score, and how market participants have evolved their strategies over various bull cycles.
Alpha Decay in Cryptocurrency Investing:
At its core, alpha represents the excess return of an investment relative to the return of a benchmark index. As certain strategies become popular and more investors adapt them, the advantage (or alpha) of that strategy diminishes. This is referred to as alpha decay. This phenomenon is especially noticeable in markets as dynamic and rapidly evolving as cryptocurrency.
MVRV Z-Score and the Bull Cycles:
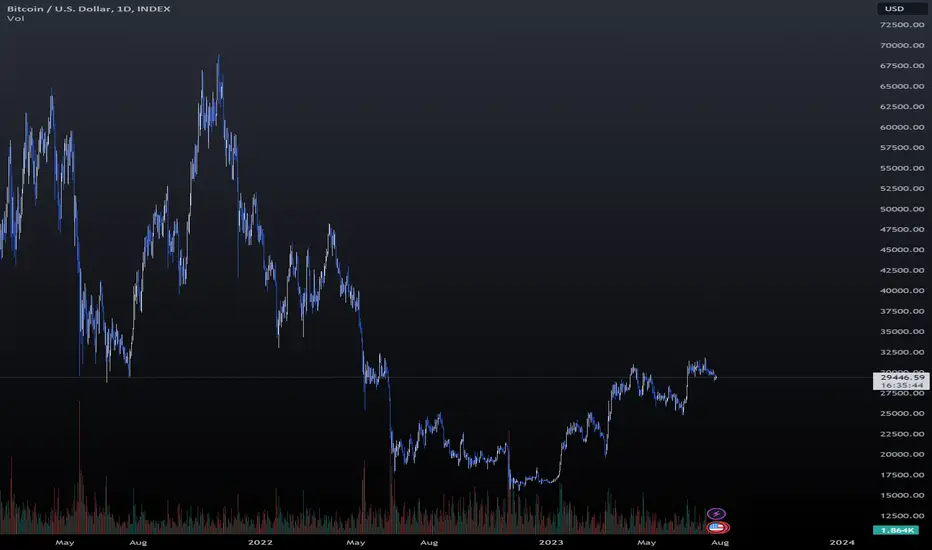
MVRV Z-score is a metric that gauges the difference between the market value and realized value of a particular cryptocurrency, typically Bitcoin. Historically, peaks in the MVRV Z-score have coincided with market tops, making it a valuable tool for investors.
2013-2014 Bull Cycle:
The 2013-2014 cycle witnessed a sharp peak in the MVRV Z-score, aligning closely with the market peak. This made it an excellent tool for identifying market tops.
2017-2018 Bull Cycle:
Interestingly, the 2017-2018 bull cycle saw the MVRV Z-score peak slightly earlier than the market peak. This discrepancy suggests that informed traders may have been "front-running" the indicator, leading to alpha decay. As more participants became aware of the indicator and its predictive capabilities, its effectiveness diminished.
2021 Bull Cycle:
The second peak of the 2021 bull cycle again showcased the phenomenon of front-running. The divergence between the MVRV Z-score peak and the market peak was even more pronounced, highlighting the diminishing alpha and adaptation of market participants.
Indicators and Alpha Decay:
While many indicators suffer from alpha decay as market participants adapt, some metrics are inherently protected. A prime example is the unrealized profit/loss metric. This indicator measures the profitability of users, giving insights into the potential behavior of a cohort of traders. As it is based on aggregate behavior rather than predictive patterns, it's less susceptible to front-running and retains its relevance over time.
Conclusion:
As the cryptocurrency market matures, tools and indicators will continuously evolve, and alpha decay will remain an inherent challenge. Investors must be aware of this phenomenon, continuously adapt, and diversify their toolkits. Relying solely on historically reliable indicators can be misleading, and thus, an understanding of the underlying dynamics and broader market behavior becomes paramount.
It's worth noting that as markets evolve and new data emerges, so too will the strategies and tools used to interpret them. Thus, always stay updated, be adaptable, and never rely solely on a single indicator for decision-making.
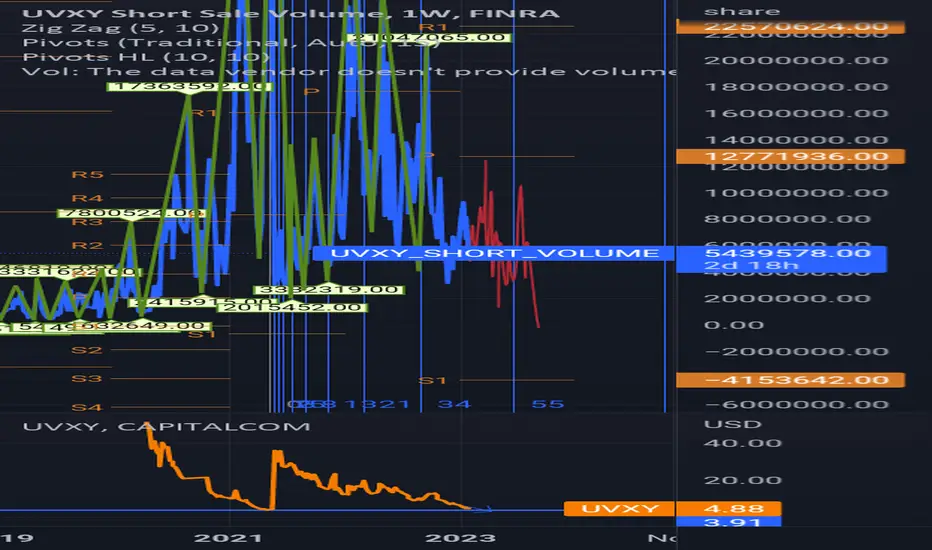
uvxy short volume uptickweve slightly gained in vix, and the ftz from top of short leads out to where uvxy should make its low sub $4...
if we examine the capitalcom vs finra we see that contango in vix is still coagulating around a major demand zone low into its decay. i still think split will be bullish for vix, but perhaps we clear the pop in fomc, and the loose steam is actually bullish in the long run i would still expect vix to lose weekly, as well as lose by the end of ftz.
Banknifty Expiry Range Possibility based on Three ScenarioThe kind of move we got today, reinforces the belief for a comfortable range bound expiry. I tried to be as moderate as possible to carve out the ranges. Lets watch tomorrow how we perform

Short VIX Play: UVXY PutsDecay strongly favors the contract holder. Notice even in the course of one day, with VIX hanging steady around 35-36, this thing lost $1 over 6 hours.
See most insightful post credit to Hungry_Hippo, attached!
Traded for $24 in the AM then price relaxed as VIX fell, on viral scare news at 14:38 VIX jumped back to 36 but UVXY reached... 23! This thing fades fast.
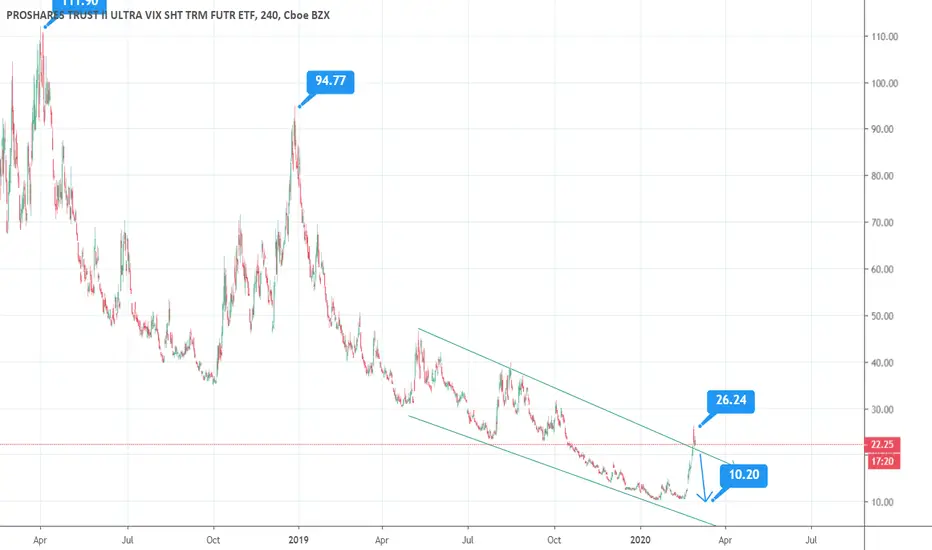
It contains no real property or equities; ONLY futures short-term contracts, which wind down real fast. Scroll back to see price change over past 8 years;
this is not a graph error, it really declined from over $15m to trade where it is today.
When market recovers, this ETF will go back in the crapper but it will be much less than when it started in Feb, will go under $13 and should crush down to $10 as the futures in the fund decay with time value. Only risk in it is another tank-off, we could certainly see a retest of the Friday 28 Feb low, but this will still decay!
Folks ask; "Why is it still over $20 then?!" Because of reverse splits! When it goes under $10 the exchange splits the shares 1:2 and the price doubles but holders gain half as many shares, eventually adjusted for these splits it will end up trading for a few pennies. DO NOT HOLD THIS ETF!!!
My strat: In the Mar $18 and Apr $17 puts, these are fairly cheap plays between $1.1 - 1.6 today. Back at $12 these will be deep ITM. A 0.786 Fib retracement of prices will drive this down to crush levels.
This isn't investing advice, just another crack pot scheme; trade at your own risk; GLTA!!!
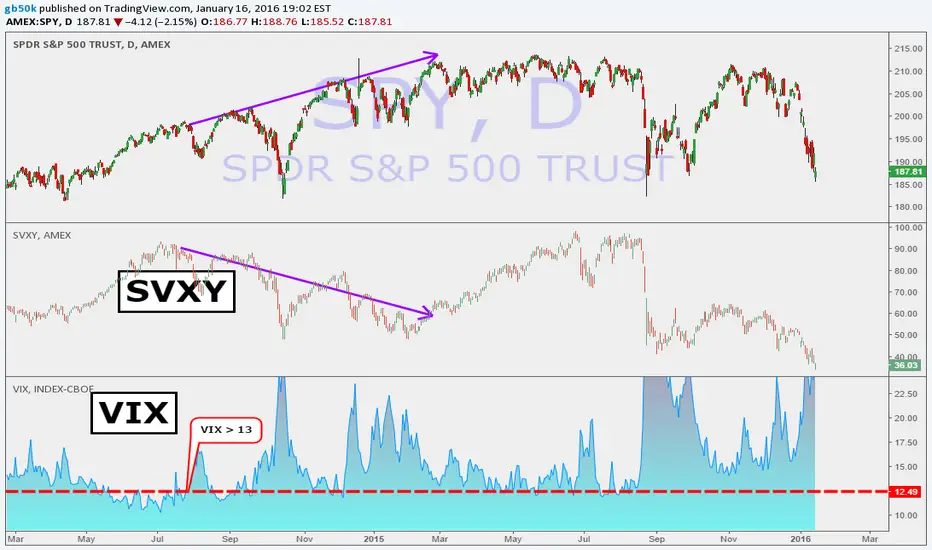
Short SVXY durring high VIX periodsSVXY pays a price when VIX is high (>16).... even when SPY is increasing (see arrows). This is due to rollover but not to be confused with VXX decay due to contango.