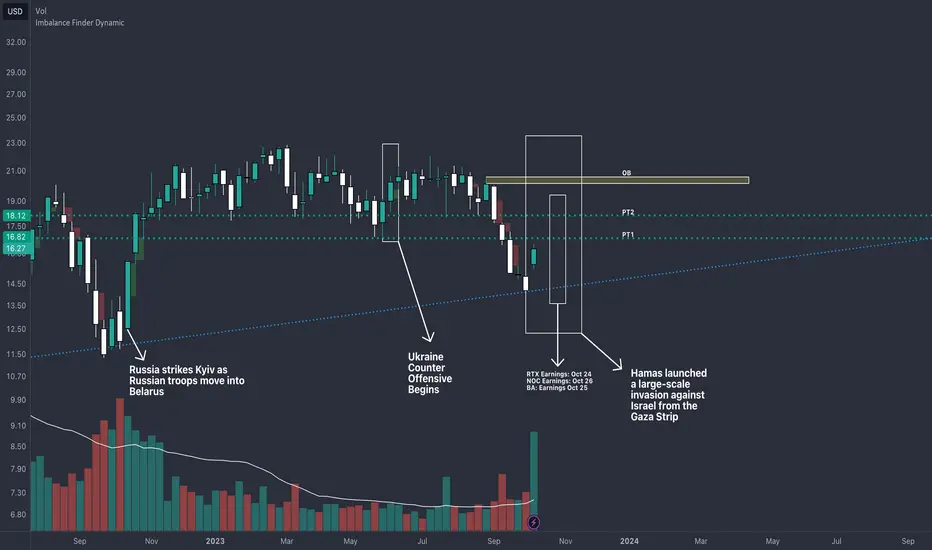
DFEN 11/17 17CAMEX:DFEN has shown a pattern of responding positively to conflict, this combined with an earnings event for NYSE:RTX , $NO and NYSE:BA could prove to bring significant upside. 3 Bearish imbalances that need to be filled, PT1 at $16.82, PT2 at $18.12, OB at $20.11. I am bullish on defense earnings due to the conflict in Ukraine.
thehill.com
Defense
DEFENSE WINS CHAMPIONSHIPS (Global Conflict Summary EDITION)Per the council of foreign relations, these are the following current global conflicts. I've included a brief description of each conflict. It's important to understand these if you're planning or already are investing in defense stocks.
Per TA, I've labeled bearish price targets, bullish price targets, relevant trends. It looks overvalued from analysis on ITA, but there is upside. I'd say that short term probably favors bulls (talking maybe weeks if not less), mid term probably favors the bears (multiple months), long term will likely favor bulls, but it will depend on the movement we see over FEB and March.
Global Conflict Summary
Americas
Criminal Violence in Mexico
The criminal violence in Mexico involves various organizations such as Sinaloa, Los Zetas, Tijuana/AFO, Juárez/CFO, Beltrán Leyva, Gulf, La Familia Michoacana, the Knights Templar, and Cartel Jalisco Nuevo Generación (CJNG). The violence is attributed to the increase in crime rates and the limited interventions by the state and municipal police.
Instability in Haiti
The instability in Haiti involves the government, opposition parties, and the international community. The crisis revolves around the dispute over the presidential term and the government’s inability to control skyrocketing prices of commodities.
Instability in Venezuela
Venezuela is facing an unprecedented social and humanitarian collapse due to poor economic policies, political conflict, and the international community’s unsuccessful attempts to bring about positive change. The conflict involves the government under President Nicolás Maduro and opposition groups.
Asia
Instability in Afghanistan
Since the Taliban reclaimed control of Afghanistan in 2021, the country has further plunged into political and economic instability. The conflict involves the Afghan government, the Taliban, and various local and international actors.
Territorial Disputes in the South China Sea
China’s sweeping claims of sovereignty over the sea have antagonized competing countries. The key parties involved in this territorial dispute are China, the Philippines, and the US.
North Korea Crisis
North Korea could resort to nuclear weapons in a crisis as it is making significant progress toward implementing a more robust nuclear strategy. The crisis involves North Korea, South Korea, the United States, Japan, and other international actors.
Instability in Pakistan
Pakistan continues to face multiple sources of internal and external conflict. Extremism and intolerance of diversity and dissent have grown, threatening the country’s prospects for social cohesion and stability. The conflict involves the Pakistani government, opposition groups like the Pakistan Muslim League and the Pakistan Peoples Party, and militant groups like the Tehrik-e-Taliban Pakistan (TTP).
Conflict Between India and Pakistan
Since 1947, India and Pakistan have been involved in a number of wars, conflicts, and military standoffs, with the Kashmir conflict serving as the catalyst for every war between the two states. The conflict primarily involves India and Pakistan, with the disputed region of Kashmir being a major point of contention.
Confrontation Over Taiwan
Tensions are rising over Taiwan as China’s power and assertiveness grows, competition between the U.S. and China spreads, and the Taiwanese people develop a distinct identity increasingly disassociated from the mainland. The key parties involved in this conflict are China, Taiwan, and the US.
Civil War in Myanmar
The civil war in Myanmar escalated significantly in response to the 2021 military coup d’état and the subsequent violent crackdown on anti-coup protests. The conflict involves the National Unity Government, People’s Defence Force, Chinland Defence Force, Chin National Defence Force, Karenni Nationalities Defence Force, and other ethnic armed organizations against the State Administration Council and Tatmadaw.
Europe and Eurasia
War in Ukraine
The war in Ukraine involves Ukraine and Russia. The conflict is over the sovereignty of Crimea and parts of eastern Ukraine, which Russia annexed in 2014.
Nagorno-Karabakh Conflict
The Nagorno-Karabakh conflict involves Armenia and Azerbaijan. The dispute is over the Nagorno-Karabakh region, which is internationally recognized as part of Azerbaijan but is governed by ethnic Armenians.
Middle East and North Africa
Conflict in Syria
The conflict in Syria involves the Syrian government, opposition groups, and various international actors. The civil war began in 2011 as part of the Arab Spring protests and has since escalated into a multi-sided conflict involving numerous factions and foreign powers.
Instability in Iraq
The instability in Iraq involves the Iraqi government, various ethnic and religious groups, and international actors. The conflict stems from sectarian tensions, political instability, and the presence of ISIS.
Israeli-Palestinian Conflict
The Israeli-Palestinian conflict involves Israel, Palestine, and various international actors. The conflict is over the sovereignty of the Palestinian territories and the establishment of a Palestinian state alongside Israel.
Sub-Saharan Africa
Conflict in the Central African Republic
The conflict in the Central African Republic involves the government, various rebel groups, and international actors. The conflict stems from political instability, ethnic tensions, and control over the country’s rich natural resources.
Conflict in Ethiopia
The conflict in Ethiopia involves the Ethiopian government, the Tigray People’s Liberation Front, and various ethnic and regional groups. The conflict stems from political tensions, ethnic disputes, and disagreements over the country’s system of ethnic federalism.
Please note that this is a brief summary and does not cover all aspects of the conflicts. For more detailed information, please conduct further research.

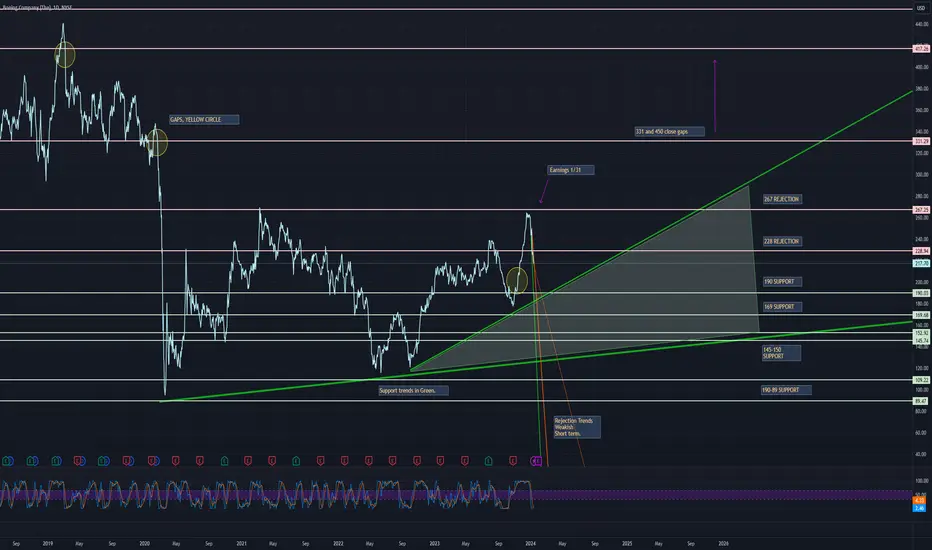
BOEING, CAN A 747 REACH THE MOON?meh, idk. probably not.
Something is weird with defense stocks.
I like the potential of the upside to see those gaps close.
There is support on the bottom side.
Gaps are closed on the bottom side.
Indicators are turning to favor bulls.
However, there may be some quick downside on these steep short term trends in red.
Green Triangle is likely a long term buy zone, with potential to hit as low as 145. However, I have no idea if that is before or after 300+
After that, if we break that support trend (thickest green), watch out for the movement to 92.
A movement like that would be similar to a covid drop and return.
Earnings is likely to flip price action.
Drop into earnings, and price targets hitting as support is a buy.
Pump into earnings without breaking out over rejection trends, and rejection targets is a sell.
Any feedback on the charts as far as simplicity to understand?
Do you prefer candles or the line? I use candles to TA, but I've found better feedback with the line chart, which I'm happy to keep doing.
Website update,
idk which direction I want to head with it.
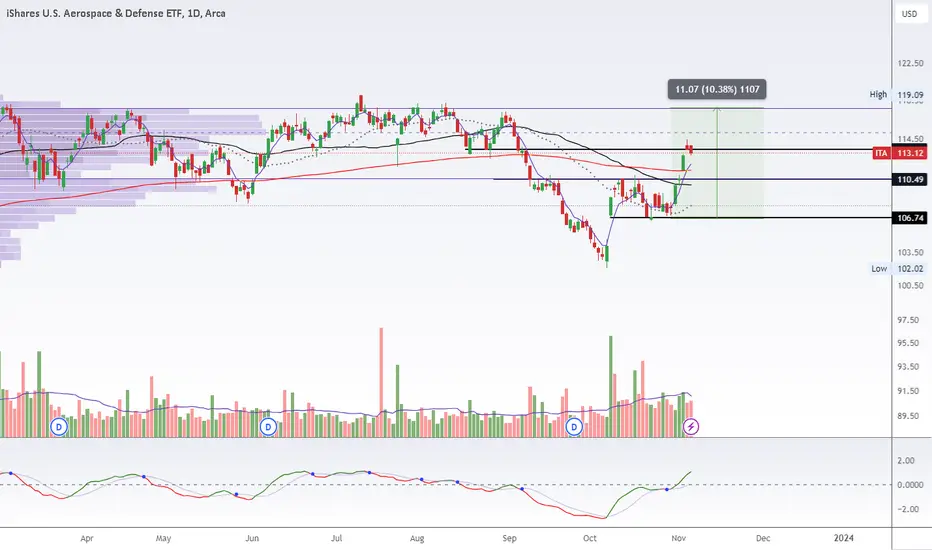
ITA - Defense ET
Broke out of falling wedge around 109 and is moving well in the supply zone.
With two wars, geopolitical risks are high and this could play out as a good hedge.
First target would be around 117. New pivot there might set this up for higher price.
I am long from 109.50
LMT: Bearish 5-0 with Hidden Bearish DivergenceLMT, after Double Topping at the PCZ of a Bearish Deep Crab, has decided to attempt to finish off this bearish range with a Bearish 5-0, if successful, we could see LMT push significantly below $400.
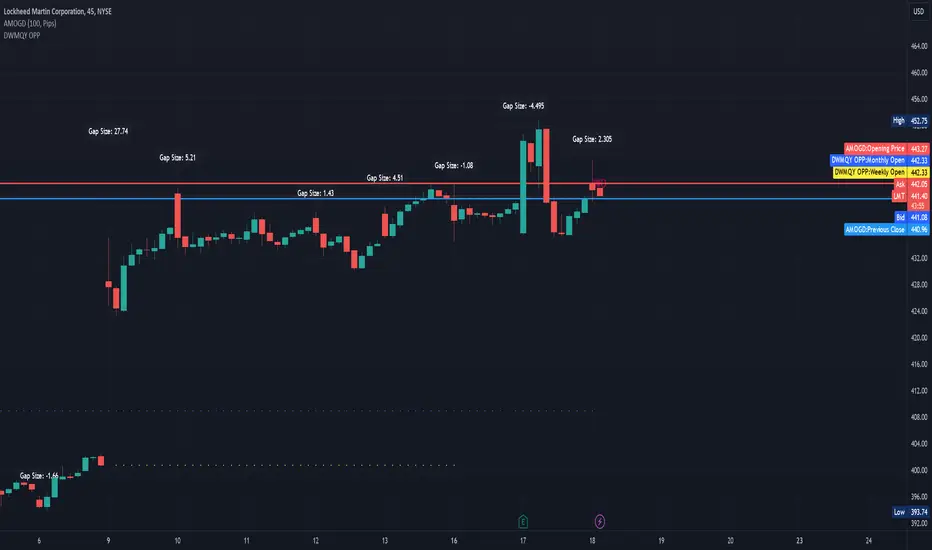
Lockheed Martin Corporation (LMT) October 2023 to April 2024
Neutral to Long: The company's fundamentals and dividend history are strong, suggesting a potential long position. However, the recent underperformance (negative YTD return) and the volatility might be a concern, which introduces some caution, hence the neutral stance.
Fundamentals:
Market Cap: $110.91 billion
Operating Margin (TTM): 13.43%
EPS (Earnings Per Share): $27.3
PE Ratio: 16.13
Revenue (TTM): $67.39 billion
Quarterly Revenue Growth YoY: 8.1%
Profit Margin: 10.48%
Return on Equity (TTM): 68.31%
Recent Earnings:
Q3 2023: Estimated EPS was $6.67 (actual EPS not yet reported).
Q2 2023: Estimated EPS was $6.45, and the actual EPS was $6.63, resulting in a positive surprise of 2.79%.
Q1 2023: Estimated EPS was $6.06, and the actual EPS was $6.61, resulting in a positive surprise of 9.08%.
Q4 2022: Estimated EPS was $7.39, and the actual EPS was $7.4, resulting in a slight positive surprise of 0.14%.
Technical Indicators:
5-Year Return: 9.02%
10-Year Return: 16.31%
1-Year Return: 13.94%
YTD Return: -7.52%
Dividend Yield: 2.72%
Volatility (1Y): 21.49%
Sharpe Ratio: 0.7561
Dividends & Splits:
Last Dividend Date: December 29, 2023
Forward Annual Dividend Yield: 2.86%
Forward Annual Dividend Rate: $12.6
Last Split: 2:1 on January 4, 1999
Analysis:
Lockheed Martin has shown consistent growth in its revenue, with a YoY quarterly revenue growth of 8.1%. The company's earnings have been positive, with recent quarters showing a positive surprise in EPS compared to estimates. The company's fundamentals, such as the operating margin and profit margin, are robust. The PE ratio is at a moderate level, indicating that the stock might be reasonably priced. The company has a strong dividend history, which is a positive sign for income-focused investors.
However, the YTD return is negative, indicating some recent underperformance. The volatility is also relatively high, which might be a concern for risk-averse investors.
In conclusion, Lockheed Martin appears to be a fundamentally strong company with consistent growth and a good dividend history. However, potential investors should be cautious about the recent underperformance and consider the company's volatility before making an investment decision.
Please note that this analysis is based on historical data and does not guarantee future performance. Always conduct your own research and consult with a financial advisor before making investment decisions.
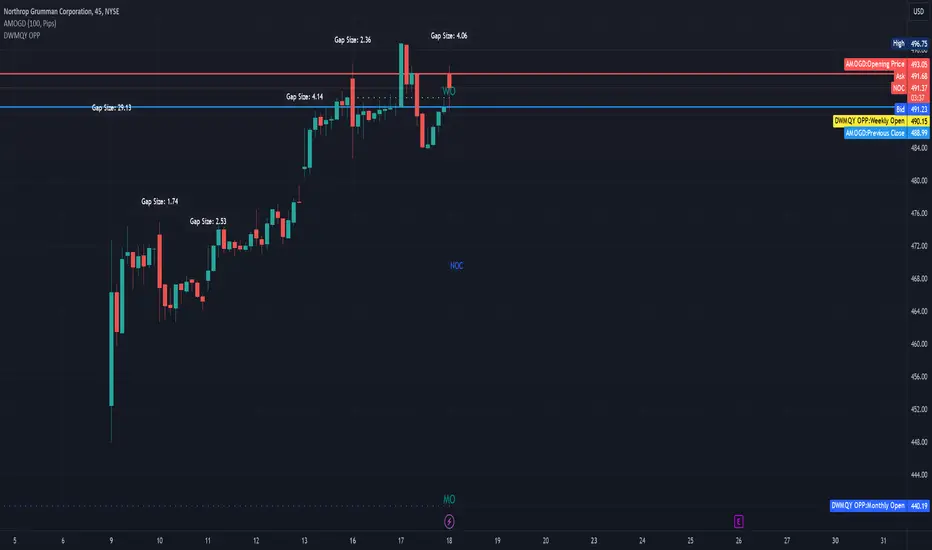
Northrop Grumman Corporation (NOC) October 2023 to April 2024
Northrop Grumman Corporation (NOC)
Fundamentals:
Market Cap: $73.996 billion
EPS (Earnings Per Share): $30.13
P/E Ratio: 16.232
Book Value: $102.293
Operating Margin (TTM): 11.49%
Profit Margin: 12.27%
Return on Assets (TTM): 8.45%
Return on Equity (TTM): 31.91%
Wall Street Target Price: $504.33
Revenue (TTM): $37.881 billion
Gross Profit (TTM): $7.474 billion
Recent Earnings:
Q2 2023: Actual EPS of $5.34 vs. Estimated EPS of $5.33 (Surprise: +0.1876%)
Q1 2023: Actual EPS of $5.5 vs. Estimated EPS of $5.09 (Surprise: +8.055%)
Q4 2022: Actual EPS of $7.5 vs. Estimated EPS of $6.57 (Surprise: +14.1553%)
Technical Indicators:
52 Week High: $547.6509
52 Week Low: $414.56
50-Day Moving Average: $436.8846
200-Day Moving Average: $453.325
Beta: 0.437 (indicating the stock is less volatile than the market)
Dividends:
Forward Annual Dividend Rate: $7.48
Forward Annual Dividend Yield: 1.53%
Payout Ratio: 29.72%
Performance Metrics:
YTD Return: -9.27%
1-Year Return: 4.55%
3-Year Return: 17.6%
5-Year Return: 11.52%
10-Year Return: 19.05%
Analysis:
Northrop Grumman has demonstrated a solid financial performance with a healthy profit margin and return on equity. The company's earnings have been consistently beating estimates, indicating strong operational efficiency. The stock's P/E ratio is relatively moderate, suggesting it might be fairly valued. The company also offers a decent dividend yield, making it attractive for income-seeking investors. However, the stock has underperformed YTD, which might be a concern for short-term investors. Given its industry positioning and financial metrics, it seems to be a stable investment for those looking at the defense sector.
BA Boeing Flying Above Ichimoku Clouds. Hara-Kiri for the bears I've been invested in this from $130 it is 10% of my total investing and trading capital. The bad news is over for Boeing the stock is still trading cheap compared to the growth this company will have as the US - China Arms and Space Race heats up. Plus the future growth of the aerospace and defense industries in general. Target is for BA to test it's all time high of around $400 .

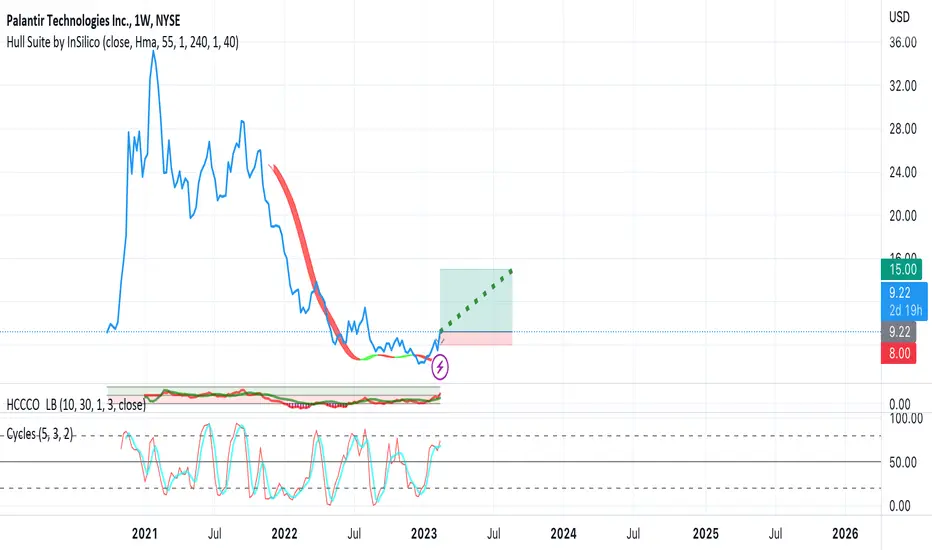
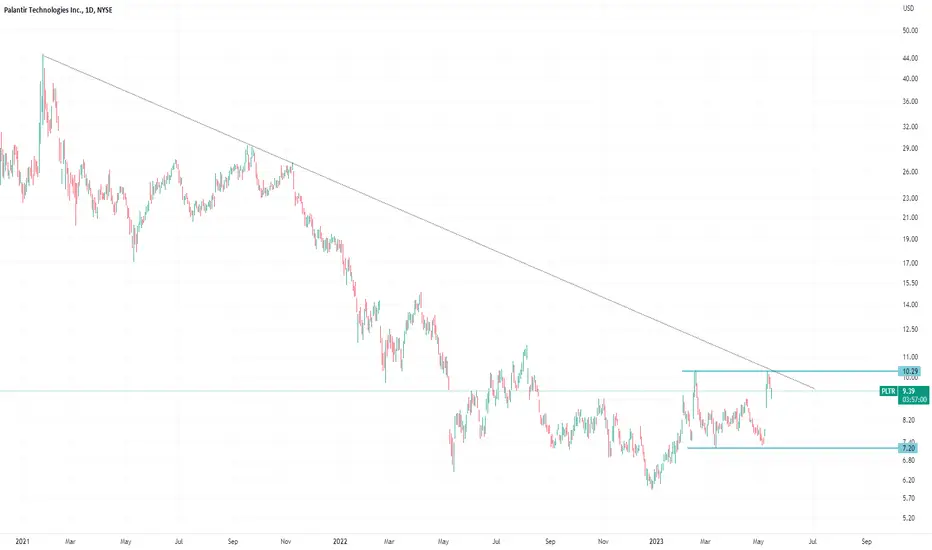
PLTR return to trading in the double digits in 2023Long PLTR. Company just reported first quarterly profit and is growing well. The global tensions and the trend of deglobalization and a bipolar world should only help this company's business going forward.
NOC WCA - Head and Shoulders PatternCompany: Northrop Grumman
Ticker: NOC
Exchange: NYSE
Sector: Defense
Introduction:
Hello, and thank you for reading this analysis. Today, we focus on Northrop Grumman (NOC) on the NYSE. The weekly chart shows a potentially significant head and shoulders pattern that deserves our attention.
Head and Shoulders Pattern:
The head and shoulders pattern is a classic chart formation that can indicate either a bullish continuation or bearish reversal, depending on its orientation and the preceding trend. In this case, the pattern has formed over 441 days, making it noteworthy.
Analysis:
The NOC chart shows a clear uptrend, as demonstrated by the green upward sloping line and the position of the price above the 200 EMA. Both of these factors contribute to a bullish sentiment.
However, the formation of the head and shoulders pattern introduces an element of uncertainty. The neckline of this pattern, which currently acts as support, is at 431.61. A break below this level could signal a bearish reversal, offering a potential shorting opportunity.
On the other hand, a break above the right shoulder could indicate a continuation of the bullish trend. Given the existing uptrend and the position above the 200 EMA, the probabilities currently favor a continuation.
Conclusion:
In summary, Northrop Grumman's weekly chart presents a head and shoulders pattern within an uptrend, offering potential trading opportunities in both directions. Therefore, this is a chart to watch closely in the coming days.
As always, it's important to manage your risk appropriately and ensure that any trading decisions align with your overall investment strategy.
Please note that this analysis does not constitute financial advice. Always conduct your own research before making investment decisions.
If you found this analysis helpful, please like, share, and follow for more updates. Happy trading!
Best regards,
Karim Subhieh

PLTR set your alerts and wait!such a neat 2 bottoms, long term downtrend resistance is almost falls in to the same are of the neckline. set the alerts and wait!
$PLTR is looking good! Fundamentally & technically w/tailwindsTaking a look at PLTR in this video! Been a long time since I made a video.
Let me know if you have any suggestions!

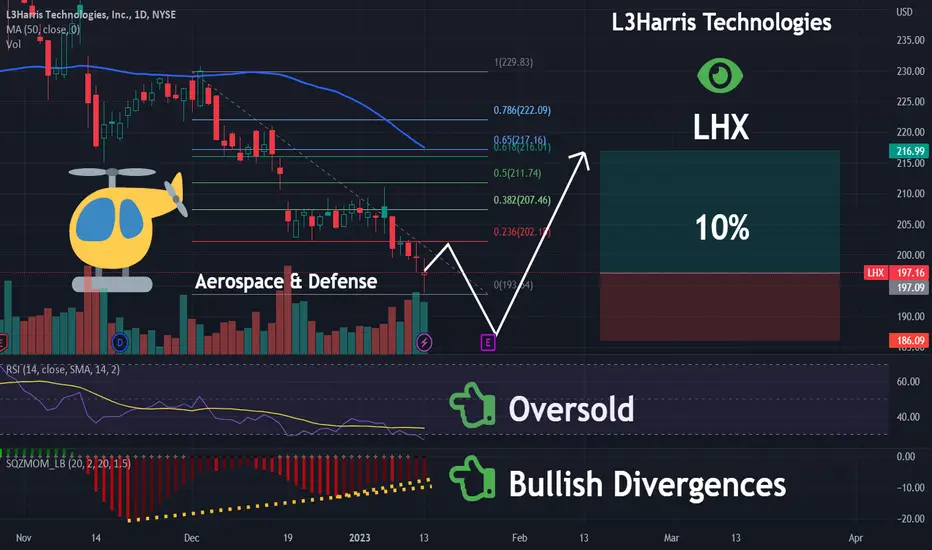
LHX | Oversold Defense Play | BounceL3Harris Technologies, Inc., an aerospace and defense technology company, provides mission-critical solutions for government and commercial customers worldwide. The company's Integrated Mission Systems segment provides multi-mission intelligence, surveillance, and reconnaissance (ISR) systems; and communication systems, as well as fleet management support, sensor development, modification, and periodic depot maintenance services for ISR and airborne missions. It also manufactures and integrates mission systems for maritime platforms, such as signals intelligence and multi-intelligence platforms; unmanned surface and undersea autonomous solutions; and power and ship control systems and other electronic and electrical products and systems. In addition, this segment offers advanced electro-optical and infrared solutions. Its Space and Airborne Systems segment offers space payloads, sensors, and full-mission solutions; classified intelligence and cyber defense solutions; mission avionics; and electronic warfare systems. The company's Communication Systems segment provides tactical communications; broadband secured mobile networked communication equipment, including airborne, space, and surface data link terminals, ground stations, and transportable tactical satellite communication (SATCOM) systems for use in manned aircraft, unmanned aerial vehicles, and naval ships; and helmet and weapon mounted integrated night vision systems. This segment also offers radios, systems applications, and equipment for critical public safety and professional communications; and SATCOM terminals and battlefield management networks. Its Aviation Systems segment offers defense aviation products; commercial pilot training; and mission networks solutions for air traffic management. The company was formerly known as Harris Corporation and changed its name to L3Harris Technologies, Inc. in June 2019. L3Harris Technologies, Inc. was founded in 1895 and is headquartered in Melbourne, Florida.
Bearish AB=CD on the SPDR Select Industrial Sector ETFThere is a Logscale AB=CD on the Industrials with Bearish RSI Divergence and the 1.414 PCZ of the Logscale AB=CD aligns with the 1.618 on the Linear Scale. I think it would be fitting to see this go down as i have recently become Bearish on Defesne Stocks such as RTX and HON, and have also become bearish on Airline Stocks such as BA and those stocks all happen to be in the top 10 holdings of this ETF so if they go down this ETF will go down. The standard Target for an ABCD like this is back to the C level which is around $47 in this case but for the time being i will target $80 via buying of the $90 Puts that are several weeks out.

Overhyped Defense Stock Trading at over 670x EPSWe have another Overhyped Defense Stock trading well above EPS ; This time trading well over 600 times earnings while the price is breaking below trend. It could be argued that we have an Inverted Cup with Handle at the Highs and if 46 Breaks we could quickly come down to $18 a Share but due to how high the PE is i wouldn't even be against targeting the 1.618 Extension all the way down at 72 Cents.

Raytheon Technologies: 3 Line Strike at PCZ of Bearish CypherThe Defense Sector in general seems to be overhyped as if it expects earnings not to matter anymore but the PE/Ratios keep rising as if it's betting on the US to enter a direct armed conflict rather than reality which is that we are simply just providing old unused equipment to the Ukraine. I think in the near future the market will realize this and we will see prices on these kinds of stocks got lower as the PE Ratios compress just like every other speculative growth stock has done during the cycle.

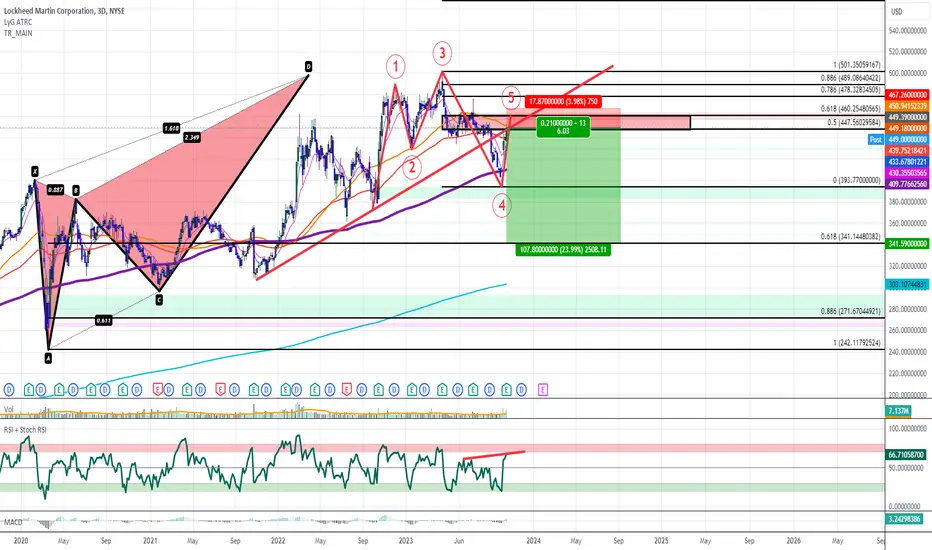
Lockheed Martin Bull PennantThis is a monthly chart of the defense company Lockheed Martin (LMT).
As you can see, a bull pennant is appearing.
In my experience, I have found that the most valid bull flags or pennants usually retrace back to the Golden Ratio (0.618), then bounce and continue higher (see below chart).
When this occurs, the measured move up is typically one full Fibonacci spiral from this retracement level, which usually occurs over a period of time that is about the same as the period of time it took the bull flag or pennant to form (see below chart)
The above chart suggests that LMT could climb into the 500s or as high as about 600 by the second quarter of next year. The best time to enter a trade would probably be after the seasonal volatility ends, and after a breakout occurs on some lower timeframe.
From a regression standpoint, this bull pennant formed when price rose from the mean to the 1 standard deviation, and retraced to the 0.5 standard deviation. If it pans out, the measured move may reach one full standard deviation higher (to the 1.5 standard deviations). See below chart.
To learn more about the log-linear regression channel that I used here, you can check out my prior post that described it in more detail:
Obviously, anything can happen. Not trading advice. Please do your own research and trade at your own risk. If you disagree, I welcome respectful comments and charts below.
Disclosure: I have no trade position in LMT and do not plan to open any trade at the current time.

LMT Lockheed Martin Options Ahead Of EarningsLooking at the LMT Lockheed Martin options chain, i would buy the $405 strike price Calls with
2022-11-18 expiration date for about
$9.50 premium.
Looking forward to read your opinion about it.

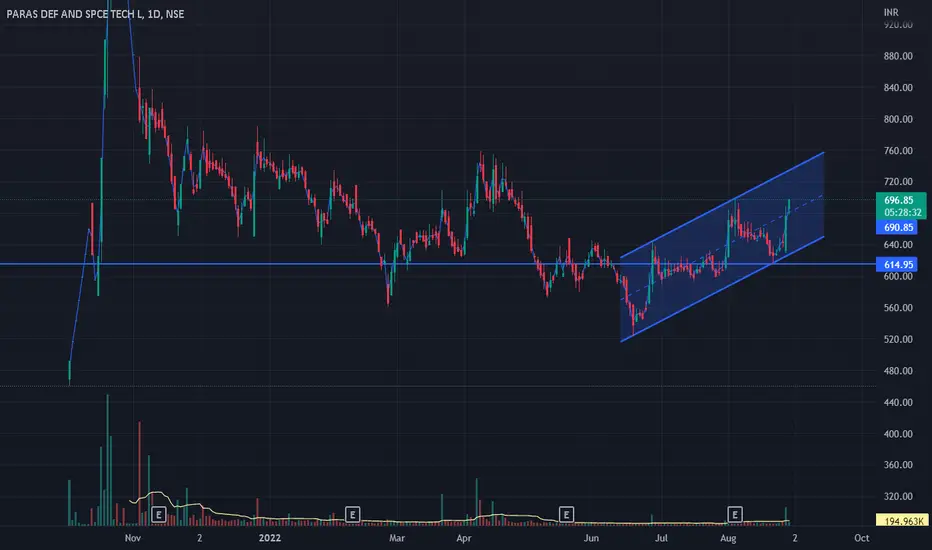
PARAS defence - trading opportunity in Rising channel patternWait for price to come at any side of channel boundary then take position (shirt/long),
Take position only after confirmation, price may breakout of channel, in this case also we can take long position if upside breaks out.

not full blown recession... yetWatching the 3 mo and 2 year very closely. I think this is an indicator for a recession and not the 2 and 10's because it shows more that the short term risk is outweighing anything mid term.
Everything is is wishy washy with definitions now a days lol but this is going to be the icing on the cake for confirmations.
Looking at the dollar strength we had a little pullback buts its ready to resume higher putting more weakness on emerging markets and currencies and also US equities.
Looking at UVXY and the VIX i think that the 20 range for the vix is a newer normal in this market environment though UVXY is going really low now and almost oversold on the daily compared to where we are at in this little "recovery" thats been taking place.
a lot to digest in the macro perspective and we'll see what the terminal rate will end up being for the FED. exciting times.
That's all folks.

Hypersonic Rocket to the moon: NOCNOC has been consolidating below the 490$ resistance since march.
Technical Indicators are nowhere near overbought, while price action contracted.
Once it expands, there could be a massive pop upwards, since fundamentally there are just too many good things to ignore.
Stock looks like a prototypical William O‘Neill break out candidate.
I‘m long.
No financial advice.

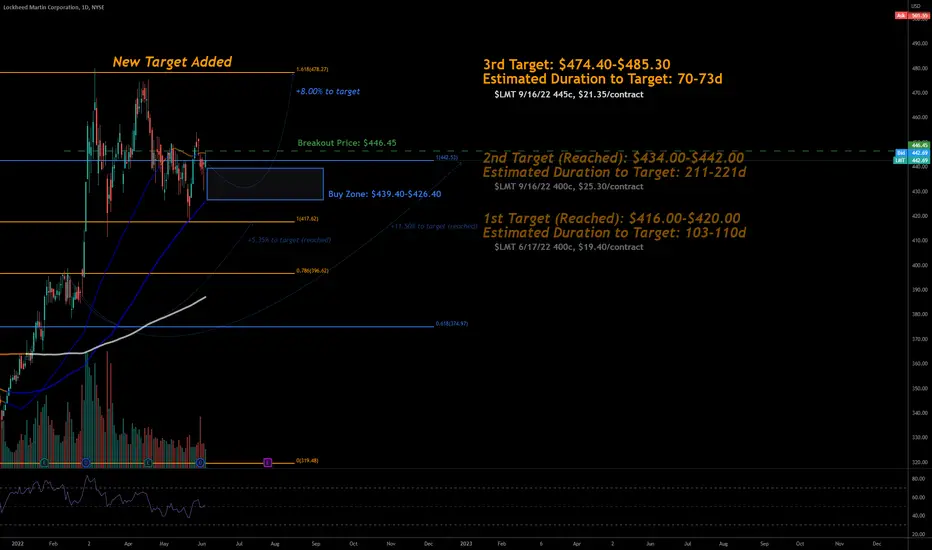
6/5/22 LMTLockheed Martin Corporation ( NYSE:LMT )
Sector: Electronic Technology (Aerospace & Defense)
Market Capitalization: 117.803B
Current Price: $442.69
Breakout price: $446.45
Buy Zone (Top/Bottom Range): $439.40-$426.40
Price Target: $474.40-$485.30 (3rd)
Estimated Duration to Target: 70-73d (3rd)
Contract of Interest: $LMT 9/16/22 445c
Trade price as of publish date: $21.35/contract