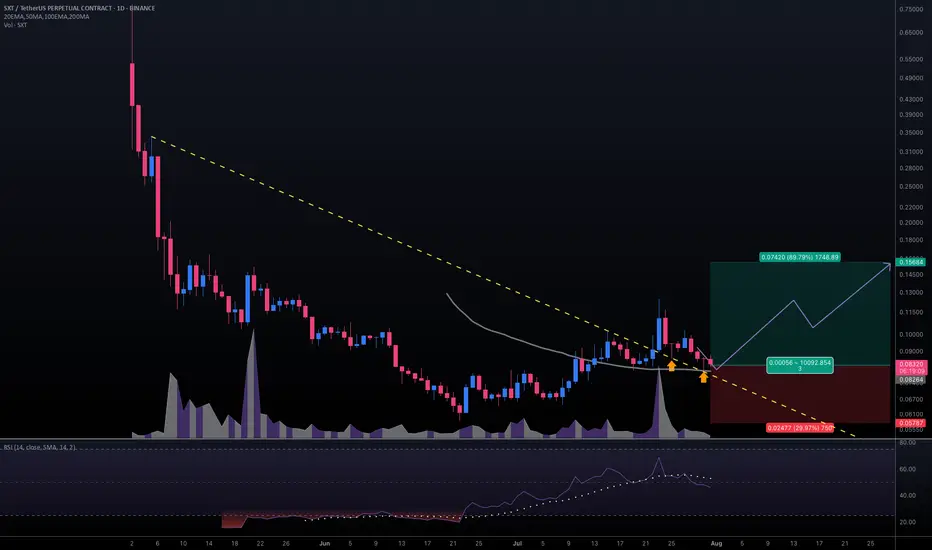
#SXTUSDT #1D (Binance Futures) Descending trendline break retestSpace and Time (SXT) pulled back to 50MA daily support, looks ready for mid-term recovery after those two dragonfly dojis in a row.
⚡️⚡️ #SXT/USDT ⚡️⚡️
Exchanges: Binance Futures
Signal Type: Regular (Long)
Leverage: Isolated (2.0X)
Amount: 5.0%
Entry Targets:
1) 0.08264
Take-Profit Targets:
1) 0.15684
Stop Targets:
1) 0.05787
Published By: @Zblaba
NYSE:SXT BINANCE:SXTUSDT.P #1D #SpaceAndTime #ZK #AI #DPoS spaceandtime.io
Risk/Reward= 1:3.0
Expected Profit= +179.6%
Possible Loss= -59.9%
Estimated Gaintime= 1 month
DEFI
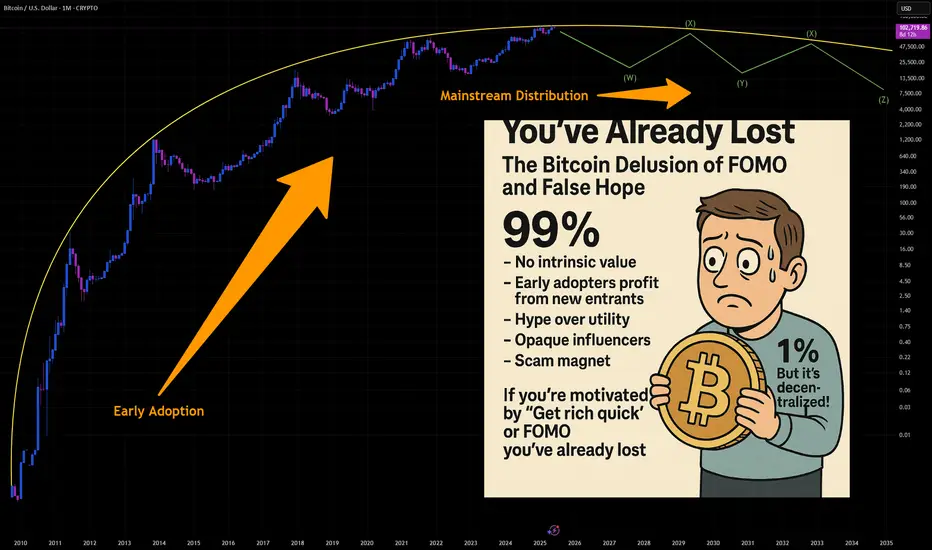
You've Already Lost: The Bitcoin Delusion of FOMO and False HopeLet’s get one thing straight: if you’re staring at Bitcoin, squinting past the red flags, and convincing yourself it’s not a Ponzi scheme because of that one shiny feature that screams “legit,” you’re not investing—you’re auditioning for the role of “next victim.” And if your motivation is the fear of missing out (FOMO) or the fantasy of getting rich quick, well... congratulations. You’ve already lost.
The 99%: Red Flags Waving Like It’s a Parade
Let’s talk about the indicators—the ones that make Bitcoin look suspiciously like a Ponzi scheme. No, it’s not technically one, but the resemblance is uncanny:
- No intrinsic value: Bitcoin isn’t backed by assets, cash flow, or a government. It’s worth what the next person is willing to pay. That’s not investing. That’s speculative hot potato.
- Early adopters profit from new entrants: The people who got in early? They’re cashing out while newcomers buy in at inflated prices. That’s the classic Ponzi dynamic: old money out, new money in.
- Hype over utility: Bitcoin’s actual use as a currency is minimal. It’s slow, expensive to transact, and volatile. But hey, who needs functionality when you’ve got memes and moon emojis?
- Opaque influencers: From anonymous creators (hello, Satoshi) to crypto bros promising Lambos, the ecosystem thrives on charisma, not accountability.
- Scam magnet: Bitcoin has been the currency of choice for over 1,700 Ponzi schemes and scams, according to a University of New Mexico study cs.unm.edu . That’s not a coincidence. That’s a pattern.
The 1%: The “But It’s Decentralized!” Defense
Ah yes, the one redeeming quality that Bitcoin evangelists cling to like a life raft: decentralization. No central authority! No government control! It’s the financial revolution!
Except… decentralization doesn’t magically make something a good investment. It just means no one’s in charge when things go wrong. And when the market crashes (again), you can’t call customer service. You can tweet into the void, though.
FOMO: The Real Engine Behind the Madness
Let’s be honest. Most people aren’t buying Bitcoin because they believe in the tech. They’re buying because they saw someone on TikTok turn $500 into a Tesla. FOMO is the fuel, and social media is the match.
Bitcoin’s meteoric rises are often driven by hype cycles, not fundamentals. Tesla buys in? Price spikes. El Salvador adopts it? Price spikes. Your cousin’s dog walker says it’s going to $1 million? Price spikes. Then it crashes. Rinse, repeat.
This isn’t investing. It’s gambling with a tech-savvy twist.
The Punchline: You’ve Already Lost
If you’re ignoring the overwhelming signs of speculative mania and clinging to the one feature that makes you feel better about your decision, you’re not ahead of the curve—you’re the mark. And if your motivation is “I don’t want to miss out,” you already have. You’ve missed out on rational thinking, due diligence, and the ability to distinguish between innovation and illusion.
Bitcoin might not be a Ponzi scheme in the legal sense. But if it walks like one, talks like one, and makes early adopters rich at the expense of latecomers… maybe it’s time to stop pretending it’s something else.
INDEX:BTCUSD NYSE:CRCL NASDAQ:HOOD TVC:DXY NASDAQ:MSTR TVC:SILVER TVC:GOLD NASDAQ:TSLA NASDAQ:COIN NASDAQ:MARA
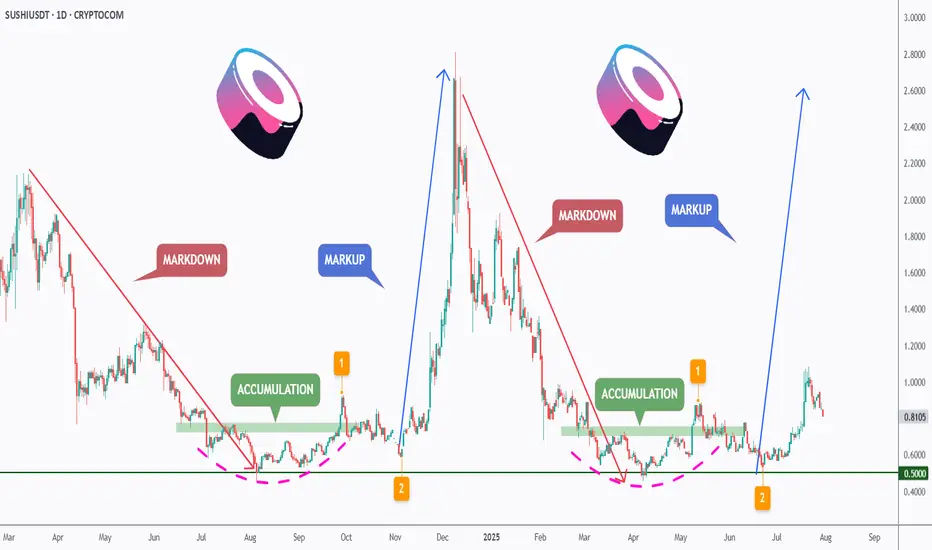
[Deep Dive] SUSHI – Edition 3: Accumulate. Anticipate. Accelerat🧠 Cycle Anatomy: What the Chart Is Telling Us
📉 Phase 1: Markdown
The bears dominated, slicing price downward into key historical support around the $0.50 mark — the same level that anchored the previous accumulation zone.
📦 Phase 2: Accumulation
Both accumulation phases (mid-2023 and Q2 2025) occurred near identical support zones, with rounded bases and sideways chop — signaling strong hands quietly absorbing supply.
📈 Phase 3: Markup Incoming?
Following breakout point “1” and retest point “2,” the current structure aligns remarkably well with the previous markup phase — which propelled SUSHI from ~$0.50 to over $3 in just weeks. While past performance isn’t a guarantee, this fractal deserves attention.
🔥 Why Fundamentals May Support This Move
- SushiSwap v3 continues rolling out on multiple chains, optimizing capital efficiency and fee structure for LPs.
- Governance has stabilized after the rough patches of 2022–2023, with more transparent treasury and development direction.
- Cross-chain expansion and integrations with major aggregators (like 1inch, Matcha, and DeBank) are boosting SUSHI’s visibility in the broader DeFi flow.
Additionally, a surge in TVL and DEX activity on low-fee chains could redirect volume back to SushiSwap — a platform known for its cross-chain capabilities.
📍 What to Watch Next
- A confirmed breakout above $1.00 would validate the “markup” thesis.
- A dip toward the $0.65–$0.70 zone could offer a high-risk/reward entry aligned with point “2.”
- Failure to hold the $0.50 level would invalidate the structure.
For now, the rhythm is clear: markdown → accumulation → markup. And if the pattern holds, SUSHI might just be preparing for its third vertical.
💬 Do you think this is just another fakeout — or is SUSHI gearing up for a DeFi comeback?
🔔 Disclaimer: This post is for educational and informational purposes only. It does not constitute financial advice. Always do your own research and manage risk carefully.
📚 Always follow your trading plan => including entry, risk management, and trade execution.
Good luck!
All strategies are good, if managed properly.
~ Richard Nasr
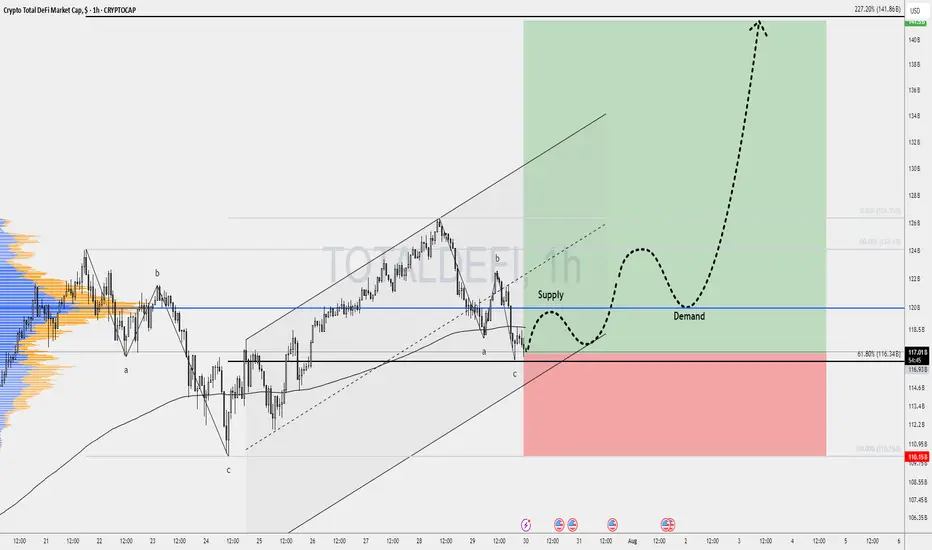
DeFi’s Make-or-Break MomentThe spotlight today is on TOTALDEFI, an index that could become one of the most exciting charts in the crypto market.
While many altcoins look heavy under selling pressure, TOTALDEFI is holding firmly at the 61.8% Fibonacci support near 116B. This zone is often a turning point where strong reversals begin. If the level continues to hold, we might see a 20% move to the upside, signaling renewed strength in the DeFi sector.
This price action could be a sign that decentralized finance projects are ready to lead the next market phase.
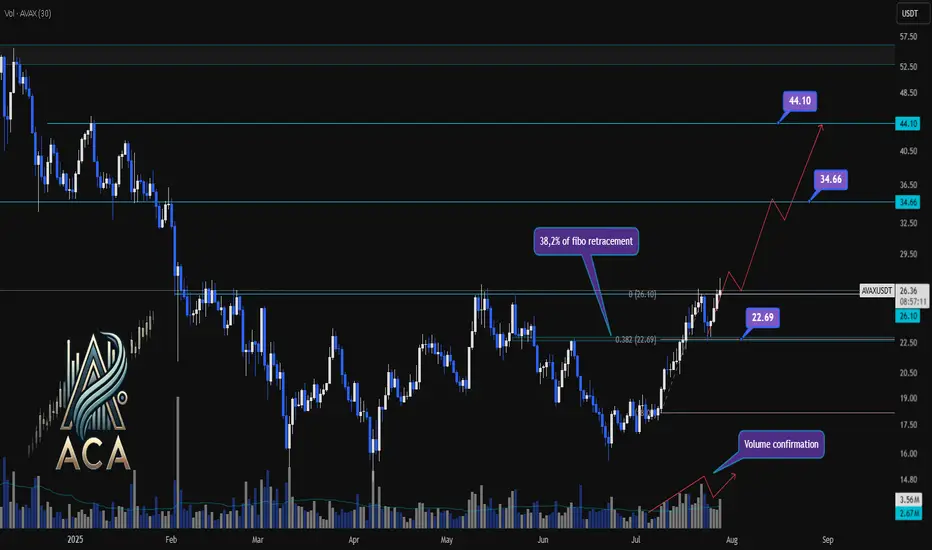
AVAXUSDT Trend Analysis | Will Volume Confirm the Next Big Move?AVAXUSDT Trend Analysis | Will Volume Confirm the Next Big Move?
🔍 Let’s break down the AVAX/USDT setup, examining its technical structure and mapping out key opportunities as it gears up for a decisive move.
⏳ Daily Overview
AVAXUSDT has been exhibiting a bullish structure, recently reacting to the 0.382 Fibonacci retracement level (around 22.69USDT) where price paused for a correction. This correction was technically healthy, as it occurred with declining volume, while upward impulses were marked by notable volume surges—signaling strong bullish participation and confirming accumulation phases.
🔺 Bullish Scenario:
The next area to watch is the resistance at 26.10USDT, which has acted as a major barrier in recent trading sessions. A decisive daily close above this level—preferably supported by a clear uptick in volume—would confirm breakout momentum and set the stage for further advances.
Upon confirmation, the chart points to medium- and long-term targets at 34.66USDT and eventually 44.10USDT. These levels are derived from key Fibonacci extensions and historic price reactions, offering logical take-profit zones for trend-following strategies.
📊 Key Highlights:
- 0.382 Fibonacci level (22.69USDT) acted as a reaction zone and healthy correction point.
- Volume profile validates trend: increased buying volume during upswings, decreased volume on dips.
- 26.10USDT is the next crucial resistance for confirmation.
- Breakout (with volume) opens path to 34.66USDT and 44.10USDT targets.
- Failure to clear 26.10USDT could result in consolidation or another retest lower.
🚨 Conclusion:
All eyes are on the 26.10USDT resistance. Wait for a clear daily close and volume confirmation before considering entries. A breakout above this level could propel AVAXUSDT towards higher Fibonacci targets, while a rejection may prompt another retest of prior supports or consolidation.
Stay sharp and plan your trades with discipline!
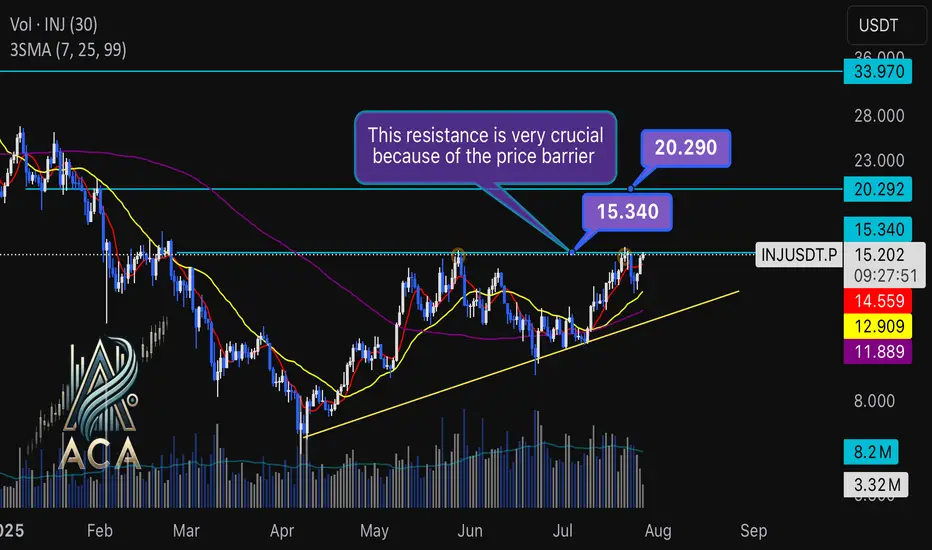
INJUSDT Daily Chart Analysis | Uptrend Brewing at Crucial LevelINJUSDT Daily Chart Analysis | Uptrend Brewing at Crucial Resistance
🔍 Let’s break down the INJ/USDT setup, examining its technical structure and mapping out key opportunities as it gears up for a decisive move.
⏳ Daily Overview
The INJUSDT pair is forming a solid bullish structure, supported by a clear ascending triangle pattern on the daily timeframe. Notably, the 3SMA (7, 25, 99) are crossing to the upside, signaling the early stage of a potential upward trend. This momentum is reinforced by the ascending triangle’s rising trendline, showing steady accumulation and higher lows.
🔺 Bullish Scenario:
Price is consolidating just below the critical resistance at $15.340—a key zone highlighted by multiple rejections in recent months. A confirmed breakout above this level, especially if backed by a surge in volume, would not only trigger a triangle breakout but also complete the weekly candle formation as a bullish hammer, strengthening the bullish case.
If this breakout sustains, short-term targets line up at $20.290, with the long-term roadmap pointing toward $33.970.
📊 Key Highlights:
- 3SMA (7, 25, 99) MA cross signals the beginning of an upward trend.
- Daily ascending triangle points to persistent bullish pressure.
- $15.340 remains a crucial resistance; price has tested and failed here twice before.
- Breakout confirmation (with volume) could ignite a rapid move to $20.290.
- Failure to break may result in another retest of the triangle’s trendline support.
🚨 Conclusion:
All eyes are on the $15.340 resistance. Wait for clear daily close and volume confirmation before entering. A successful breakout aligns with a bullish weekly hammer and could trigger the next phase higher. Beware of fakeouts, as rejection at resistance could send INJUSDT to retest lower trendline zones.
Stay sharp and plan your entries wisely!
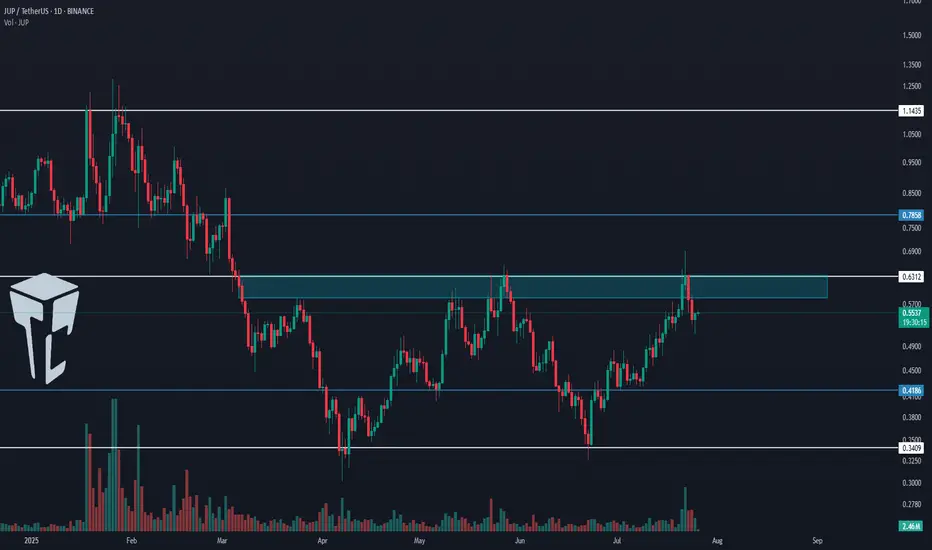
TradeCityPro | JUP Eyes Breakout as Altseason Momentum Builds👋 Welcome to TradeCity Pro!
In this analysis, I want to review the JUP coin for you. It’s one of the projects in the Solana ecosystem, currently ranked 59 on CoinMarketCap with a market cap of $1.65 billion.
📅 Daily Timeframe
On the daily timeframe, this coin is currently sitting below a very important resistance zone at 0.6312. This is a strong resistance area and serves as the main trigger for a trend reversal in this coin.
✔️ The main support floor for JUP is located at 0.3409, a level price has tested twice before. Now it has returned to 0.6312, and we can see increased market volume at this level, which indicates tension between buyers and sellers.
✨ A breakout of 0.6312 would be a good trigger for a long position, and I plan to open a long if this level breaks. This could potentially be a long-term position with a high risk-to-reward ratio.
🔔 The next major resistance zones are at 0.7858 and 1.1435, which we can use as targets for this position.
🔽 If the price gets rejected from the top and moves down, breaking 0.4186 and 0.3409, we can look to open a short position.
🧩 The break of 0.3409 would confirm the start of a downtrend, and it's one of the key zones where I’ll definitely look to hold a short position if it breaks.
📝 Final Thoughts
This analysis reflects our opinions and is not financial advice.
Share your thoughts in the comments, and don’t forget to share this analysis with your friends! ❤️
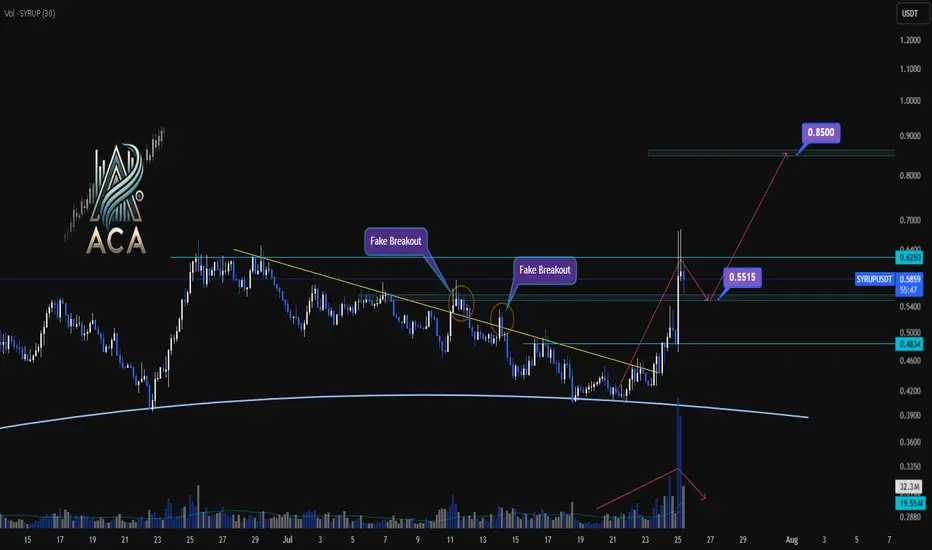
SYRUPUSDT 4H Chart Analysis | Trendline Breakout & Next MovesSYRUPUSDT 4H Chart Analysis | Trendline Breakout & Next Moves
🔍 Let’s break down the latest action on the SYRUP/USDT 4H chart and pinpoint what comes next as trend and momentum cues line up for traders.
⏳ 4-Hour Overview
- The recent breakout above the key trendline was backed by a surge in volume, providing clear momentum confirmation and pushing price toward resistance.
- Price has already reached 1.5R of the initial breakout target, a strong sign the trend is in motion.
- Upon touching the $0.6250 resistance, momentum cooled, with volatility decreasing — a classic consolidation phase after a high-energy move.
🔻 Correction & Structure
- With volume subsiding and momentum slowing post-$0.6250, we’re now expecting a corrective move down toward $0.5515.
- This retracement zone will be critical to watch for higher low formation – a bullish structural signal if supported by volume confirmation.
🔺 Long Setup:
- Should SYRUP reclaim and break above $0.6250 after setting a higher low at $0.5515, and with renewed volume, we could see another strong leg higher.
- The next major resistance sits around $0.85 — this aligns as a logical upside target based on the range extension.
📊 Key Highlights:
- Trendline breakout with sharp volume spike = momentum confirmation.
- 1.5R reached before first deep pullback; structure remains bullish above $0.5515.
- Watch for a higher low and subsequent break of $0.6250 with volume to confirm the next move to $0.85.
🚨 Conclusion:
SYRUP’s chart is at a pivotal juncture: a constructive pullback to $0.5515 could set up the next wave higher if supported by volume. A confirmed breakout above $0.6250 targets $0.85 — stay patient and wait for volume signals at key levels.
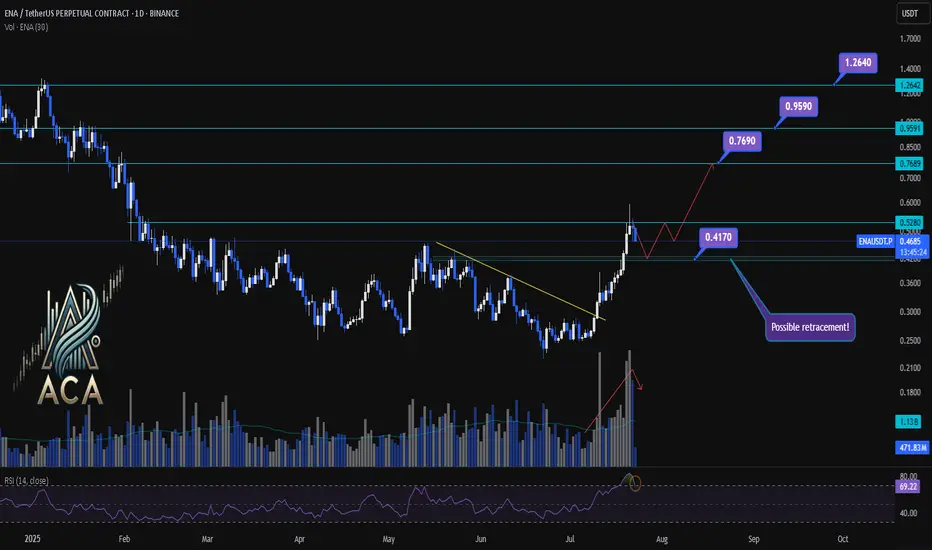
ENA/USDT Chart Analysis | Volatility Signals & Bullish TriggersENA/USDT Chart Analysis | Volatility Signals & Bullish Triggers
🔍 Let’s dive into the ENA/USDT perpetual contract and analyze recent price action, focusing on momentum shifts and key breakout scenarios.
⏳ Daily Overview
The daily chart shows that ENA recently reentered the overbought zone on the RSI, which can serve as a potential trigger for traders watching momentum shifts. Earlier, price action broke decisively above a long-standing descending trendline, resulting in a rapid, nearly 100% surge, a classic RR2 move off the trendline. This breakout coincided with a visible uptick in trading volume, confirming strong demand behind the move.
Now, during the ensuing rest or correction phase, trading volume is decreasing—often a constructive sign suggesting either profit-taking or a healthy pullback rather than panic selling.
🔺 Bullish Trigger & Setup:
- RSI Signal: Reentry into the RSI overbought zone is a potential long trigger, especially if confirmed by price action.
- Confirmation Level: A daily close with strong volume above $0.528 would add conviction to a bullish setup.
- Trendline Reference: The break above the recent trendline fueled the rapid advance, showing the importance of watching such key resistance levels.
📊 Key Targets (on further bullish confirmation):
- $0.769 — First upside resistance.
- $0.959 — Next bullish target.
- $1.264 — Extension target if momentum continues and broader market sentiment remains supportive.
🚨 Conclusion:
Eyes are on the $0.528 level—closing above it with volume, especially while RSI holds in the overbought zone, could provide the next strong entry signal. Current declining volume during pullbacks suggests this is likely a profit-taking phase or standard correction, not bearish capitulation. Keep monitoring RSI, volume profile, and price closes for the next actionable opportunity.
TradeCityPro | AAVE Holds Gains as Altseason Optimism Builds👋 Welcome to TradeCity Pro!
In this analysis, I’m going to review the AAVE coin for you. It’s one of the major DeFi coins active in the lending sector and currently ranks number 1 in terms of TVL.
✔️ The token itself has a market cap of $4.58 billion and is ranked 29 on CoinMarketCap.
📅 Daily Timeframe
On the daily timeframe, since our last analysis, the price has increased by over 100%, and the trigger for long or buy positions was activated.
🔄 There was a descending trendline on this coin, and the trigger for its breakout was 148.17. After breaking that level, we could open a long position.
🚀 However, the main trigger was 194.97, and the primary uptrend started with the break of that level, continuing up to a high of 328.9.
📊 The issue with this current uptrend is that, as you can see in the second leg, there is clear weakness, which is not a good sign for the continuation of this trend.
📈 The current top at 328.9 is not far from the previous high, forming a double top-like structure, leading to a strong bearish divergence in the RSI.
💥 If RSI confirms a breakdown below 50, this divergence will become active and a correction toward 222.10 may occur. A break of that level would be the first signal of a potential trend reversal for AAVE.
⭐ On the other hand, if price wants to continue upward, we have a very important resistance at 383.59.
🔍 Breaking this resistance would initiate an uptrend in higher cycles and could even lead to a new ATH for this coin.
💼 I plan to open a long position if the 328.9 resistance is broken, and for spot purchases, I will wait for a breakout of 383.59.As long as the price remains above 279.45, I am not considering any short positions.
📝 Final Thoughts
This analysis reflects our opinions and is not financial advice.
Share your thoughts in the comments, and don’t forget to share this analysis with your friends! ❤️

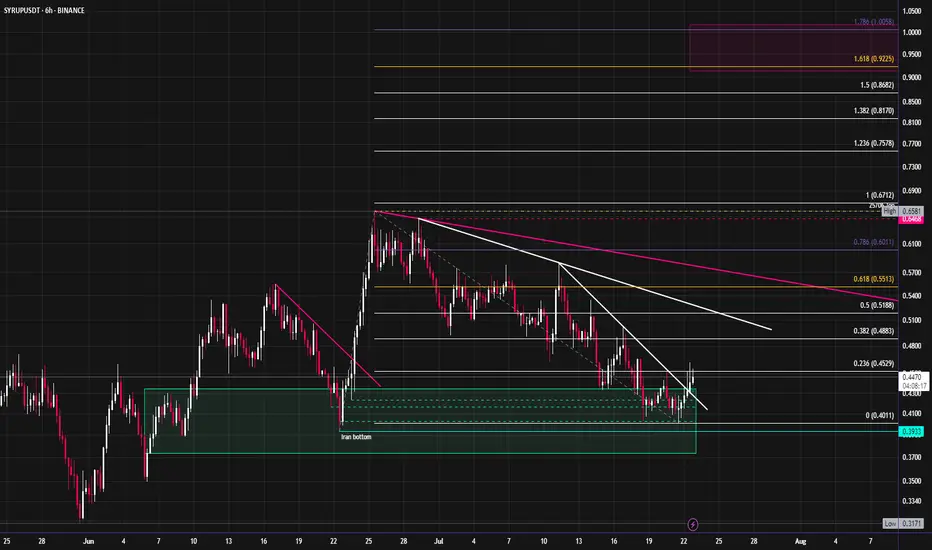
Syrup looks ready to start moving towards new ATH'sCRYPTOCAP:SYRUP has started to break out of its downtrend after revisiting the June lows. It has outperformed most of the market since April, with this month's pullback being an exception. I expect an aggressive move up into new highs. The fibs around $1 look like a good target for the short term, this would also be ~1b mc.
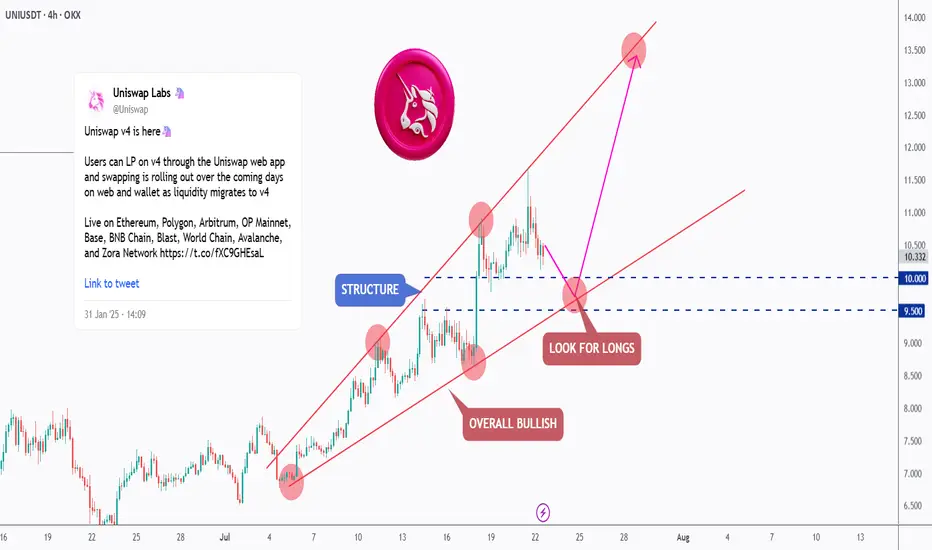
[Deep Dive] UNI – Edition 1: Retest. Reload. Rally?Uniswap (UNI) has been trading within a well-respected rising channel, showing consistent bullish structure across the 4H timeframe.
After a strong rally from the $7.50 region, price is now undergoing a healthy correction — retesting the lower boundary of the channel, which intersects with the $9.50–$10.00 demand zone.
📐 Technical Outlook
The market has printed a series of higher highs and higher lows, confirming the bullish momentum. The recent correction is testing a key support structure — previously a resistance zone — and this confluence aligns perfectly with the channel’s lower bound.
As long as this zone holds, UNI is well-positioned for a continuation toward the $13–$14 region, in line with the pink projected path.
🔥 Fundamental Boost
Uniswap has recently launched its V4 upgrade, introducing "hooks" — customizable smart contracts that allow developers to build more complex DeFi logic directly within liquidity pools. This upgrade not only enhances flexibility and capital efficiency, but also reduces gas costs — making Uniswap an even more dominant player in the DEX ecosystem.
Additionally, with Ethereum L2 adoption growing and Uniswap expanding across multiple chains (Arbitrum, Base, and Optimism), protocol usage and fees are on the rise again.
The UNI token may soon benefit from the proposed fee switch, which would redirect a portion of protocol fees to token holders — potentially adding new value accrual mechanics.
🟢 Conclusion
The technicals and fundamentals are aligning. UNI is in a bullish structure, trading at a key area of interest, and the latest upgrades may unlock new growth for the ecosystem.
Traders and investors alike should keep a close eye on this zone for long opportunities, as the next impulse could be just around the corner.
💬 What do you think — is UNI ready to break toward new highs, or will the demand zone fail? Let me know in the comments 👇
🔔 Disclaimer: This analysis is for educational and informational purposes only. It does not constitute financial advice or a recommendation to buy or sell any asset. Always do your own research and manage your risk accordingly.
📚 Always follow your trading plan => including entry, risk management, and trade execution.
Good luck!
All strategies are good, if managed properly.
~ Richard Nasr
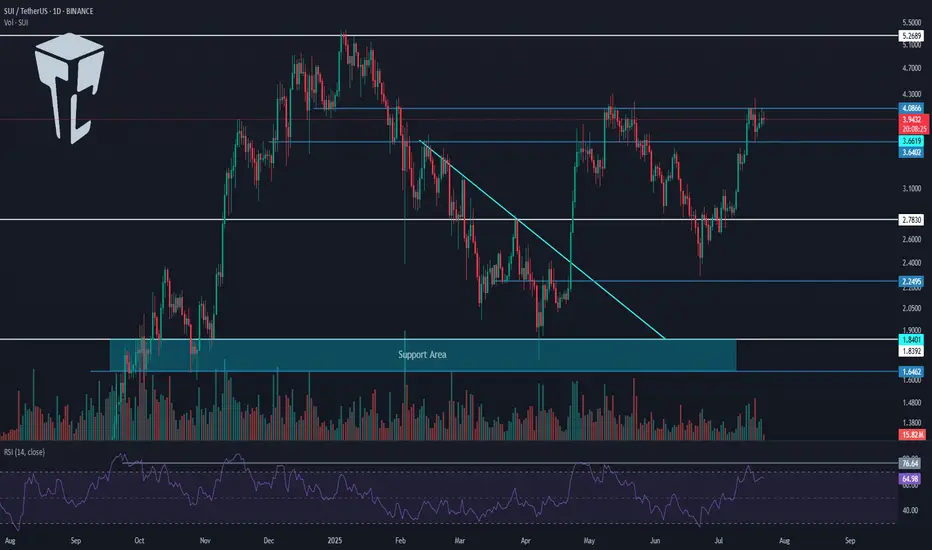
TradeCityPro | SUI Eyes Breakout with Bullish Momentum Rising👋 Welcome to TradeCity Pro!
In this analysis, I want to review the SUI coin for you. It’s one of the Layer1 projects in the crypto space, currently ranked 13 on CoinMarketCap with a market cap of $13.66 billion.
📅 Daily Timeframe
On the daily timeframe, a lot has changed for SUI since the previous analysis. After breaking the descending trendline, it has started a new bullish trend.
✔️ In the first bullish leg after breaking the trendline, the price reached the 4.0866 zone, and now after a correction, it’s moving upward again.
📈 The 4.0866 level is a very important resistance. In fact, we can draw a resistance range between 3.6402 and 4.0866, as the price tends to behave erratically within this zone.
⭐ Currently, the price has re-entered this range and if 4.0866 is broken, the bullish wave could continue. The first target for this wave could be 5.2689.
🔼 So, if 4.0866 is broken, I highly recommend opening a long position, because if the price truly breaks this level (and it’s not a fake breakout), then the minimum target would be 5.2689.
📊 If the buying volume continues to increase as it is now, and the RSI breaks above 76.64, the chances of breaking 5.2689 will also rise, and the price may even set a new ATH.
👀 I already have an open position on this coin based on lower timeframe triggers, and I’m currently waiting to see the reaction to 4.0866. Based on my entry, if the price moves toward 5.2689, the risk-to-reward ratio will be very high. That’s why I’ve kept part of my position open to potentially capture that move.
🛒 For spot buying, we can also use a futures strategy — meaning if 4.0866 breaks, we open a futures position targeting 5.2689, and then use the profit from that position to buy SUI in spot, gradually building our spot portfolio.
✨ If you are looking at this coin only for spot, the main trigger is the breakout of 5.2689. But be careful — if the price moves aggressively, it might not give you a proper entry trigger, and entering from that area might be difficult.
📝 Final Thoughts
This analysis reflects our opinions and is not financial advice.
Share your thoughts in the comments, and don’t forget to share this analysis with your friends! ❤️
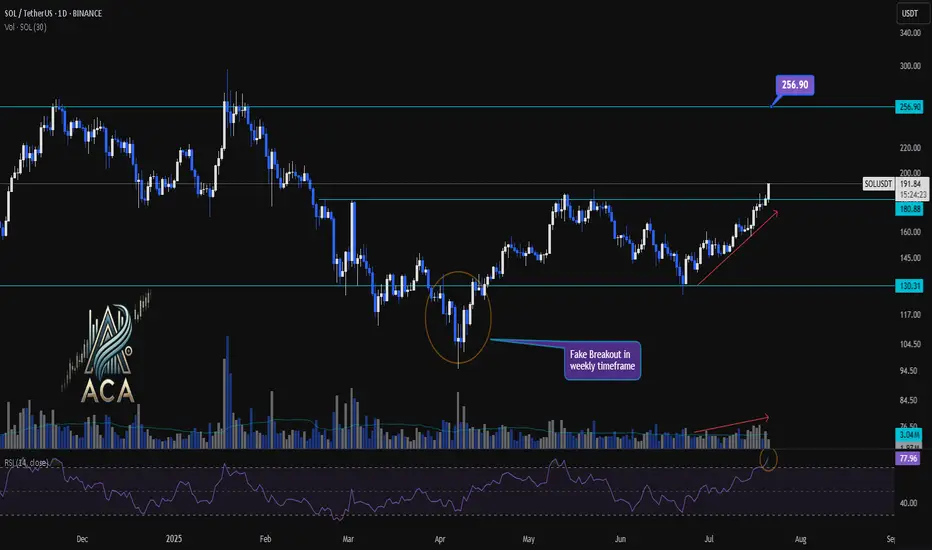
SOLUSDT 1D Chart Analysis | Accumulation Breakout Signals....SOLUSDT 1D Chart Analysis | Accumulation Breakout Signals Fresh Momentum
🔍 Let’s drill into the SOL/USDT daily chart, focusing on the recent breakout above the accumulation range, key support and resistance levels, RSI momentum, and volume confirmation for a robust bullish scenario.
⏳ Daily Overview
SOLUSDT has decisively broken out above a prolonged accumulation box, marking a significant shift in market structure. A daily close beyond this range now serves as a strong indicator for renewed bullish momentum. RSI is currently above 77, signaling that buyers are commanding momentum. Notably, volume has surged in tandem with price, confirming trader participation behind this breakout move.
📈 Technical Convergence and Trend Structure
- Accumulation Zone Break: After consolidating within a clear box for weeks, SOLUSDT closed above the upper boundary (around $180.88–$191.05), signaling a possible trend reversal or continuation.
- Daily Close Signal: A daily close outside the accumulation box offers high conviction for bullish continuation. This close acts as a potential entry signal for trend-followers.
- RSI Momentum: The RSI sits above 77—deep in the overbought territory. A close here not only confirms buyer strength but often precedes sustained uptrends when accompanied by price breakouts.
- Volume Surge: Volume has increased with the breakout, providing confirmation the move isn’t a false start, but likely fueled by real demand.
- Weekly Fake Breakout: There was a notable false breakout in the weekly timeframe, quickly reclaimed by bulls. This flip suggests buyers fended off downside attempts and now drive higher prices.
🔺 Bullish Setup & Targets
- First Target: $256.90 — marking the next major resistance on the chart and a logical upside objective for traders.
- Key Trigger: A confirmed daily (or weekly) close above the accumulation range with strong volume is essential for validating the upward trajectory.
📊 Key Highlights
- The breakdown of the accumulation box—now turned support—marks a pivotal structural change.
- RSI and price are making new local highs, solidifying the case for continued bullish momentum.
- Volume is climbing in sync with the move, offering real confirmation versus a potential fakeout.
- Recent fake breakout on the weekly chart, immediately negated, emphasizes that buyers are regaining—and likely maintaining—control.
🚨 Conclusion
SOLUSDT appears set for higher prices following the confirmed breakout above the accumulation range. Signs of trend health include an overbought RSI, volume confirmation, and the swift invalidation of a recent weekly fake breakout. As long as daily closes stay above the breakout level, the path remains clear for a rally toward $256.90. A strong daily close and continued volume will be your best signals for bullish continuation.
TradeCityPro | LDO Breaks Out Amid Altseason Hype Shift👋 Welcome to TradeCity Pro!
In this analysis, I’m going to review the LDO coin for you. It’s one of the well-known DeFi projects in crypto with the highest TVL in this category, and the LDO coin ranks 82 on CoinMarketCap with a market cap of $1.08 billion.
📅 Daily timeframe
On the daily timeframe, LDO has been in a range box for several months and is now starting to break out of it.
💥 After being supported at the 0.683 bottom, a large amount of buying volume entered, and a sharp bullish move occurred from this bottom to the top of the box. The RSI has also entered the Overbuy zone.
🔔 The overextended level on the RSI oscillator is 79.66, which has even been broken during this leg. Right now, I think the probability of a correction is quite high.
🔍 Yesterday's candle made a deep penetration into the top of the box, and currently, the price is sitting above the box. Since RSI is in the overextended zone, a pullback or short-term rest is likely.
🚀 However, considering the current uptrend, I believe this bullish leg might be ending, and we could see a few corrective candles. But after the correction ends, a new bullish leg might begin, pushing the price toward the resistance levels at 1.480 and 2.382.
🛒 For a long position or a spot buy, we can enter during this new bullish leg once the top breaks and a confirmation of a new wave starting is in place.
📝 Final Thoughts
This analysis reflects our opinions and is not financial advice.
Share your thoughts in the comments, and don’t forget to share this analysis with your friends! ❤️

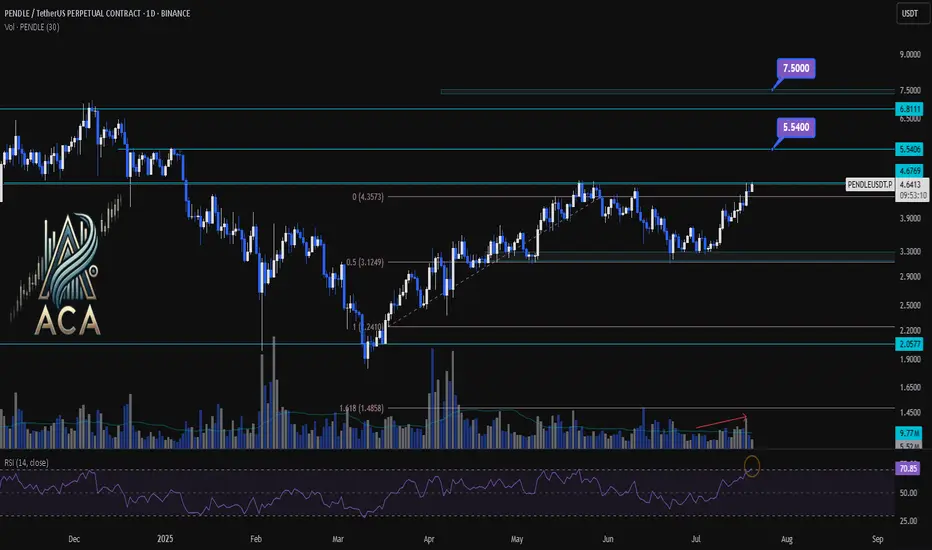
PENDLEUSDT 1D Chart Analysis|Bullish Breakout Eyes Higher TargetPENDLEUSDT 1D Chart Analysis | Bullish Breakout Eyes Higher Targets
🔍 Let’s break down the PENDLE/USDT daily chart, focusing on breakouts above key resistance, Fibonacci retracement dynamics, RSI momentum, and volume confirmation for a comprehensive bullish setup.
⏳ Daily Overview
PENDLE has staged a powerful recovery after pulling back to the 0.5 Fibonacci retracement level (around $3.12). Price is now testing the critical $4.68 resistance—the ceiling from the last corrective wave. RSI has jumped above 71, entering the overbought zone, a classic precursor to strong momentum moves. Volume is rising as bulls attempt a breakout, confirming participation behind the price action.
📈 Technical Convergence and Trend Structure
- Fibonacci Structure: The correction held the 0.5 retracement, a textbook bullish reversal zone in rising trends.
- Resistance Breakout: Price is challenging the $4.68 resistance. A daily close above, especially with high volume, would confirm the breakout and trigger bullish continuation.
- RSI Indicator: RSI has cleared the 70 mark, reinforcing strong momentum. Overbought RSI often supports further rallies when backed by breakout moves and rising volume.
- Volume Confirmation: Volume surged as PENDLE reclaimed lost ground and is now accelerating into the resistance test, suggesting trend conviction and confirming the move.
🔺 Bullish Setup & Targets
- First target: $5.54 — the next resistance based on historical supply and Fibonacci extension.
- If macro conditions like interest rate cuts align, the next potential target: $7.50 — the major extension target where price discovery is likely.
- Key trigger: A strong daily (or weekly) close above $4.68, combined with breakout volume, is likely to ignite the next leg up.
📊 Key Highlights
- Correction held at the 0.5 Fibo, signaling trend health and resetting momentum.
- A bullish daily structure aligned with a weekly breakout confluence.
- RSI and price action both making new local highs — strong uptrend indication.
- Volume confirming the move—a real breakout is underway, not a false start.
🚨 Conclusion
PENDLE/USDT looks primed for continuation higher. The blend of a successful 0.5 retracement retest, breakout attempt above $4.68, robust RSI, and volume surge all point to bullish follow-through. Watch for a confirmed close above resistance as the catalyst for further upside, with $5.54 and $7.50 the next logical targets if momentum persists.
3 Wins to Glory.You guys know my long term Targets for ETH.
What I wanted to highlight is the angle of the Banana zone has been remarkably consistent on the Log chart.
Granted we only have 2 - 2.5 data points
But note how even in 2025 the run is adhering to the approx 60 degree angle of attack, after breaking out of their respective W's.
something to monitor.

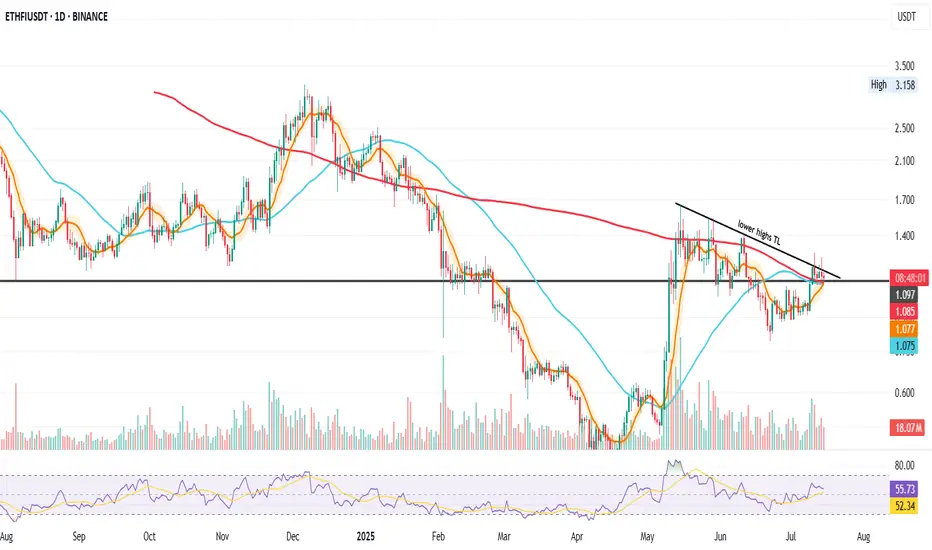
ETHFI Coil Tightens Above Key SupportThis is ETHFI on the daily.
It’s currently consolidating above four major support levels:
• The black line at $1.097
• The 200-day MA
• The 50-day MA
• Bollinger Band center
A golden cross is approaching, and if price pushes higher, it could confirm soon. RSI is holding strong above both the 50 level and the signal line, suggesting bullish momentum is intact.
There’s also a bullish triangle forming between the series of lower highs and the $1.097 black line. Volume is decreasing, just as expected before a breakout. While breakouts can technically go either way, my bias remains bullish here.
From a fundamental standpoint, ETHFI benefits from the rising trend of restaking staked ETH, now regulated and attracting serious institutional interest.
Holding this support and completing the golden cross could be a volatile process, especially with ETHFI’s small $424M market cap and big macro events this week (like CPI and potential tariff news) on the radar.
Always take profits and manage risk.
Interaction is welcome.
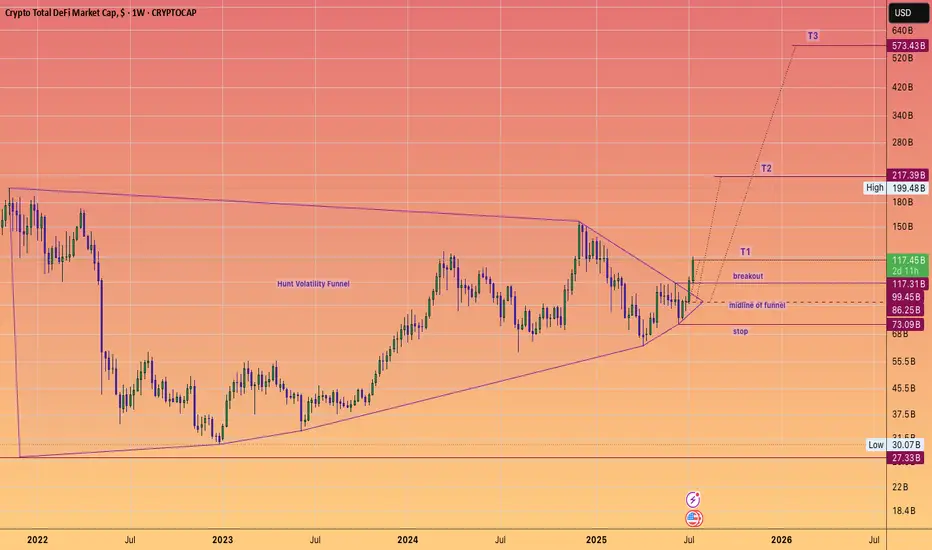
DeFi Moonshot! Moon mission to $573 Billion dollars!DEFI fuelled by Ethereum, built on proven protocols and stablecoin legislation is ready to keep cranking higher for the rest of the year. And instead of a Defi summer of emergence (2020), a multi season of adoption that takes it to half a trillion dollars, hitting these targets of a #HVF
@TheCryptoSniper
The components set to benefit are:
Uniswap #UNI ~ $12.3 Billion
Lido DAO #LDO ~ $9.1 Billion
Aave #AAVE ~ $7.5 Billion
MakerDAO #MKR ~ $4.6 Billion
GMX #GMX ~ $2.5 Billion
Curve #CRV ~ $1.9 Billion
Synthetix #SNX ~ $1.1 Billion
Pulsex #PLSX ~ $0.46 Billion
Key points:
The #TotalDefi index is currently at $117B aligning closely with the $123.6B of TVL
As we see hundreds of billions of dollars get digitized watch this index climb onwards and upwards... With $1 Trillion dollars and obvious milestone that is surely set to be met ... one day.
TOTAL DEFI: HTF Reaccumulation Underway — $200B+ In SightThis is one of the cleanest HTF setups in the market right now — and it’s flying under the radar.
We're looking at TOTAL DEFI market cap, and it’s showing all the signs of strong reaccumulation following a textbook breakout–retest structure off a larger HTF accumulation base.
Price broke out from the 2023–2024 accumulation range, retested that breakout zone and range highs in August 2024, swept liquidity, and tapped into unmitigated demand within the accumulation range — before climbing back to the $155B region, creating a larger range above the prior accumulation range it broke out from.
Since then, price pulled all the way back to range lows and HTF demand at $65B, forming a new bullish reversal from this key region and retesting the trendline breakout before continuing another leg higher — as we’re now seeing unfold.
But here’s the key:
🧠 That recent deviation came with the highest volume ever recorded on this chart — right off the range low and HTF demand.
That’s not retail. That’s large operators loading up, leaving their footprint ahead of the next expansion leg.
We’ve now:
- Broken the descending trendline cleanly
- Flipped key SR levels back into support
- Started pushing higher with strong HTF closes
📈 Expectation:
This is a spring + test setup within a reaccumulation range. I’m targeting continuation toward the range highs, followed by a macro breakout that could take DeFi market cap to $200B+ — especially once the prior distribution zone is reclaimed.
This aligns with the broader cycle narrative — liquidity rotating back into altcoins, particularly DeFi, as stablecoin dominance declines and the market shifts fully risk-on into the final phase of the bull cycle.
Key Structure Summary:
- HTF accumulation base → breakout → retest → demand sweep
- Largest volume spike = operator footprint
- Higher lows forming = market structure flipping
- Expecting expansion to $200B+ as trend continues
One to watch closely.
Don’t fade the volume. Don’t fade the structure.

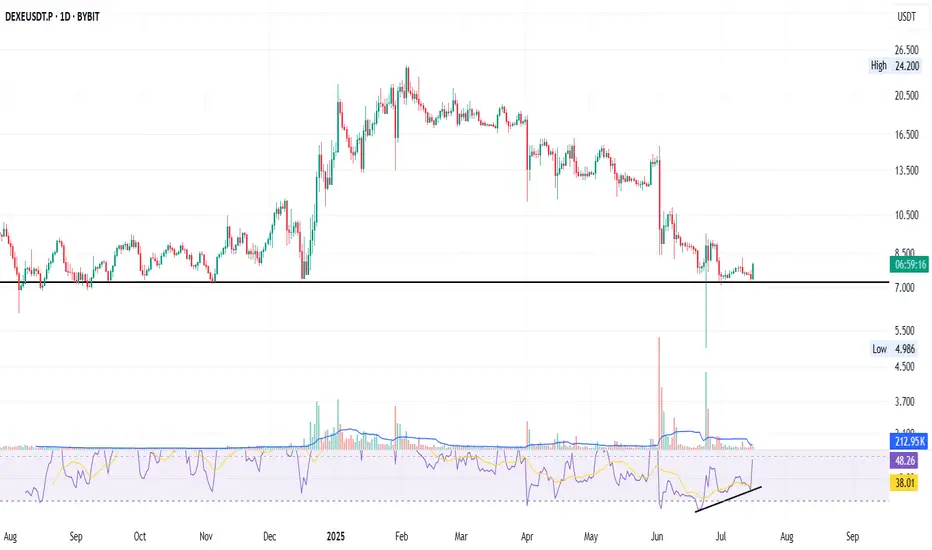
DEXE: Bounce + RSI Divergence + DeFi Strength
DEXE on the daily just bounced off an 11-month-old support - the key black line.
A strong bullish divergence on the RSI has been building for over a month — now confirming with momentum.
That long green wick under support? It’s signalling buyer interest and possible accumulation.
Fundamentals:
DEXE powers decentralized governance (DAO) with AI + DeFi alignment.
It enables transparent on-chain decision-making and sustainable DAO growth.
Backed by real partnerships, aiming for fair, merit-based participation.
I’m long: not financial advice.
Always take profits and manage risk.
Interaction is welcome.
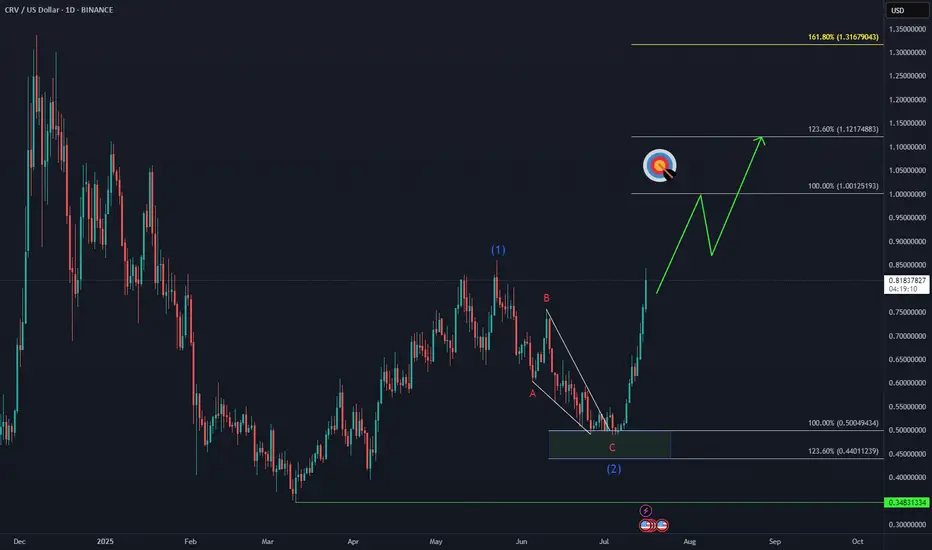
CRV Marching Toward Target📈 CRYPTO:CRVUSD is approaching a key breakout level, with bulls aiming to surpass the May peak and reach the $1.00 initial target.
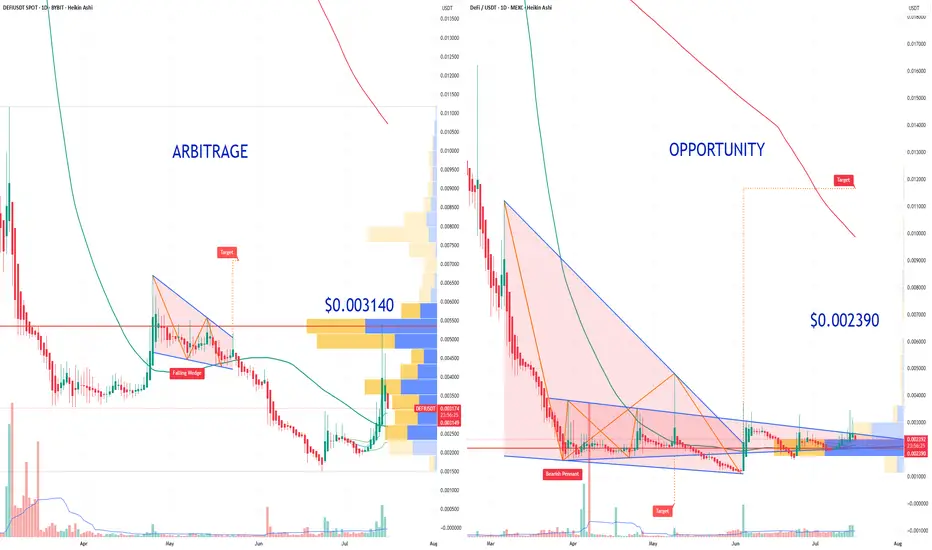
Arbitrage Opportunity!I believe I’ve identified an arbitrage opportunity involving the DEFI cryptocurrency: it trades at $0.003200 on Bybit, compared to only $0.002390 on MEXC.
I recall encountering a similar situation with Shiba Inu, when the price gap between Binance and Coinbase was as high as 8X. Feel free to play the chart below to see the outcome:
I also remember the 2016–2017 period, when such arbitrage opportunities existed even with Bitcoin, due to price discrepancies between Asian exchanges and those available to European traders.