DEFI

TradeCityPro | AXL : Steady Uptrend & Potential Breakout Ahead👋 Welcome to TradeCityPro!
In this analysis, I will review AXL, the token of the Axelar project, which serves as a Crosschain platform and also features a blockchain explorer.
📅 Daily Timeframe: Uptrend and SMA Slope Change
On the daily timeframe, we observe a steady and gradual uptrend with a low slope. A clear ascending trendline is also visible, which has been tested by the price four times so far.
📈 The token has broken out of its box’s ceiling at 0.8318, but it hasn’t started its main bullish movement yet. A pullback to this level has occurred, and if 1.1281 is broken, the price could initiate its primary upward wave.
👀 Apart from the 1.1281 resistance, there is another significant resistance at 1.2781, located near this zone. Thus, the range between 1.1281 and 1.2781 forms a strong resistance zone, and breaking above this area could mark the start of the uptrend.
🧩 Given the upward slope of the SMA99, I believe we will soon see its influence, pushing the price higher.
🚀 If this zone is broken, the next targets are 1.6587 and 2.2828, with the second target being close to the ATH.
📉 Correction Scenario
In the event of a correction, the first key area is 0.8318, which has already been tested once and held firm. For deeper corrections, the initial zone to watch is the ascending trendline, and if the trendline breaks, 0.6386 becomes the next notable support.
📝 Final Thoughts
This analysis reflects our opinions and is not financial advice.
Share your thoughts in the comments, and don’t forget to share this analysis with your friends! ❤️

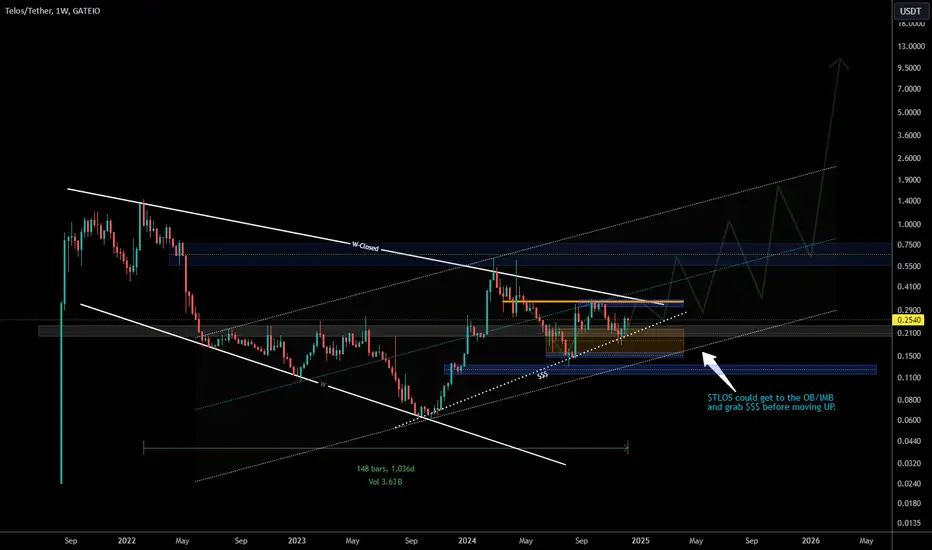
$TLOS Weekly - Fastest, Cheapest & Reliable Web3 ProductTelos released EVM 2.0 Upgrade
See below:
We are pleased to announce that as of November 20, 2024, Telos EVM version 2.0 has been successfully deployed to production. It is now accessible at:
Mainnet: rpc . telos . net
Testnet: rpc . testnet . telos . net
Key Features and Technical Considerations
This significant upgrade brings our network closer to feature parity with Ethereum while reducing the install footprint. However, there are a few technical considerations to note:
EIP-1559 Support
The fee market change introduced in the London hard fork (EIP-1559) is still under development and not yet supported.
Long-Running Operations
Long-running multicall (eth_call) read-only operations will no longer time out.
Long-running transactions, however, remain constrained and should be batched.
Solidity Version Limitations
No new changes to Solidity version compatibility. Version 0.8.23 is fully supported, and 0.8.24 is partially supported. See more details here.
Transitioning to Version 2.0
To modernize our infrastructure, we will discontinue support for EVM versions 1.0 and 1.5 in phases. Partners should prepare for this transition to avoid disruption.
Block Hash Calculation Changes
Version 2.0 introduces a new block hash calculation methodology:
Partners not relying on block hashes can migrate seamlessly.
For those dependent on block hashes (e.g., exchanges, indexers, subgraphs), re-indexing the chain may be required.
Note: Transaction hashes remain unchanged.
Rate-Limiting for Legacy Versions
Effective January 6, 2025, we will begin rate-limiting all Telos hosted 1.x RPC infrastructure:
Initial limits: 50 requests per second
Further reductions will follow to encourage migration to version 2.0.
Deprecated RPC Endpoints
The following Mainnet RPC endpoints will soon no longer be supported:
mainnet. telos. net/evm
mainnet15. telos. net/evm
mainnet-us. telos. net/evm
mainnet-eu. telos. net/evm
mainnet-asia. telos .net/evm
Resources for Node Operators
If you are interested in running your own Telos EVM node, detailed resources are available:
Installer Script and Documentation: GitHub Repository
Support: Telos Developer Community
Next Steps
We strongly encourage all partners to begin migrating to Telos EVM 2.0 as soon as possible to take advantage of its enhanced capabilities and ensure uninterrupted service.
Best regards,
Telos Core Developers
TradeCityPro | AEVO : Accumulation Box with Potential for Growth👋 Welcome to TradeCityPro!
In this analysis, I’m going to review the AEVO coin. This project operates in the Premarket space, providing users with charts of coins before they are listed, enabling them to trade within this market.
📅 Daily Timeframe: Accumulation Box
On the daily timeframe, we observe a ranging accumulation box that, unlike most altcoins, has not been broken yet and remains below the resistance level of 0.6160.
💪 There is a critical zone at 0.4472 that acted as a strong resistance prior to being broken. After the breakout, during a market correction, this zone prevented a deeper price drop and provided a strong recovery for the coin.
✨ The RSI indicator has shown a very strong positive divergence since the beginning of the chart, featuring five lows. Currently, this divergence is active and could reflect its influence on the chart.
🛒 The key area right now is 0.6160. If this level is broken, the accumulation box will also break, and we can expect the divergence to manifest its effect on the price action.
📈 Upon breaking this level, the next resistance levels are 0.7776 and 1.0775. The next major resistance is the ATH, located at 3.6599. Considering the project's low market cap, reaching this target is plausible if sufficient buying volume enters the market.
🤝 If you already hold AEVO and are in profit, I recommend continuing to hold, as the coin has not moved significantly yet. Given its high potential, it’s worth holding at least until 0.7776 or 1.0775.
🔽 Correction Scenario
If the price corrects, the first significant area is 0.4472, which has been tested once and has proven to be very robust. In the event of a deeper correction, 0.2823 is the most critical level on this chart and represents the coin’s final stronghold.
📝 Final Thoughts
This analysis reflects our opinions and is not financial advice.
Share your thoughts in the comments, and don’t forget to share this analysis with your friends! ❤️

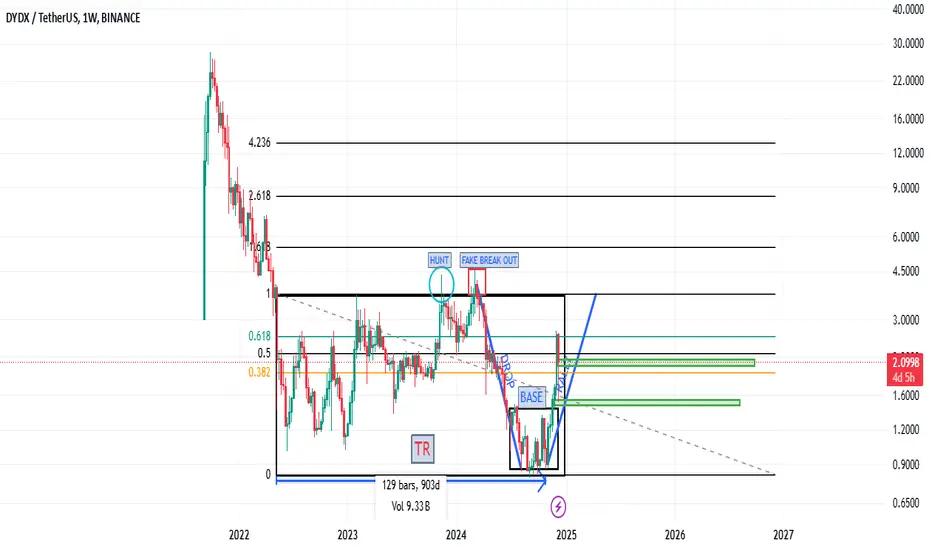
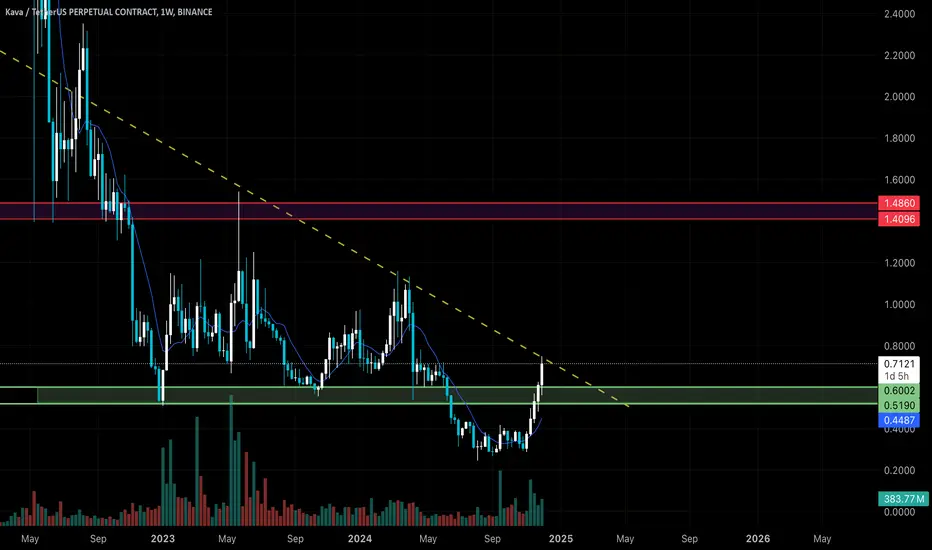
A bright future!!!hello friends
We have come with the analysis of another coin
DYDX which is in DEFI area.
This coin has been suffering for a long time and now by making a bottom, it was able to experience an upward movement.
It is expected that it will move at least up to the limit of range and this time it is likely to succeed in breaking the ceiling.
Now, if you have this coin, you can keep it up to the range limit, and after the successful failure of the range, you can proceed to the specified targets with it.
Now, if you want to buy this coin, our suggestion to you is that one entry step is appropriate now and we will wait if the market corrects at the specified points, we will buy other steps.
If you grow from this area, you can buy a step with the successful failure of your TR and wait for good targets...
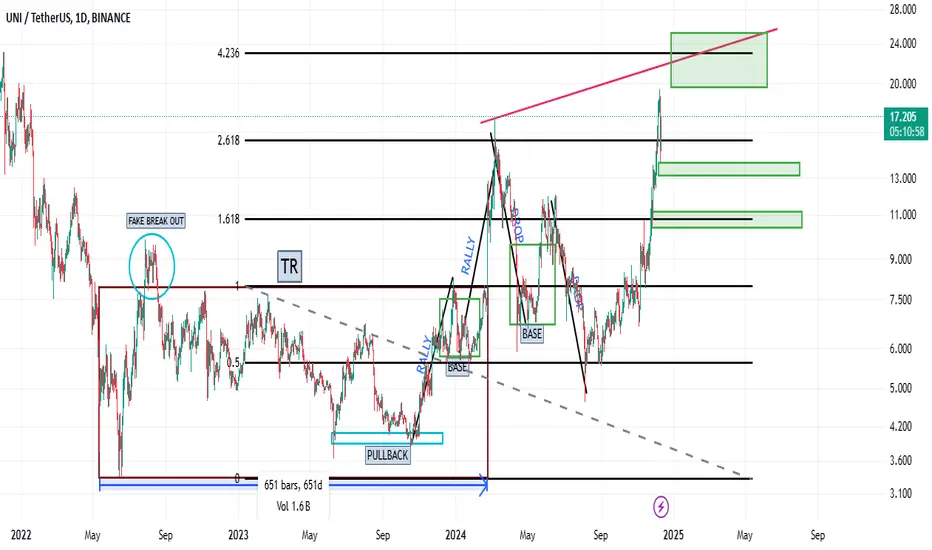
Analysis and review of UNISAWPHello dear friends
We are at your service by analyzing and reviewing a coin from the DEFI field.
Coin of the decentralized exchange UNISAWP, which is a very, very potential coin.
This coin has expected movements, as you can see, it was suffering for a long time, now that the decentralized exchanges are speaking first, it was able to get out of the suffering and make an upward movement, but this is just the beginning of the story...
After his rise, he made a good pullback and due to the rounding of the trend, he gives us this signal that a big rise is happening.
If you have this currency, we suggest that you keep it.
But if you are looking for a buying opportunity, you can make a buying step here and wait to buy in the specified areas if the market corrects.
Note that this coin has a good future...
AAVE to $840Based on the weekly chart (1W) for the AAVE/USDT pair, here are the predicted support and resistance areas that can be identified:
Support Levels:
Support 1: 175–190 USD
This zone is seen as a blue Area of Interest (AoI) with high volume below the current price. This level is likely to be an accumulation area if the price corrects.
Support 2: 135–150 USD
A lower support area based on historical movements. This zone is important to maintain the long-term bullish structure.
Support 3: 105–110 USD
Key support based on the long accumulation range in 2023. If the price falls to this level, it could be a great opportunity for long-term buying.
Resistance Levels:
Resistance 1 (Initial Target): 275–280 USD
This is the current level being tested, and breaking it will be a confirmation to continue the bullish trend. Resistance 2 (Intermediate Target): 365–380 USD
Located near the 0.382 Fibonacci level, this is an intermediate target if the price manages to break through 275 USD.
Resistance 3 (Main Target): 840–1,000 USD
The next major target is near the red zone (Area of Interest) on the chart. This level is an important psychological resistance that will attract traders' attention.
Strategy for Price Movement:
Bullish Scenario: If the price breaks through 275 USD with high volume, the potential for an increase to 365 USD and then to 840–1,000 USD is very possible.
Bearish Scenario: If the price fails to break through 275 USD and corrects, the potential for a decrease to support at 175–190 USD or even 135–150 USD should be considered as an accumulation opportunity.
Monitor additional indicators such as volume and momentum (RSI/MACD) for trend validation. Also make sure to use good risk management, such as a stop loss below a key support level.
CRYPTOCAP:AAVE BINANCE:AAVEUSDT CRYPTOCAP:TOTALDEFI CRYPTOCAP:OTHERS

Zilliqa (ZIL)🔢 ZIL Analysis
🔹 Overall Status: The ZIL coin, after experiencing a downtrend within a descending channel, has now reached the channel's upper boundary. The PRZ zone (green zone), weekly resistance, and the upper boundary of the descending channel have acted as strong resistance, halting further upward movement. Currently, the coin is moving downward.
🔹 Support and Resistance Analysis:
1️⃣ Support Levels:
Initial Support: Fibonacci level 0.382, which could prevent further price decline.
Additional Supports: If the 0.382 level is broken, Fibonacci levels 0.5 and 0.618 will serve as subsequent support zones.
2️⃣ Resistance Zone:
PRZ Zone: Strong trading volume in this area indicates the potential for breaking this resistance.
🔹 Price Movement Predictions:
Bullish Scenario (if PRZ is broken):
The price could move toward the blue zones, overlapping with Fibonacci levels 1.618, 2.618, and 3.618.
High trading volume in this scenario would reinforce the validity of the movement.
Bearish Scenario (if the correction continues):
The upward wave that started from the bottom of the descending channel has now reached the 0.382 Fibonacci level.
If this level fails to hold, the price correction may extend to the 0.5 and 0.618 Fibonacci support levels.
🔹 RSI and Entry Signals:
Monitoring RSI behavior on daily and weekly timeframes is essential.
RSI entering the Overbuy zone could serve as a positive signal for further upward movement.
The midline of the ascending RSI channel may act as significant support.
✅ Conclusion and Recommendations:
1️⃣ Key Support and Resistance Levels:
Supports: Fibonacci levels 0.382, 0.5, and 0.618.
Resistance: PRZ zone and blue zones (Fibonacci targets).
2️⃣ Entry Strategies:
Enter incrementally after a correction and near key support levels.
Consider entry after breaking the PRZ zone and confirming price stability above it.
3️⃣ Risk Management:
Monitor trading volume near support and resistance levels to confirm price movements.
Track RSI behavior to gauge the strength of the trend.
💡 Don’t forget to manage your capital wisely and pay close attention to price action near critical levels.

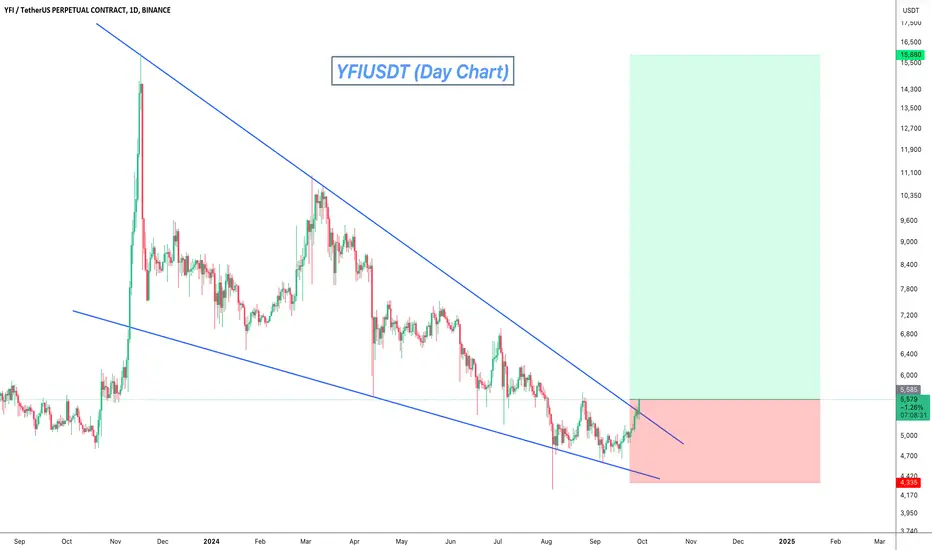
YFIUSDT Falling Wedge Breakou!YFIUSDT technical analysis update
YFI's price is breaking out of a falling wedge pattern after 325 days of formation. On the weekly chart, the price is bouncing from major bottom support, which can be considered bullish for YFI
Regards
Hexa
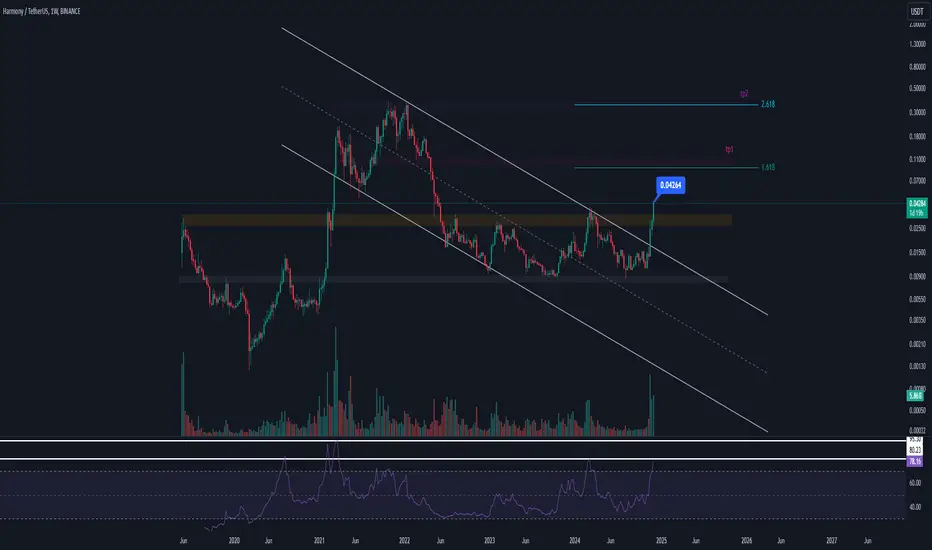
Harmony (ONE)📊 Comprehensive Analysis of Harmony (ONE)
🔍 Overview: Harmony, after experiencing significant trading volume, successfully broke out of its descending channel. The breakout of the weekly resistance zone (yellow area) in the weekly timeframe opens new opportunities for upward movement.
🕰 Technical Analysis:
Current Situation: The price, having surpassed the weekly resistance, is poised to target Fibonacci levels of 1.618 and 2.618.
RSI Analysis:
RSI is encountering a critical resistance level that could temporarily halt the upward momentum.
A breakout above this resistance could push RSI into the Over-Extended zone, which may trigger a sharp price surge.
🎯 Recommendations and Entry Points:
Layered Entry Strategy:
First Entry: At the current price zone.
Second Entry: After a correction and pullback to the yellow zone (previously broken resistance).
📌 Key Considerations:
Risk Management: Proper capital management and risk allocation are crucial.
Market Volatility: Sudden market reactions can lead to unexpected losses. Failing to adhere to effective risk management could result in significant setbacks.
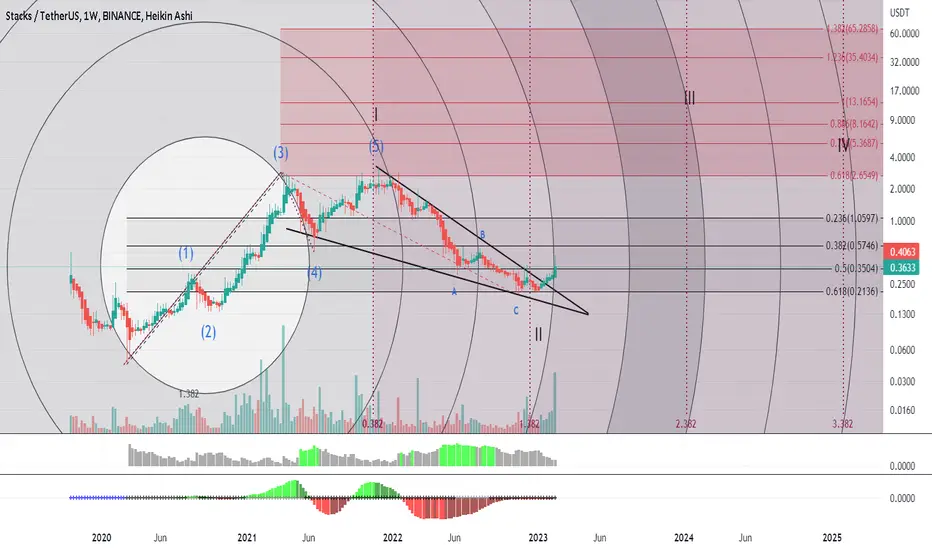
The Road to $66 for STXUSDT (Stacks)$STXUSD has now beautifully broken out of the triangle after an impressive textbook correction at the 0.618 Fibonacci retracement.
This type of correction is a typical feature of wave 2 in an Elliot wave count, which indicates that $STXUSDT is now ready to embark on its third impulsive wave, often referred to as the most explosive one.
Considering the increasing volume, an explosive surge in the number of transactions on the network, and the oscillators, we can expect a swift development in the price towards the following resistance levels:
— 0.57
— 1.06
— 2.85
— 5.96
— 8.16
— 13.17.
#stxusdt #stxusd #BNS #DeFi #BitcoinNFTs #Stacks
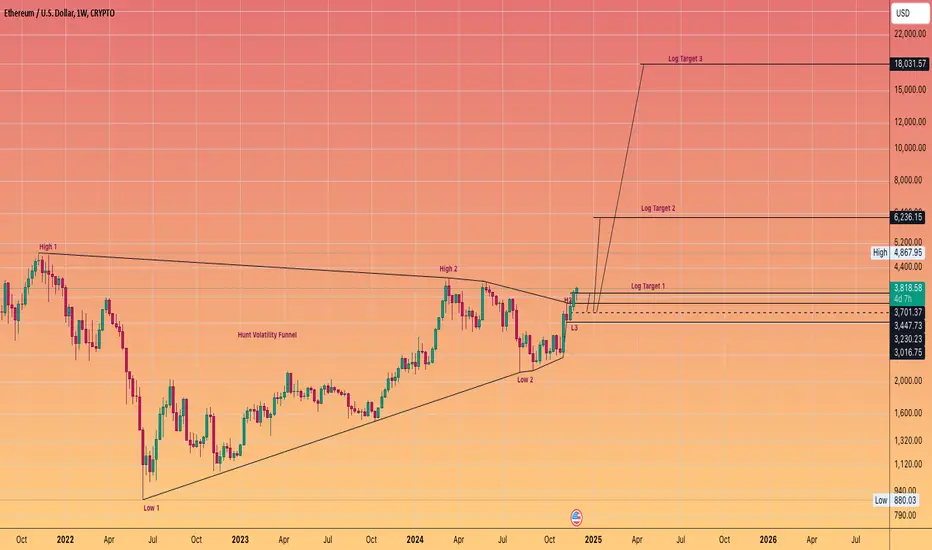
ETHEREUM projects to $18,000 Using logarithmic projections the measured move of this #HVF takes #ETH well in to the teens.
The caveat being it may not happen in 2025 but completes the pattern, later on this decade.
It is a big market cap of around 2 trillion based on the current circulating supply.
So not a pie in the sky valuation at all.
@TheCryptoSniper
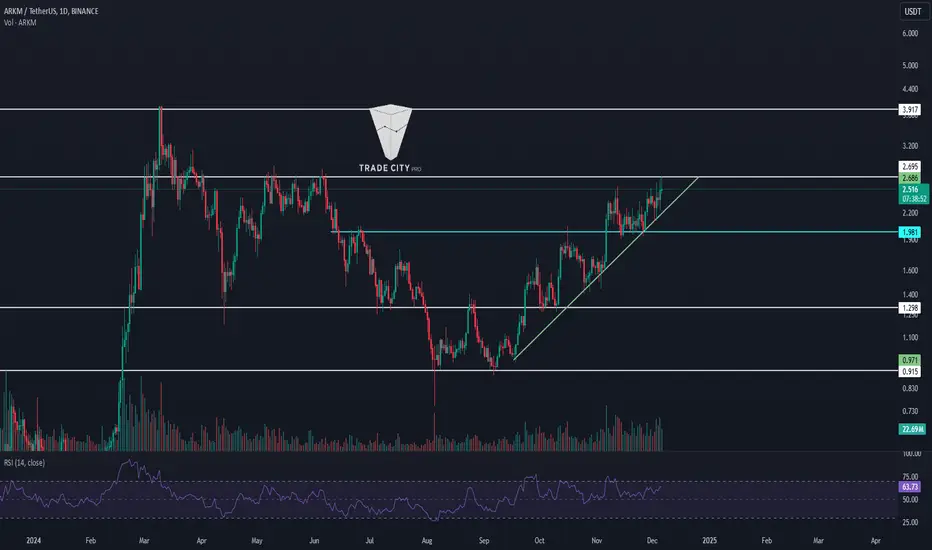
TradeCityPro | ARKM : Uptrend with Increasing Buy Volume👋 Welcome to TradeCityPro!
In this analysis, I’ll review ARKM. If you’re active in the DeFi space, you’ve likely used Arkham, a platform designed for tracking wallets—a highly useful tool for DeFi enthusiasts.
📅 Daily Timeframe: Uptrend with Rising Buy Volume
On the daily chart, after a price drop, the 0.915 support prevented further decline. Following the breakout above 1.298, bullish momentum entered the market, driving the price upward to the 2.695 resistance level.
🔑 This uptrend is supported by a trendline that has provided solid backing for the price in three instances so far. Additionally, buying volume has been steadily increasing, indicating a strong trend with no signs of weakness.
✨ As long as RSI remains above the 50 level, market momentum is considered bullish. A drop below 50 would reset momentum.
📈 If the 2.695 resistance is broken, the next bullish leg could begin, with 3.917 as the subsequent resistance level.
🔽 In case of a pullback, the price may correct to the trendline, which would be a minor retracement. The next significant support is at 1.981.
📉 For short positions, I personally won’t open any unless the price drops below 1.981 and confirms a trend reversal below this support.
📝 Final Thoughts
This analysis reflects our opinions and is not financial advice.
Share your thoughts in the comments, and don’t forget to share this analysis with your friends! ❤️
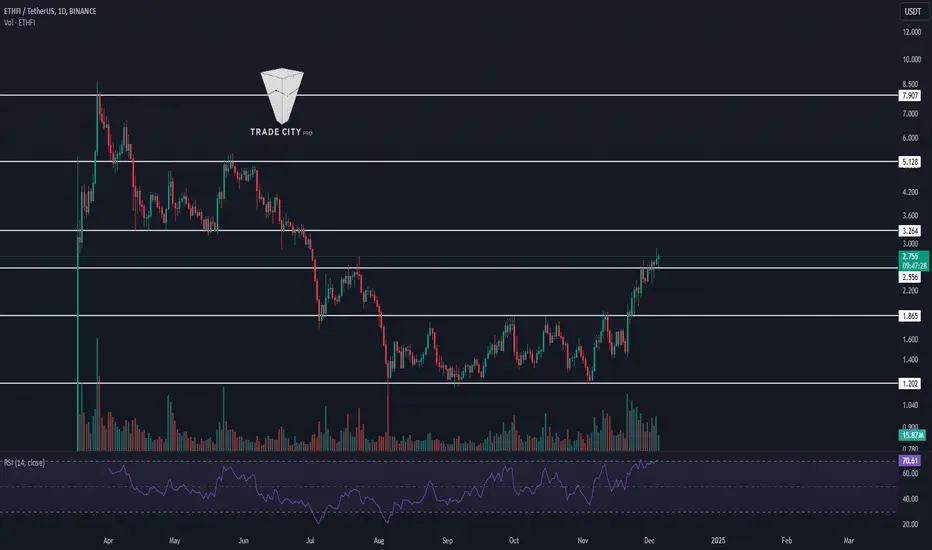
TradeCityPro | ETHFI : Breakout and Bullish Momentum👋 Welcome to TradeCityPro!
In this analysis, I will review the ETHFI coin. This platform is one of the most significant DeFi platforms with a high TVL (Total Value Locked).
📅 Daily Timeframe: Breakout of the Range and Start of an Uptrend
In the daily timeframe, after a sharp drop to the 1.202 support, a range box formed between 1.202 and 1.865.
✨ Following this consolidation within the range and with increasing buying volume, the 1.865 resistance was broken. Currently, after testing the 2.556 resistance once, the second attempt has successfully broken it. The next significant resistance on the chart is 3.264.
📈 After the breakout, volume has gradually decreased, and candle sizes are shrinking, indicating potential weakness in the trend and increasing the probability of a correction.
🔑 On the other hand, the RSI is nearing the Overbought zone, and if it manages to stabilize above 70, the likelihood of a sharp upward move will increase significantly.
🚀 In the case of a sharp move, the next targets are 5.128 and 7.907. If 7.907 is broken, a new ATH (All-Time High) is likely to be established.
🔽 In the case of a correction, the first significant support is at 1.865, and if this area breaks, market momentum will dissipate.
📝 Final Thoughts
This analysis reflects our opinions and is not financial advice.
Share your thoughts in the comments, and don’t forget to share this analysis with your friends! ❤️
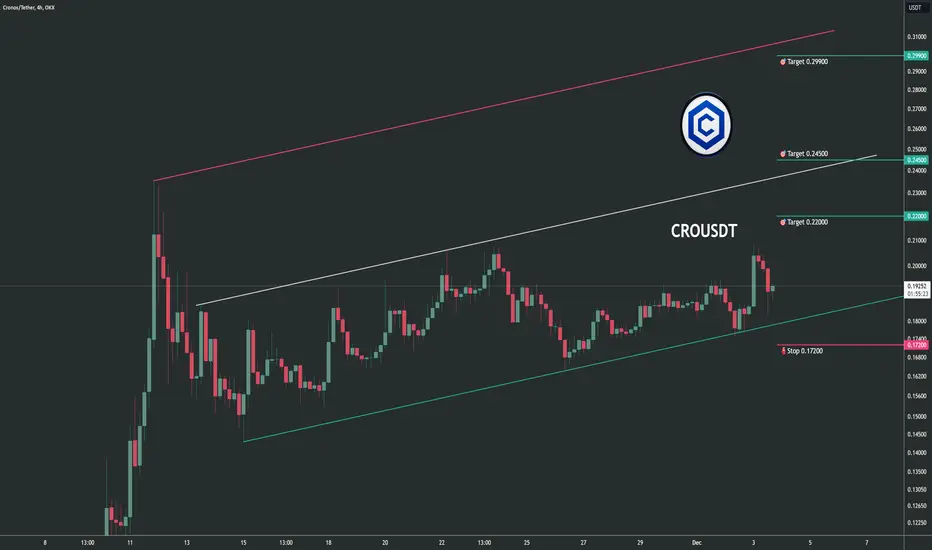
Trading opportunity for CROUSDTBased on technical factors there is a Buy position in :
📊 CROUSDT
🔵 Buy Now
🪫Stop loss 0.17200
🔋Target 1 0.22000
🔋Target 2 0.24500
🔋Target 3 0.29900
💸RISK : 1%
We hope it is profitable for you ❤️
Please support our activity with your likes👍 and comments📝
FTM | Andre Cronje & SONIC UPGRADEThe Future of DeFi: Insights from Andre Cronje & the Sonic Network
Andre Cronje, a pioneer in decentralized finance DeFi, has long been a critical voice in the evolution of blockchain technologies. His journey, which spans revolutionary projects like Yearn Finance to his current work with the Sonic Network, provides valuable insight into the challenges and opportunities shaping the DeFi landscape
Evolving Challenges in DeFi and Regulation
Cronje’s recent discussions frequently highlight the shift in DeFi from its nascent, experimental stages to a more mature, regulated industry. As governments and regulatory bodies increase scrutiny, developers are forced to navigate a complex maze of compliance. Cronje emphasizes the importance of engaging traditional finance professionals to bridge the gap between on-chain technology and regulatory frameworks, a step he acknowledges was challenging but necessary. This convergence, though fraught with hurdles, marks a vital evolution as the DeFi space seeks broader legitimacy.
Sonic Network: A Vision for NextGen Blockchain Performance
At the forefront of Cronje’s work is the Sonic Network, a high-performance blockchain designed to tackle critical bottlenecks in DeFi. Built on innovations like the Carmen database and customized for Ethereum Virtual Machine (EVM) compatibility, Sonic addresses issues of scalability, speed, and usability. With features like over 10,000 transactions per second TPS and sub-second finality, Sonic is poised to redefine the user experience in DeFi applications. Its fee-sharing model also redistributes 90% of transaction fees back to decentralized applications (dApps), incentivizing innovation and reducing reliance on validators.
Technological Plateaus and the Need for New Leaps
Cronje frequently underscores that DeFi’s progress is not linear but iterative. The field has often reached technological plateaus, awaiting breakthroughs like the advent of zero-knowledge proofs or significant enhancements in execution environments. These advances, Cronje believes, will enable the next wave of DeFi applications, allowing for trustless exchanges, oracles, and execution layers to replace current, trust-dependent systems.
The Shifting Demographics and Culture of DeFi
One of Cronje’s more provocative insights pertains to the cultural shift within DeFi. The early days were dominated by technologists and developers motivated by pure innovation. Today, the space is increasingly influenced by meme coins and speculative trading, drawing in a demographic less interested in foundational technology. While this shift has broadened crypto's appeal, it raises concerns about the dilution of DeFi’s original ethos of decentralization and technological advancement.
App Chains vs Layer1 Models
Cronje also critiques the growing trend of app-specific chains (app chains), which allow projects to customize their execution environments. While he acknowledges their appeal, particularly for gaming and niche use cases, Cronje believes their economic and operational overheads make them impractical for many teams. Instead, he champions models like Sonic’s, where developers can deploy on a scalable Layer 1 network and retain a significant share of value without the burden of maintaining a standalone blockchain.
The Path Forward: Balancing Regulation, Innovation, and Adoption
Looking ahead, Cronje envisions a DeFi ecosystem that balances regulatory compliance with technological innovation. Projects like Sonic embody this vision by reducing barriers for developers and fostering sustainable ecosystems. However, he warns that achieving this balance requires addressing cultural shifts, incentivizing genuine innovation, and maintaining a focus on decentralization
Andre Cronje’s work and insights serve as a guide for navigating DeFi’s complex future. From overcoming regulatory challenges to pioneering the Sonic Network, he highlights the necessity of technological evolution and the importance of maintaining DeFi’s foundational principles. As the space continues to mature, Cronje’s vision underscores the need for resilience, adaptability, and a commitment to innovation.
let’s talk about the price
Right now, BTC is slowing down, and whales are swimming in altcoin oceans. The Sonic upgrade is a great reason to send FTM’s price to the moon, so buy the dip and wait for a month
next targets for FTM or better to say S are 1.3, 1.5 and 1.9$

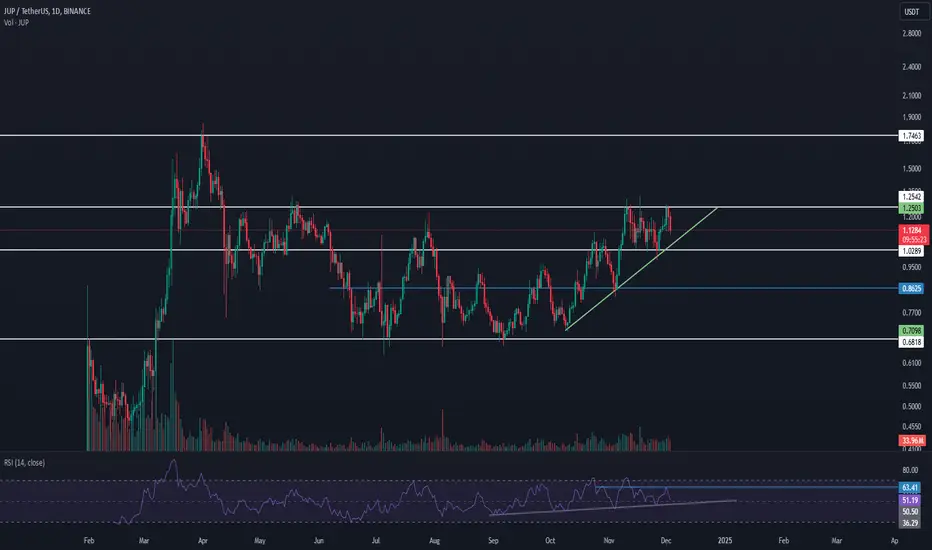
TradeCityPro | JUP : Prepping for a Breakout👋Welcome to TradeCityPro!
In this analysis, I’ll be reviewing the JUP coin. This token is the native token of the Jupiter project, part of the Solana ecosystem, and operates in Solana’s DeFi space.
📅 Daily Timeframe: Breakout from the Box?
In the daily timeframe, we see a long-term box pattern ranging from a bottom at $0.6818 to a top at $1.2542, with the price currently at the upper limit of the box.
🧩 A rising trendline is also visible, with the price touching it three times so far, each time being pushed upwards.
📊 Buying volume has been increasing from the bottom of the box, and now, after reaching the resistance at $1.2542, the reducing volume during the correction indicates the strength of the trend.
🔼 If $1.2542 is broken, the next resistance level will be at $1.7463. Upon breaking $1.7463, it is highly likely that a new all-time high (ATH) will be achieved.
✨ The RSI indicator also shows a rising trendline, and as long as the price remains above this line, the momentum is considered bullish. If 63.41 on the RSI is broken, stronger bullish momentum is likely to enter the market.
📉 In a correction scenario, if the price trendline and the RSI trendline are broken, the first target will be $1.0289, and the second will be $0.8625.
⏳ 4-Hour Timeframe: Futures Triggers
In this timeframe, we can observe the price action in more detail.
📈 If $1.2542 is broken, the price can move towards $1.4619. This trigger looks highly favorable, and I will personally attempt to open a long position if the price stabilizes above this level.
🔽 For short positions, you can consider entering after the trendline and $1.0441 are broken, although I personally avoid opening short positions in the current market conditions.
🔑 As long as the RSI remains above 50, the likelihood of breaking $1.2542 increases.
📝 Final Thoughts
This analysis reflects our opinions and is not financial advice.
Share your thoughts in the comments, and don’t forget to share this analysis with your friends! ❤️
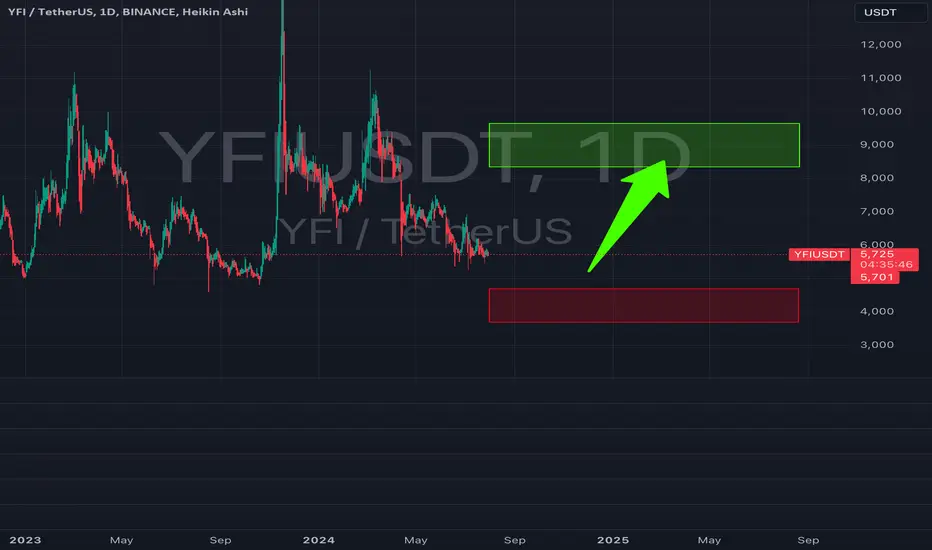
YFI Looking Bullish#CryptoWhale100Billion Alt Coin Analysis: YFI
🚀 Bullish Trend Alert for YFI! 🚀
My analysis indicates that YFI may experience a bullish trend in the medium term. The current price is hovering around the support level of $5300. If it manages to hold this level, we can expect the price to rise to the next resistance level at $8400 and potentially break out.
🔍 Technical Indicators:
RSI: Currently in the oversold region, indicating that ATOM is undervalued and may experience a bullish reversal soon.
MACD: Showing signs of a bullish crossover
Buy: At the current price or lower.
Hold: Maintain the position and consider adding more if the price breaks through the resistance level.
Stop-Loss: If the price drops below the support level of $5000, consider buying or setting stop-loss orders.
📈 Your Thoughts?
Shoot me a message with your Technical Analysis to share your thoughts and trading strategies. Let's discuss where ATOM might go next!
👍 Press the Thumbs Up and leave a comment below with your ideas on ATOM's future movements.
Follow and like! I'll keep making more of these charts.
Thank you for the support!
🔗 Previous Chart Links for Reference Below
#CryptoWhale100Billion #YFI #CryptoAnalysis #TradingStrategy #BullishTrend #TechnicalAnalysis #CryptoCommunity
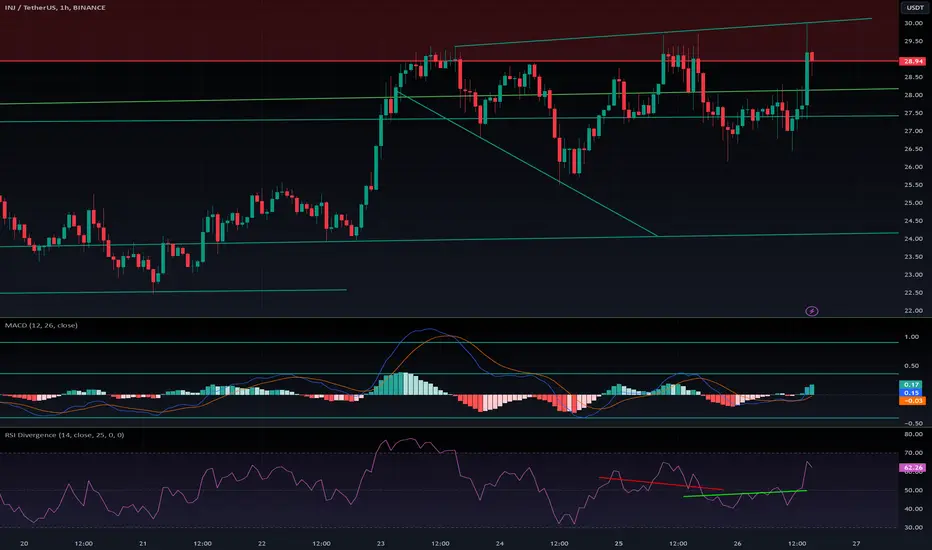
$INJ: Steady Progress with Big Potential** CRYPTOCAP:INJ : Steady Progress with Big Potential**
CRYPTOCAP:INJ has faced repeated rejections at **$30**, indicating significant sell orders at this level. However, the overall trend remains bullish, driven by genuine organic growth rather than market manipulation.
Its uptrend is consistent and precise, following technical indicators like a **Swiss clock**.
Once CRYPTOCAP:INJ breaks above **$31** and establishes it as a support level, we could witness an impressive rally. 🚀
Patience is key—focus on long-term investments in quality projects. Recently, CRYPTOCAP:INJ bridged its meme with Solana, which is expected to bring in additional liquidity and strengthen the ecosystem.
A solid buy, in my opinion, backed by fundamentals and a promising outlook.
**DYOR!**
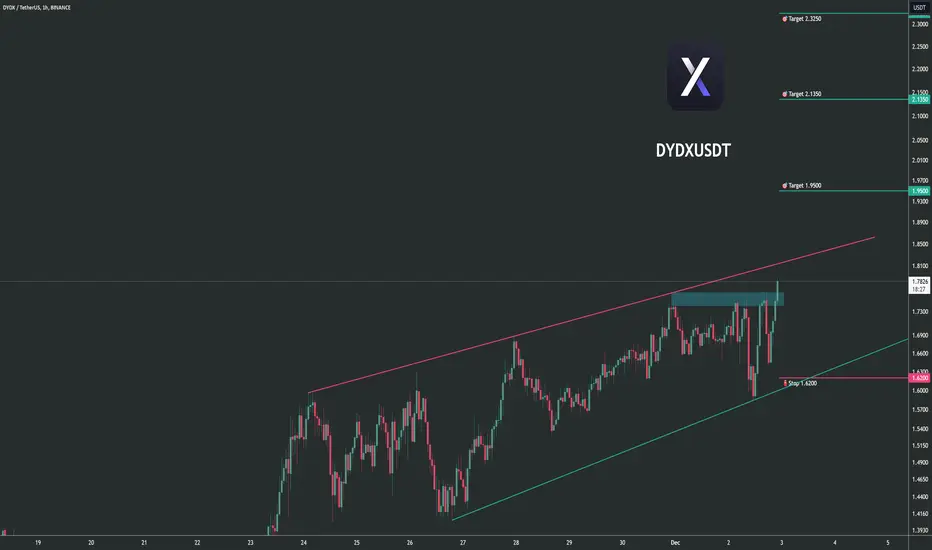
Trading opportunity for DYDXUSDTBased on technical factors there is a Buy position in :
📊 DYDXUSDT
🔵 Buy Now
🪫Stop loss 1.6200
🔋Target 1 1.9500
🔋Target 2 2.1350
🔋Target 3 2.3250
💸RISK : 1%
We hope it is profitable for you ❤️
Please support our activity with your likes👍 and comments📝
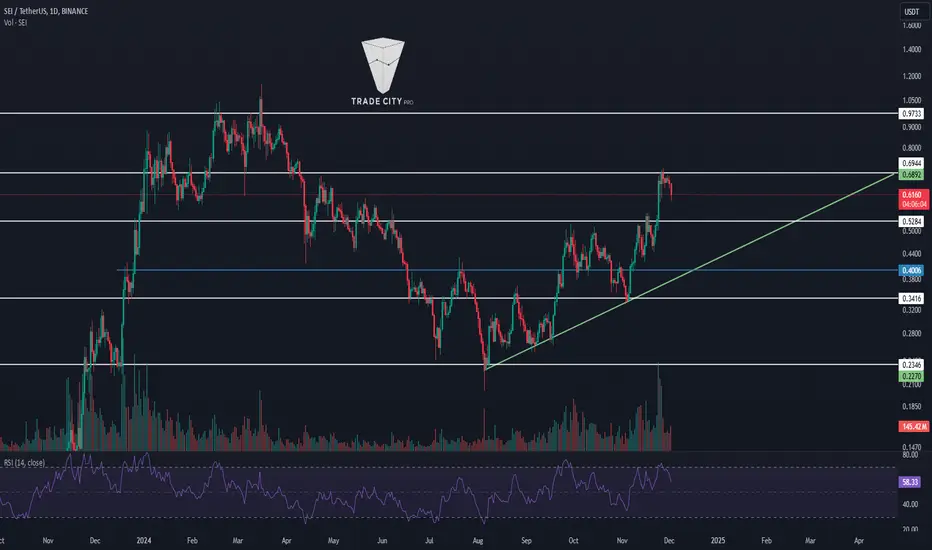
TradeCityPro | SEI : Bullish Momentum with Key Resistance👋 Welcome to TradeCityPro!
In this analysis, we’ll evaluate the performance of SEI, a blockchain designed for decentralized futures trading. For a deeper understanding of the project, you can review its whitepaper.
⏳ Daily Timeframe: High Buying Volume and Uptrend
The daily chart shows a bullish trend supported by a trendline that has been tested three times. Currently, the price is well above this trendline. As long as the price remains above it, the overall trend will stay bullish.
📈 A breakout above $0.6944 could push the price to the next target of $0.9733. Beyond this resistance, SEI may aim for new All-Time Highs (ATH).
🔑 RSI entering the Overbought Zone (above 70) could trigger a sharp upward move.
🔽 In a bearish scenario, the price could correct to $0.5284 initially. A deeper correction might bring it down to the trendline and the $0.4006 support level.
📊 Currently, buying volume exceeds selling pressure, indicating that a correction is unlikely unless significant selling pressure enters the market.
⏳ 4-Hour Timeframe: Futures Triggers
In this timeframe, we’ll focus on identifying potential futures trading triggers:
🔼 For long positions, a breakout above the $0.6944 resistance, especially with increasing buying volume, would be ideal. If RSI also breaks the 50 level, the likelihood of overcoming this resistance increases.
📉 For short positions, a break below the $0.596 level could act as a trigger. However, personally, I avoid shorting as long as the price remains above the daily trendline.
📝 Final Thoughts
This analysis reflects our opinions and is not financial advice.
Share your thoughts in the comments, and don’t forget to share this analysis with your friends! ❤️
Trading opportunity for 1INCHUSDTBased on technical factors there is a Buy position in :
📊 1INCHUSDT
🔵 Buy Now
🪫Stop loss 0.4120
🔋Target 1 0.5300
🔋Target 2 0.6000
🔋Target 3 0.6900
💸RISK : 1%
We hope it is profitable for you ❤️
Please support our activity with your likes👍 and comments📝
