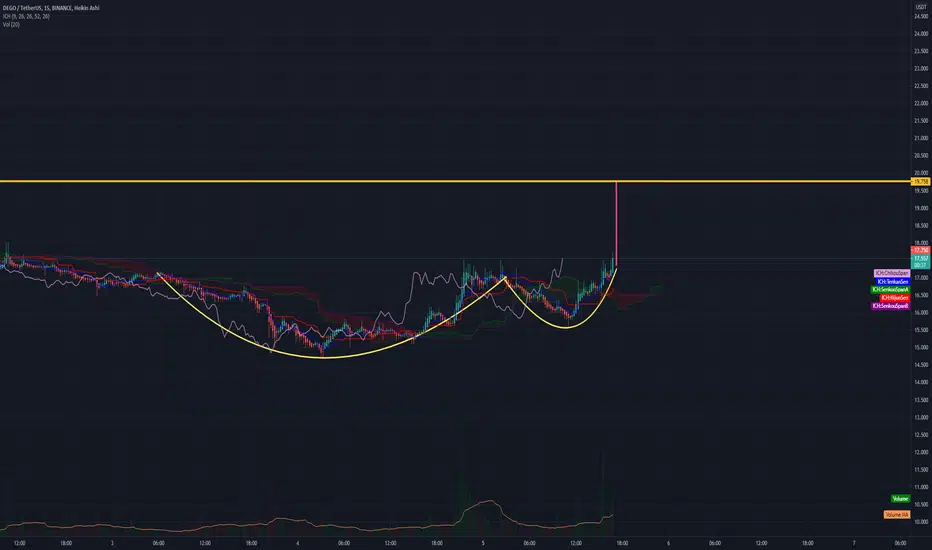
Dego Cup + Handle completed. 19.5 $ stop Dego Cup + Handle completed. Volume confirmation done.
Safe buy zone 17.40 $
Stop : 19.5-20$ (if you like risk above 20 $)
Profit : %15-20
This is not an investment advice.
DEGOUSDT
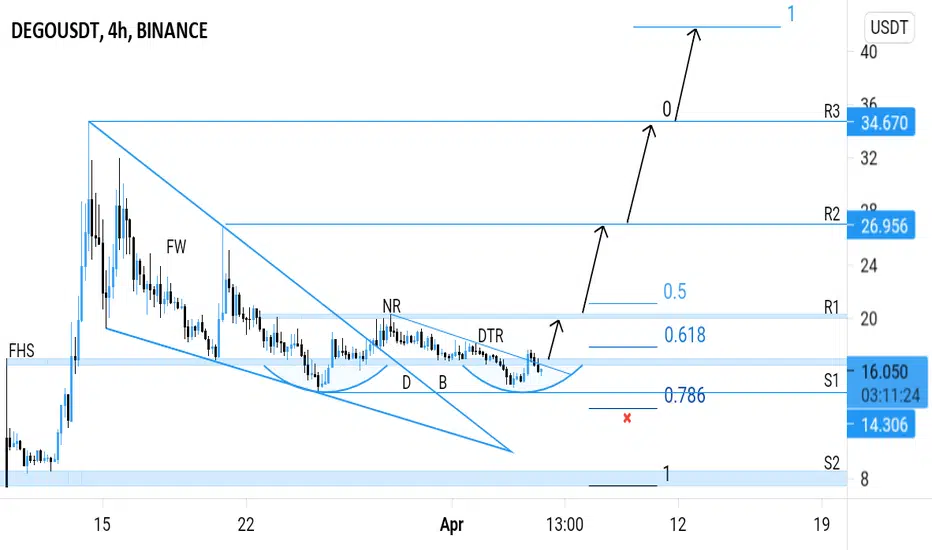
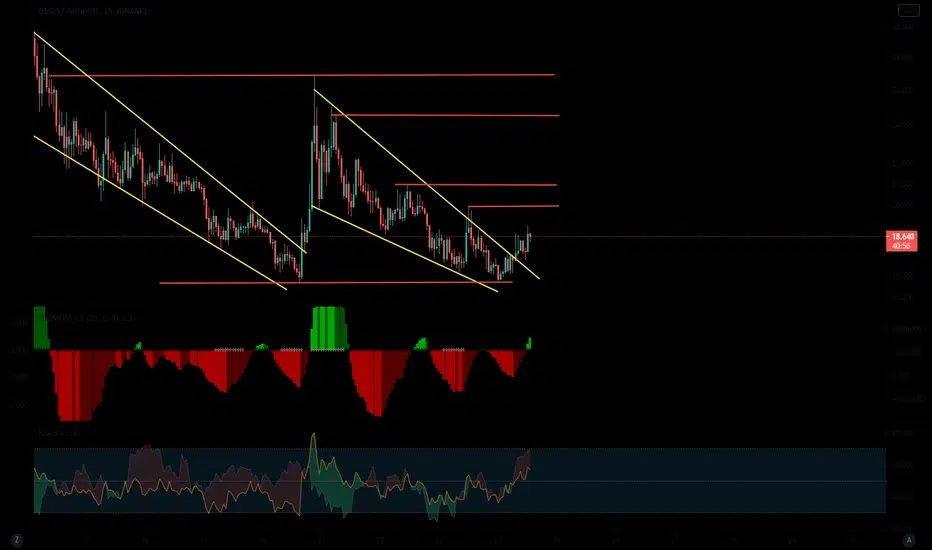
DEGOUSDT (DEGO FINANCE) - BULLISH SETUP ANALYSIS 🔎
- DEGOUSDT hit an ATH and retraced.
- Price retested the flip horizontal support (FHS) and key fibonacci retracement zone (0.5 - 0.618 - 0.786).
- There was a relatively high concentration of buyers at the retest zone.
- The retracement was bounded in the falling wedge (FW) pattern.
- The falling wedge pattern is a bullish reversal pattern.
- Price brokeout above the falling wedge's resistance as expected.
- This is a bullish signal.
- Price action is printing the double bottom neckline on pattern.
- The double bottom pattern is a bullish reversal pattern.
- The downtrend at the right bottom was resisted by the descending trendline resistance (DTR).
- Price brokeout above the descending trendline resistance.
- This is a bullish signal.
BUY ENTRY ⬆️
- Market price.
TARGETS 🎯
- Horizontal resistance level (R1) / Neckline resistance (NR).
- Horizontal resistance level (R2).
- Horizontal resistance level (R3).
- Fibonacci extension levels.
SETUP INVALIDATION ❌
- Initial invalidation : breakdown below the double bottom horizontal support level (S1).
- Final invalidation : breakdown below the 0.786 fibonacci retracement level.
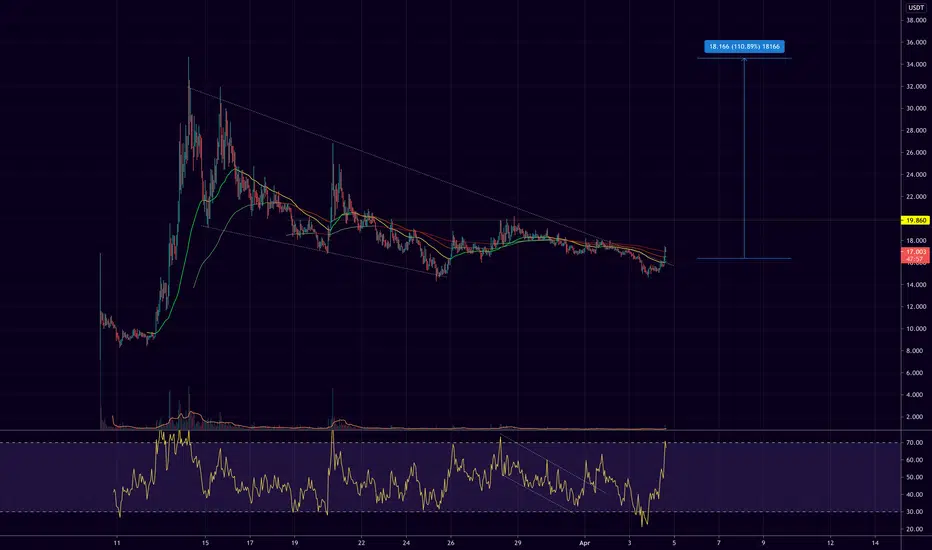
#DEGO has plenty to go$DEGO has still a lot to go, with that break out the way is up to previous top or for a new ath, min.110% potential with a great R:R, one of those alts you should get at this low.
DEGOUSDTDego Finance is a NFT+DeFi protocol and infrastructure with two functions: The project acts as an independent and open NFT ecosystem drawing users to the blockchain space. The NFT Suite offers services covering the full NFT lifecycle, enabling anyone to issue NFTs, participate in auctions, and trade NFTs.
Donation
We are a team scattered around the globe and decentralization is our cause. We are grateful to all supporters thus far. To help DEGO sustain and build better products, we have decided to accept donations and here is the address for incoming donations. The use of each donation will be made public on chain
ETH: 0x9Eb779Db80A0eA201EBa506b8708550B4BF633eF
BTC: 1Pv7yLWSsfj5FpJzornfaS9yhq3SBqbBVA
TRON: TGXvXcPZZofkkLYhE6hkXMTUj5cdKZYgp2
Polkadot: 13myyNpFTbmaDPh59EaBpQ4efodWk3GKKq5edK72dC9puFmH
Binance Smart Chain: 0x9Eb779Db80A0eA201EBa506b8708550B4BF633eF
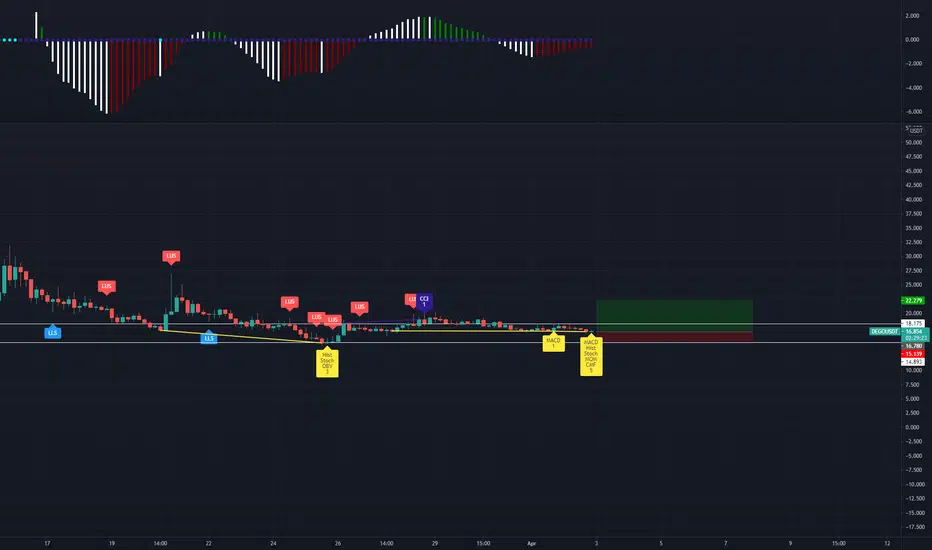
#DEGO when volume comes inOne of those coins that has not yet substantially pumped. DEGO setup is really nice sitting on that breakout retested and when volume comes in again this will give you a nice x to your bag.
entered here, dyor.
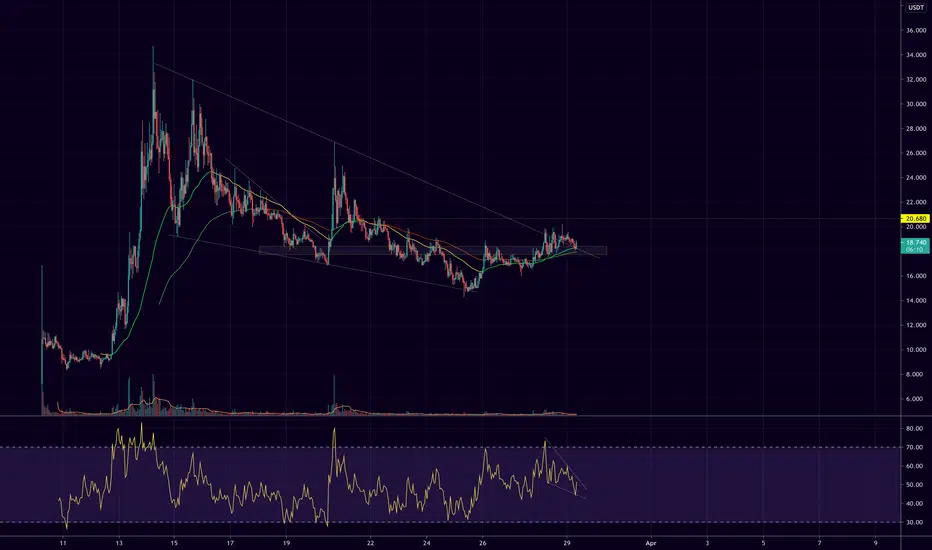
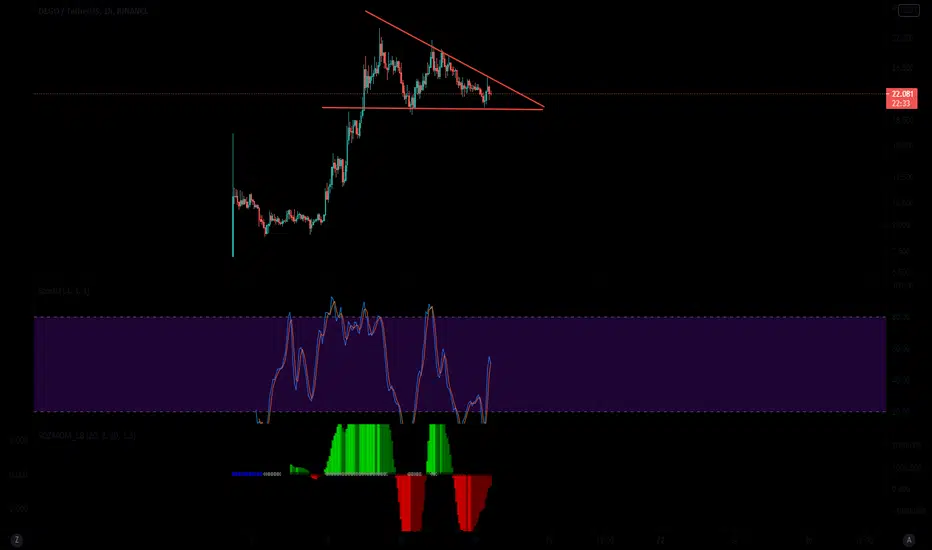
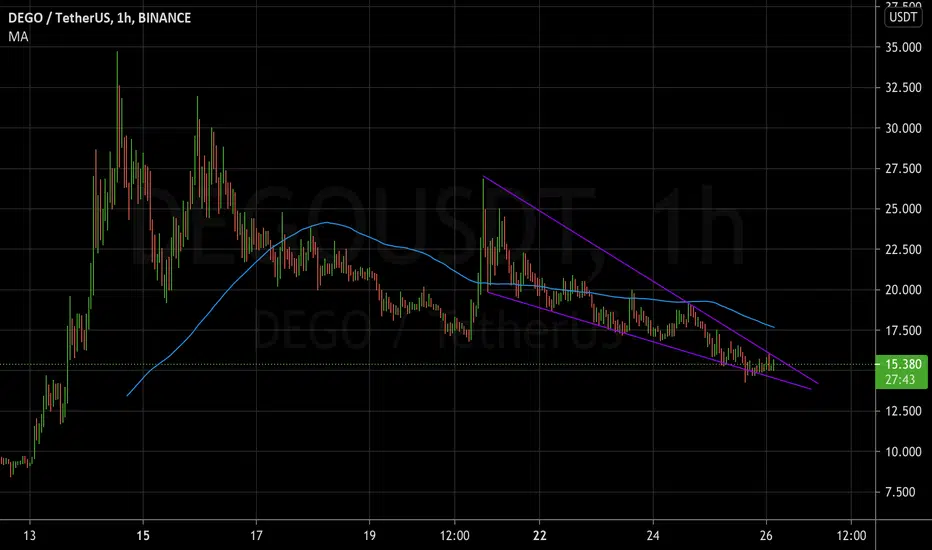
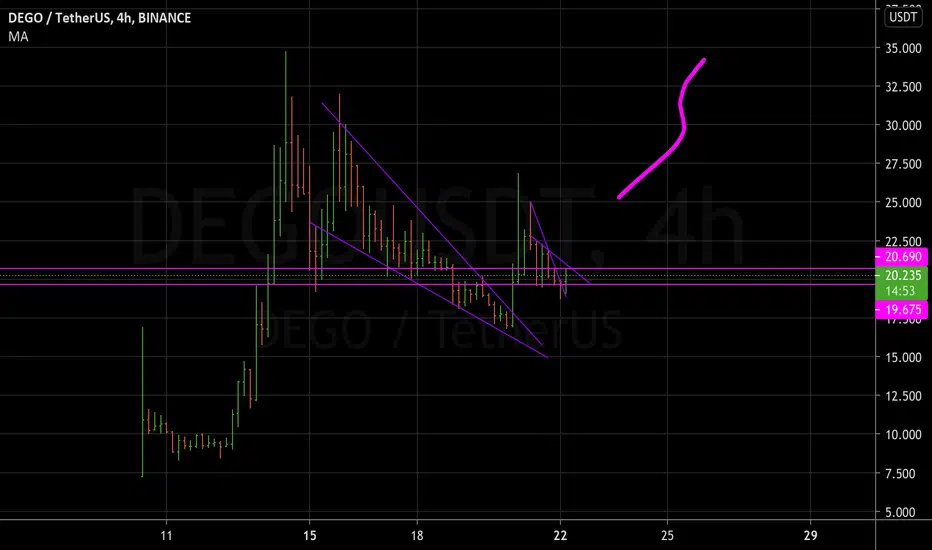
DEGOUSDT Waiting for the falling wedge breakoutDEGOUSDT (4H CHART) Technical Analysis Update
Waiting for the falling wedge breakout
DEGO/USDT currently trading at $17.80
Long Entry-level: only buy after the resistance line breakout
Stop loss: I will update once I see the breakout
Target 1: $24
Target 2: $30
Target 3: $35
Target 4: $40
ALWAYS KEEP STOP LOSS...
Follow Our Tradingview Account for More Technical Analysis Updates, | Like, Share and Comment Your thoughts.

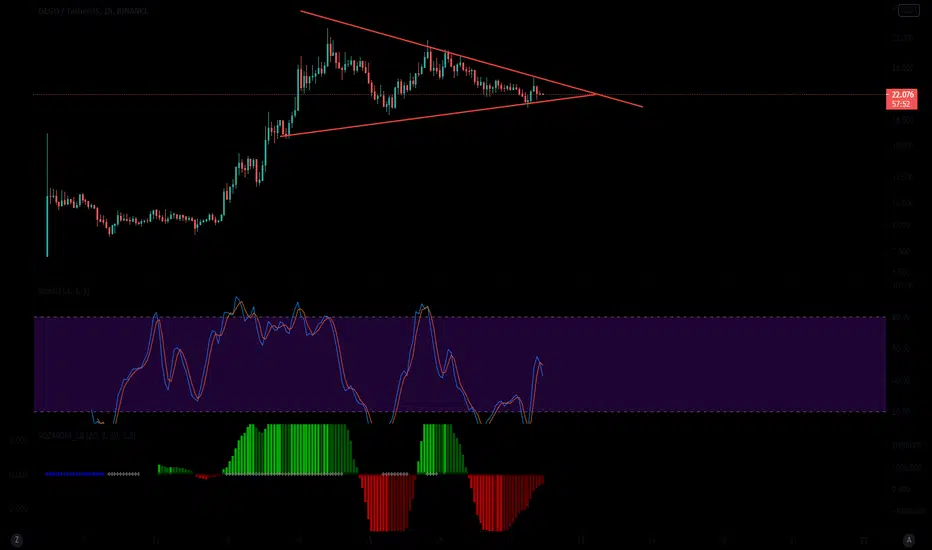
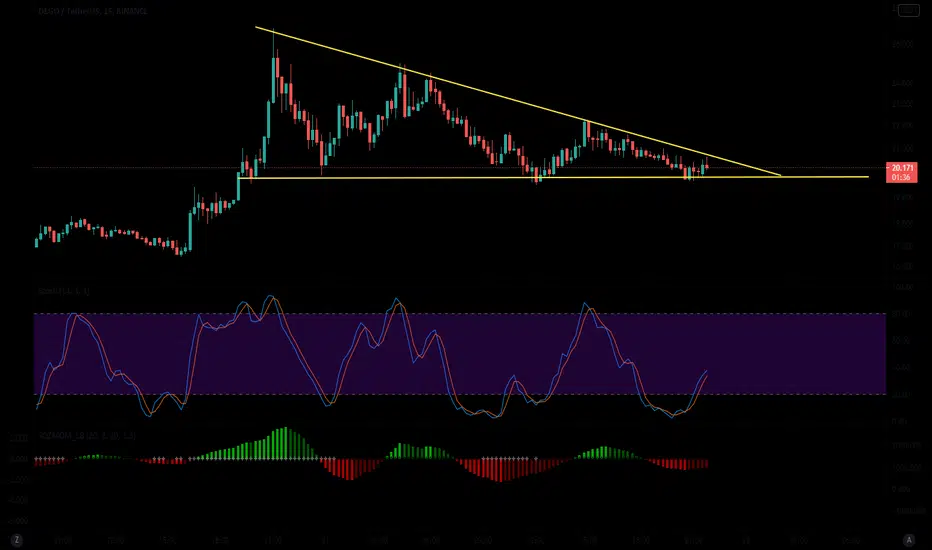
DEGO İS READY FOR BOUNCEDecreased triangle Re-test: Completed
Shoulder-Head-Shoulder: Completed
Short-Term Target: 23$
This is not financial advice, these are only my notes.

Worst days finished LONG NOWI know you are upset for investing dego but the worst part finished and now time to go up.
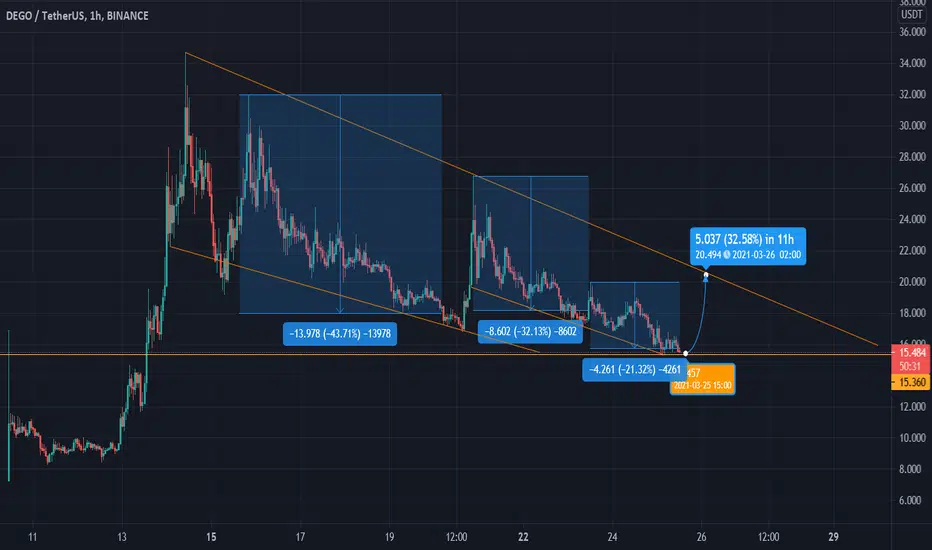
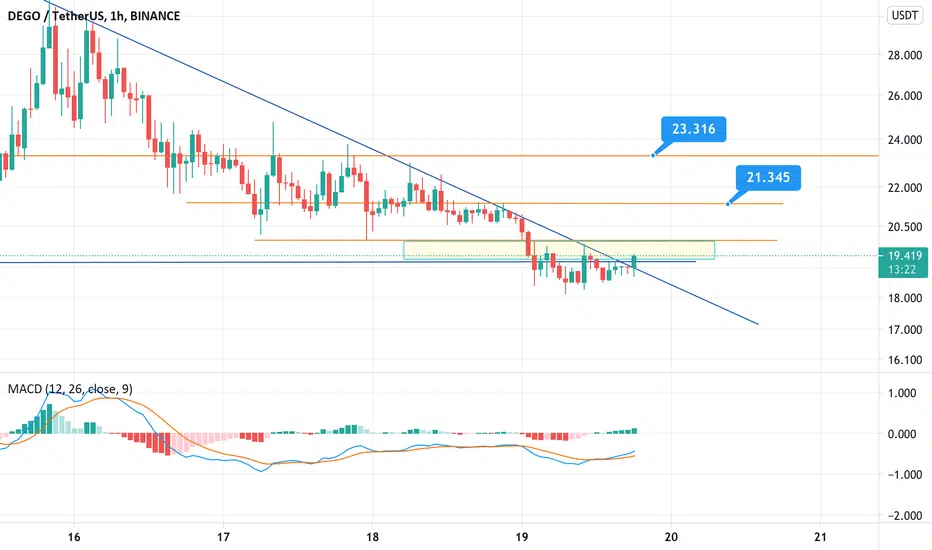
DEGO/USDT around 30% in 12hours...Hopefully have a nice bounce off the support line and retest the down trendline, 30%+ gains then i expect it to continue on a downward trajectory...
if botcoin suddenly pumps i can see this going to its last ATH.
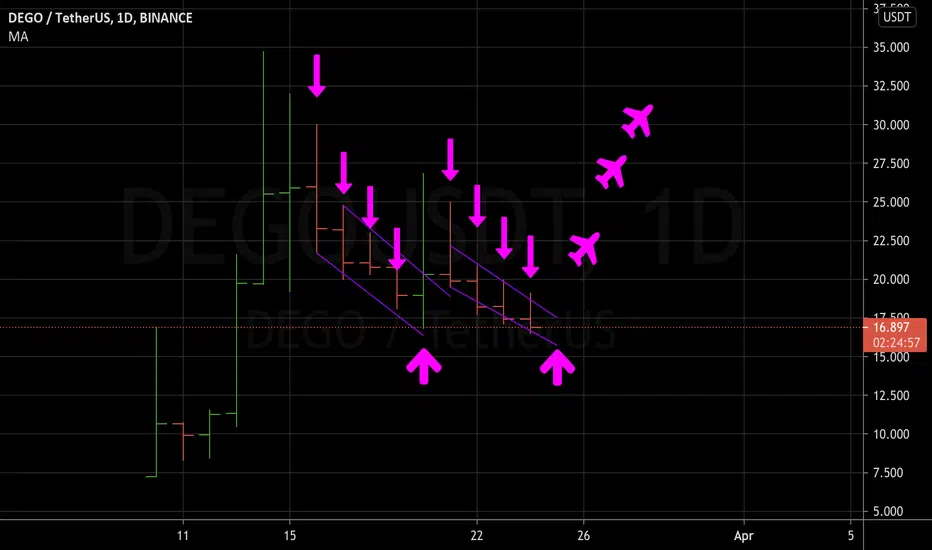
Be ready to fly ( Daily Chart)This is daily chart. Today is the 4th consecutive days of decresing, just like the last time.On fifth day it pumps. If it repeats the same pattern,tomorrow is the pump day.Main support is around 16,800.
Lets watch what will happen on March 26th.
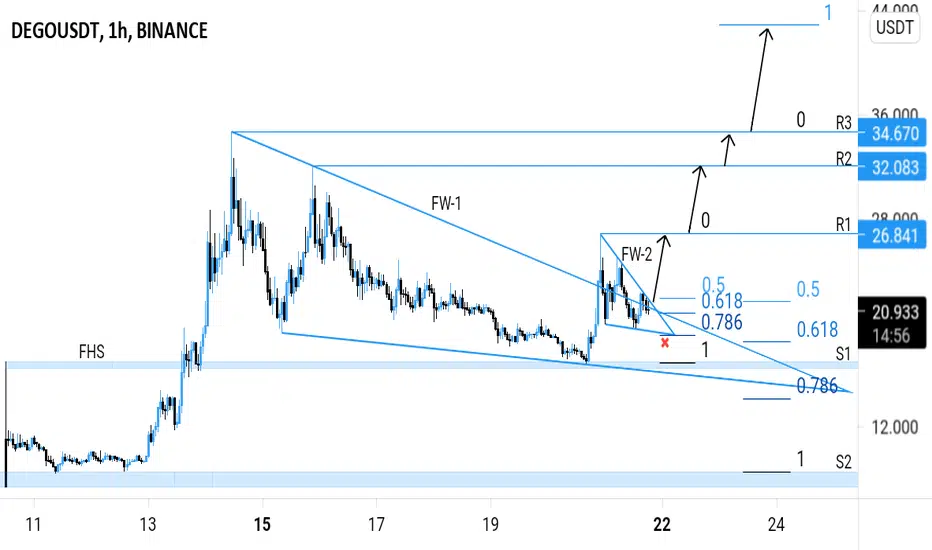
DEGOUSDT (DEGO FINANCE) - BUY ENTRY ANALYSIS 🔎
- DEGOUSDT hit an ATH and retraced.
- Price retested the flip horizontal support (FHS) and key fibonacci retracement zone (0.5 - 0.618 - 0.786).
- There was a relatively high concentration of buyers at the retest zone.
- The retracement was bounded in the falling wedge (FW-1) pattern.
- A falling wedge pattern is a bullish reversal pattern.
- Price brokeout above the falling wedge's resistance as expected.
- This is a bullish signal.
- The market is currently undergoing a minor retracement, testing the key fibonacci retracement zone (0.5 - 0.618 - 0.786).
- This minor retracement is bounded in another falling wedge (FW-2) pattern.
- There's a breakout potential
BUY ENTRY ⬆️
- Breakout above the falling wedge's (FW-2) resistance.
TARGETS 🎯
- Horizontal resistance level (R1).
- Horizontal resistance level (R2).
- Horizontal resistance level (R3).
- Fibonacci extension levels.
SETUP INVALIDATION ❌
- Breakdown below the falling wedge's support and 0.786 fibonacci retracement level.
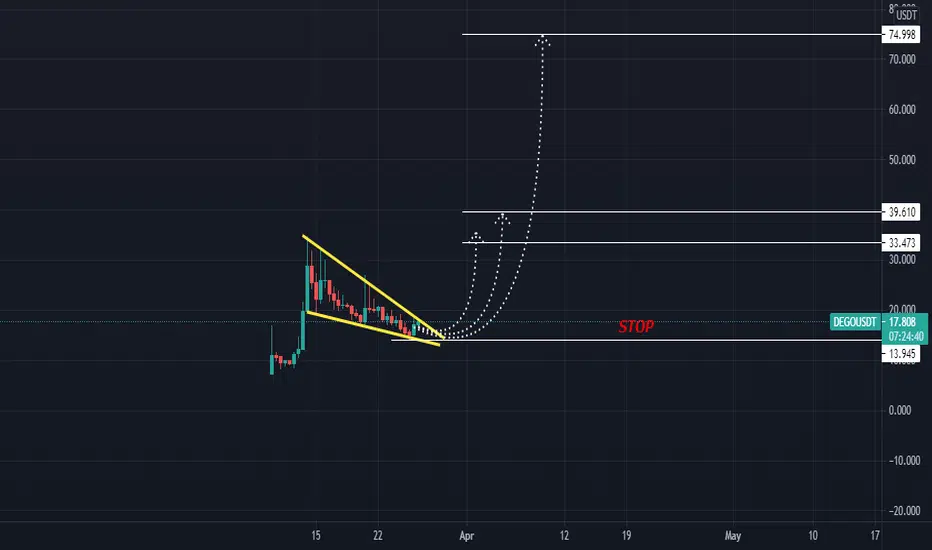
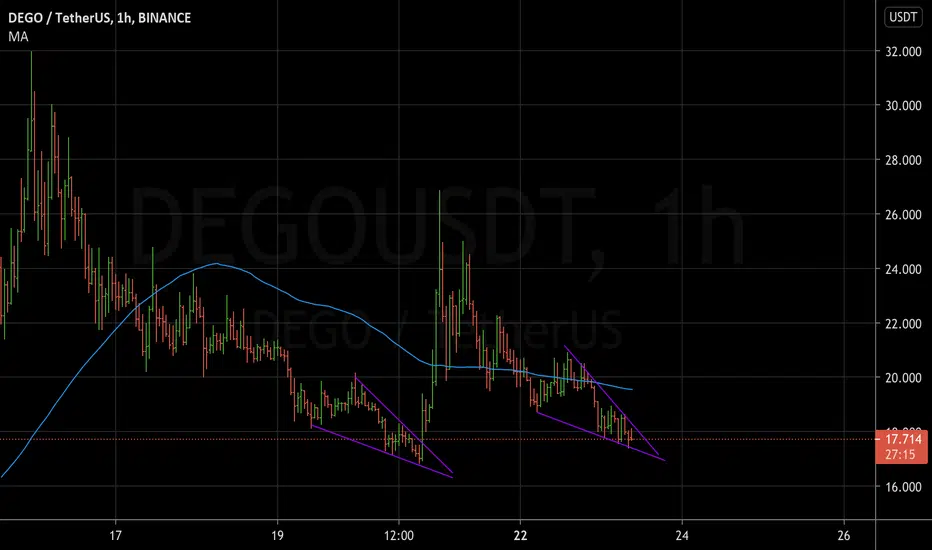
Bulls are Afraid....Jump is NearHello guys!
If we close a 1hour candle above the Yellow area, we must go to the prices on orange Lines!
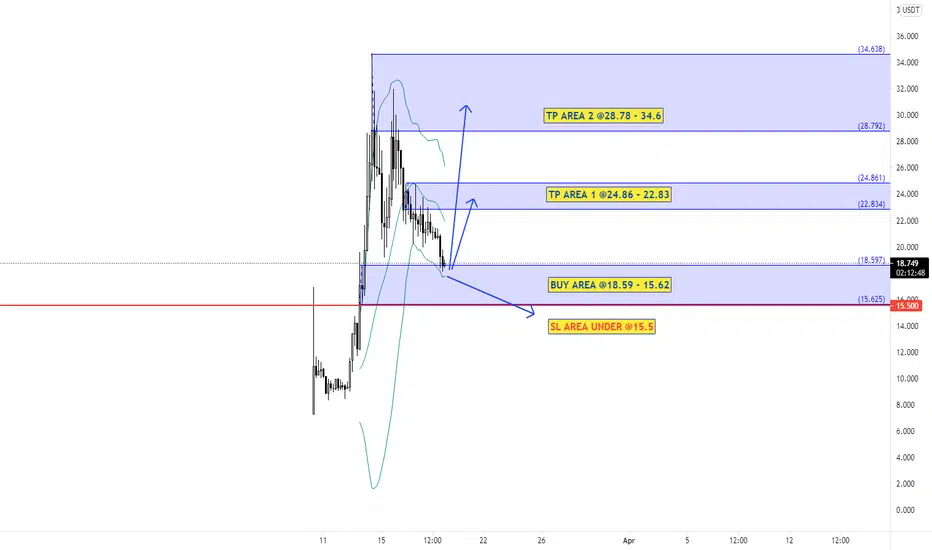
SIGNAL BUY AREA DEGO FINANCE (DEGO), IS IT BEST TIME TO BUY ???SIGNAL BUY AREA DEGO FINANCE (DEGO), IS IT BEST TIME TO BUY ???
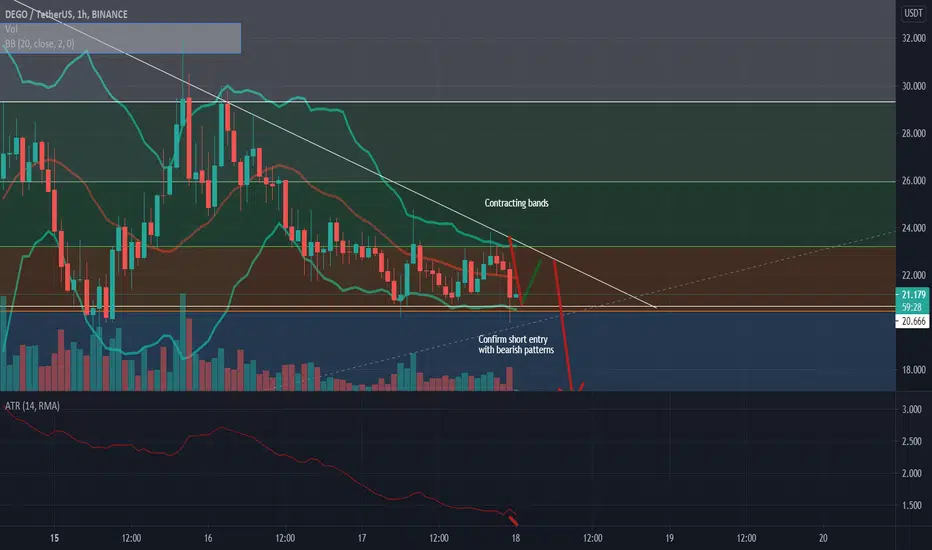
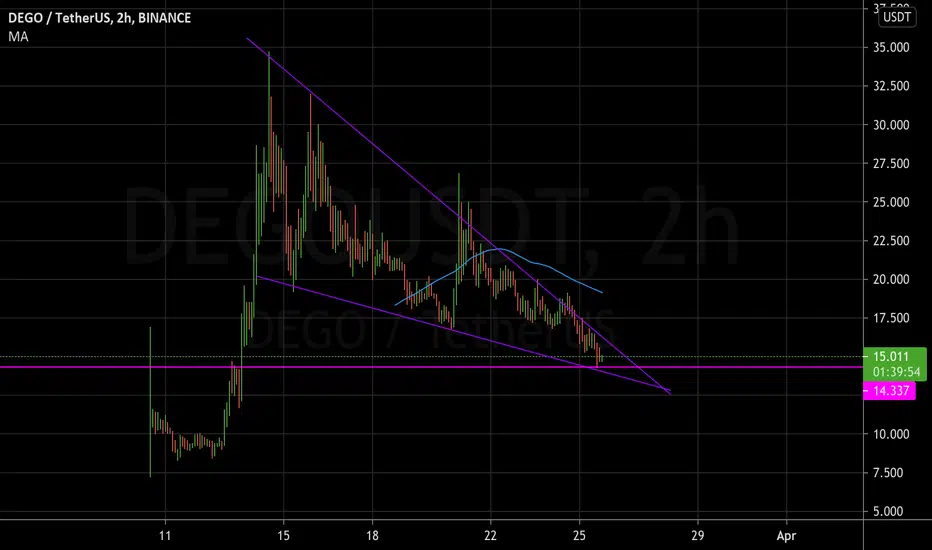
DEGO/USDT short and mid term setupDEGO/USDT pair has formed a double top on 1H timeframe.
The neckline is overlapping with the 0.618 retracement thus making it a key support
In short term, price is expected to move inside the triangle bouncing between 0.5 to 0.618 which gives a potential capture of 8-9%
Once ATR reaches low and bands contract even more lookout for a bearish pattern to enter a short position once 0.618 is breached.
You can even wait for price to re-test 0.618 before shorting