Analysis of DelhiveryTechnical Analysis
Price Action & Chart Patterns
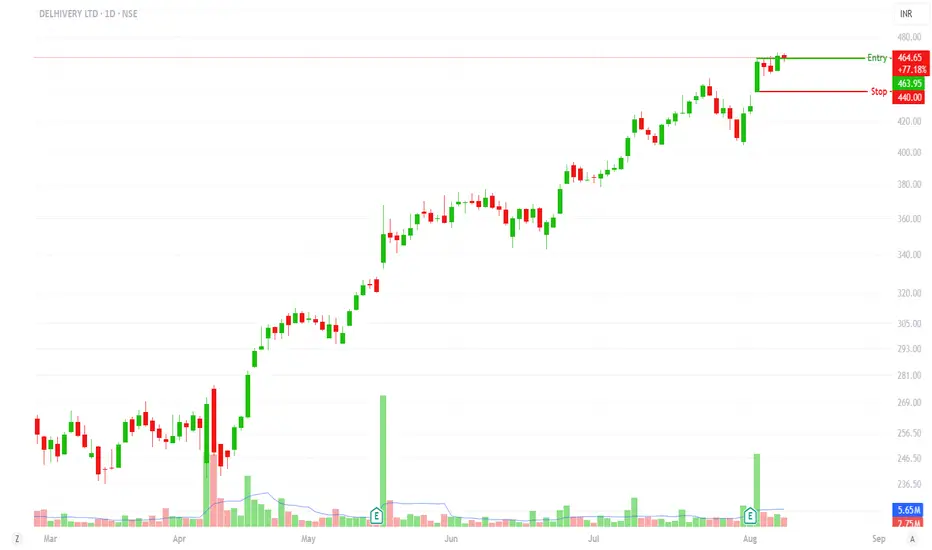
The attached chart shows Delhivery breaking out from a consolidation phase, with strong momentum since March 2025. Key technical observations:
Trend: Strong uptrend with higher highs and higher lows
Breakout: Clean breakout with volume confirmation
Current Position: Trading at 98.1% of 10-day range (₹409-₹466)
Risk Level: Well-defined at ₹440 (5.3% risk from current levels)
Support & Resistance Levels
Immediate Resistance: ₹468, ₹475, ₹485
Key Support: ₹440 (stop loss), ₹425, ₹409
52-Week Range: ₹237 - ₹468
Futures OI Insights
Current OI: 1.31 crore contracts (moderate levels)
Recent Trend: "Long Cover" on Aug 8, indicating profit booking by long positions
Peak OI: 1.46 crore on Jul 28 during aggressive long buildup
Interpretation: Healthy correction in OI after strong buildup, typical in trending markets
Options OI Analysis
Current PCR: 0.88 (moderately bullish)
PCR Range: 0.48 to 0.96 over the analyzed period
Call OI: 1.06 crore vs Put OI: 0.93 crore
Interpretation: Balanced positioning with slight call bias, supportive of upward movement
Risk Mitigation Strategies
Stop Loss: Strict adherence to ₹440 level
Position Sizing: Never exceed calculated position size
Profit Booking: Partial profits at ₹485, ₹500 levels
Trend Following: Exit if price breaks below ₹440 with volume
Price Targets with Risk-Reward
Target 1: ₹475 (2.2% return, Risk-Reward 1:0.42) - Conservative
Target 2: ₹485 (4.4% return, Risk-Reward 1:0.83) - Probable
Target 3: ₹500 (7.6% return, Risk-Reward 1:1.43) - Attractive
Target 4: ₹520 (11.9% return, Risk-Reward 1:2.25) - Optimistic
Ideal Position Size : 2% risk tolerance (₹20,000 max loss on ₹10L portfolio) = 811 shares for ₹3.77L investment.