Dell Stock Under Pressure as AI Costs Weigh on MarginsShares of Dell Technologies (NYSE:DELL) slipped in premarket trading following the company’s latest earnings report, which signaled potential margin compression in its fiscal 2026 outlook. The decline comes despite robust AI server growth projections, highlighting a complex landscape of opportunities and challenges for the tech giant.
Margin Compression and Tariff Uncertainty Weigh on Sentiment
Dell's financial outlook raised investor concerns as the company forecasted a 100 basis-point decline in adjusted gross margins for fiscal year 2026. This pressure stems largely from rising costs associated with AI server expansion and soft PC demand, which continues to be a headwind.
AI Growth Provides a Silver Lining
Despite the margin headwinds, Dell remains a major player in the AI infrastructure space, forecasting an impressive 53% year-over-year surge in AI server shipments to $15 billion.
Earnings Beat But Revenue Miss
For the fourth quarter, Dell reported:
- Adjusted EPS of $2.68, exceeding estimates of $2.53 per share.
- Revenue of $23.93 billion, slightly below the expected $24.56 billion.
- Forecasted Q1 adjusted EPS of $1.65, below analyst estimates of $1.83.
- Projected revenue between $22.5 billion and $23.5 billion, missing expectations of $23.72 billion.
- Full-year 2026 adjusted EPS expected to be $9.30**, slightly above consensus at $9.29.
Technical Outlook
NYSE:DELL stock closed down 6.26% in Thursday’s session and extended losses in Friday’s premarket trading, currently down 2.23%. The Relative Strength Index (RSI) sits at 41.16, reflecting a weak technical setup.
If the post-earnings sentiment worsens, Dell’s 1-month low could serve as a critical support pivot. Conversely, a break above the 38.2% Fibonacci retracement level could signal a bullish reversal, paving the way for a potential rebound.
Dellsignals

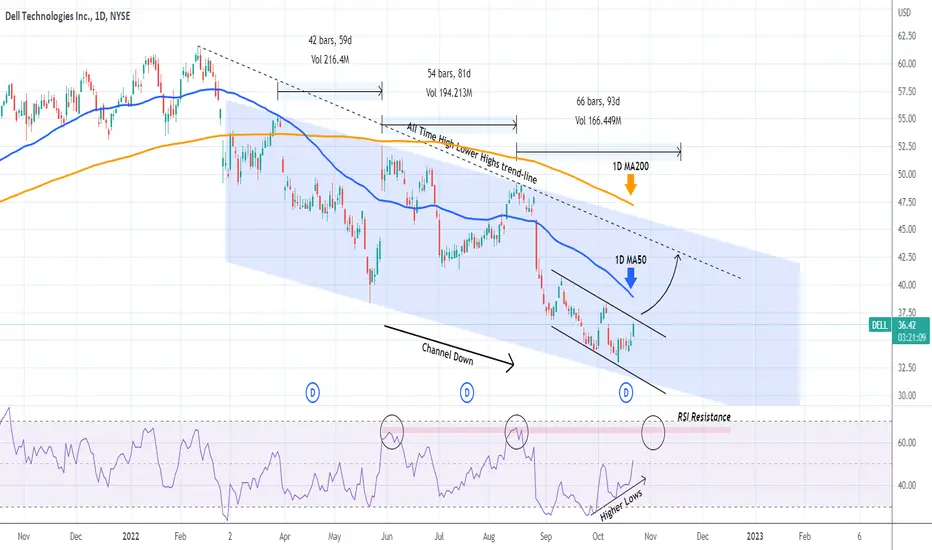
DELL Excellent buy opportunity on the break-outDell Technologies (DELL) is testing the top (Lower Highs trend-line) of the short-term Channel Down that started after the September 12 High. The 1D MA50 (blue trend-line) is right above it, all within the wider pattern of the long-term Channel Down since the March 29 rejection on the 1D MA50.
However, while the price was on the Channel Down's Lower Lows, the 1D RSI has been on Higher Lows since September 27, waving a Bullish Divergence. As we just bounced near the bottom (Lower Lows trend-line) of the long-term Channel Down, it is highly likely that we will extend the rebound and hit at least the All Time High Lower Highs trend-line (dashed). A good time to take profit and re-evaluate would also be when the RSI hits its 4 month Resistance Zone.
-------------------------------------------------------------------------------
** Please LIKE 👍, SUBSCRIBE ✅, SHARE 🙌 and COMMENT ✍ if you enjoy this idea! Also share your ideas and charts in the comments section below! This is best way to keep it relevant, support me, keep the content here free and allow the idea to reach as many people as possible. **
-------------------------------------------------------------------------------
You may also TELL ME 🙋♀️🙋♂️ in the comments section which symbol you want me to analyze next and on which time-frame. The one with the most posts will be published tomorrow! 👏🎁
-------------------------------------------------------------------------------
👇 👇 👇 👇 👇 👇
💸💸💸💸💸💸
👇 👇 👇 👇 👇 👇