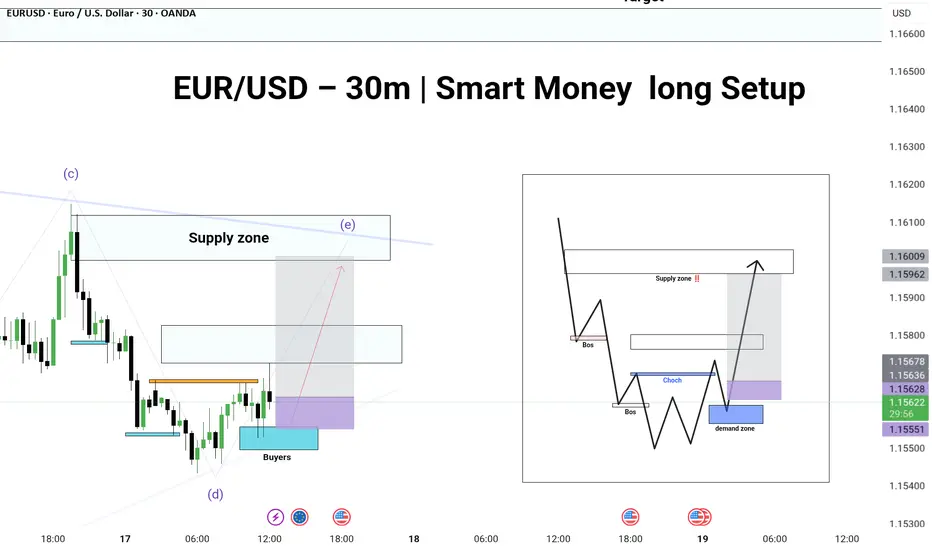
EUR/USD – 30m | Smart Money long SetupPair: EUR/USD
🔹 Timeframe: 30-Minutes
🔹 Confluence Strategy: Elliott Wave + Smart Money Concepts (SMC)
🔹 Pattern: Ending Triangle (Wave e) + CHoCH + BOS
🔹 Published on: June 17, 2025
---
🧠 Analysis Summary:
1. Wave (e) of triangle nearly complete — signs of liquidity grab at the low.
2. CHoCH formed after internal structure break – a bullish signal.
3. Demand zone successfully mitigated, showing buyer reaction.
4. BOS confirms intent to shift bullish structure.
5. Clear imbalance/fair value gap filled before move.
---
🎯 Next Move Projection:
Entry Zone: 1.1562–1.1565 (Demand Area)
Target: 1.1596–1.1600 (Supply Zone Resistance)
Invalidation: Clean break below 1.1555 low (demand fails)
---
📌 Trade Bias:
✔️ Bullish — Expecting price to tap into supply zone and potentially reverse.
⚠️ Monitor lower timeframes (5m–15m) for rejection signs near 1.1600.
Demand Zone
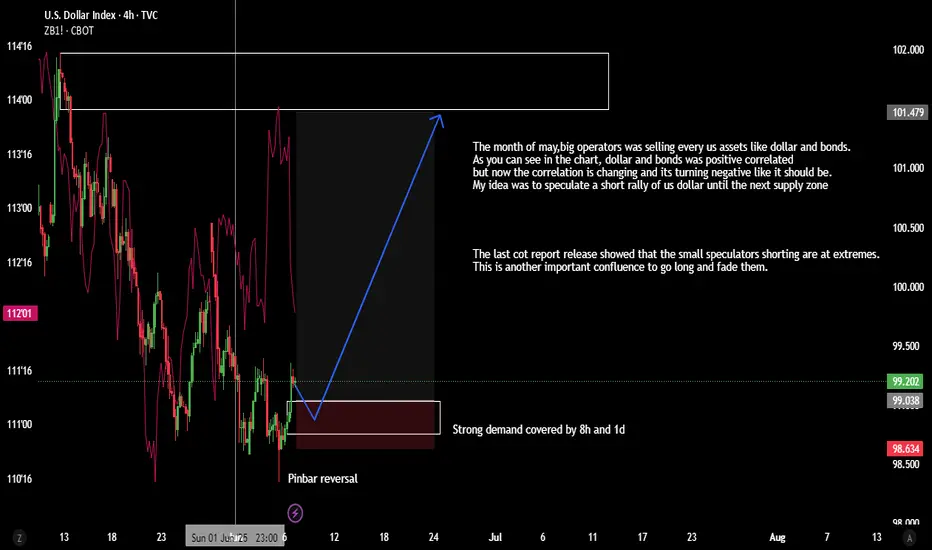
Buy Idea on Us Dollar Index (Dxy)Based on :
- Demand zone
- Pin bar Reversal
- Changing of correlation between dxy and zb1!
- cot report

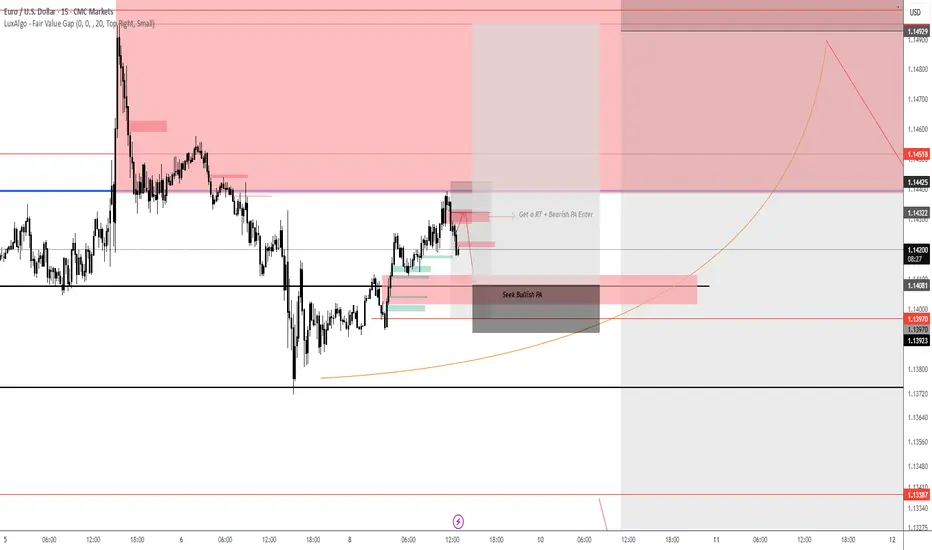
EURUSD Interim Short Active, Looking for the LongInterim short active from our analysis posted last night, rejected off the lower end of the supply zone highlighted. Looking for the trade to trade down to a good Demand level to then take this trade up to the higher levels of the supply zone. Targeting the 1.1500 region. This will be all dependent on price action. If price moves to plan and 1.1500 is achieved we then can look for the original short position highlighted in last nights analysis.
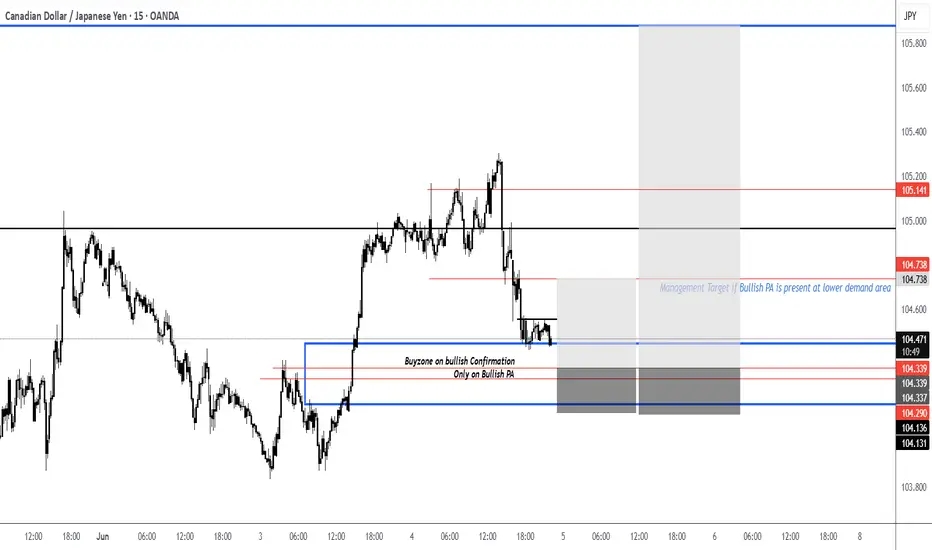
CADJPY UpdateAs anticipated, price has rejected the horizontal level and is now pulling back into a key demand zone on the H1–H4 timeframe.
I’m watching this area closely for bullish confirmation to take a long position toward the upper target zone. If bullish price action does not appear and bearish momentum continues, we could see an extended move down toward the weekly 100.00 level.
That said, I currently favor the upside scenario, with the expectation that the highlighted upper zone will be met — but only if the market confirms.
This setup is still theoretical. Patience is key — we trade based on confirmation, not assumption. Stay tuned for updates.
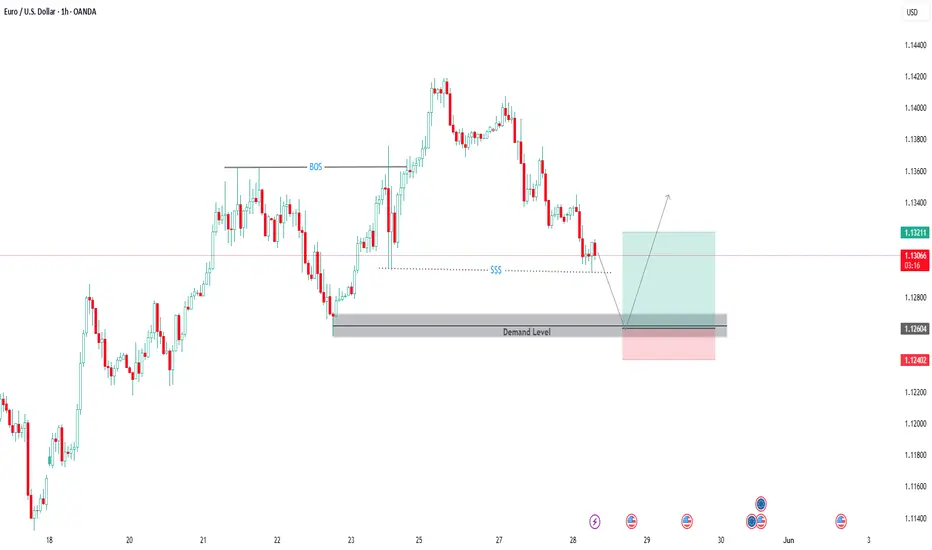
EUR USD Trade Setup 1 hour timeframe EUR USD has formed a demand level around price 1.12600 and the market is slowly approaching this level, we need to wait for price to tap on the demand zone before making any trading decisions.
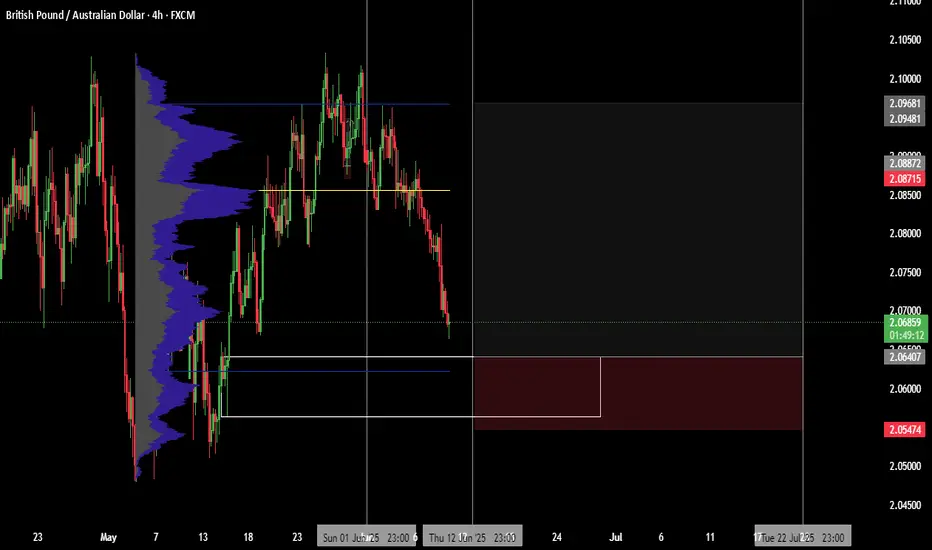
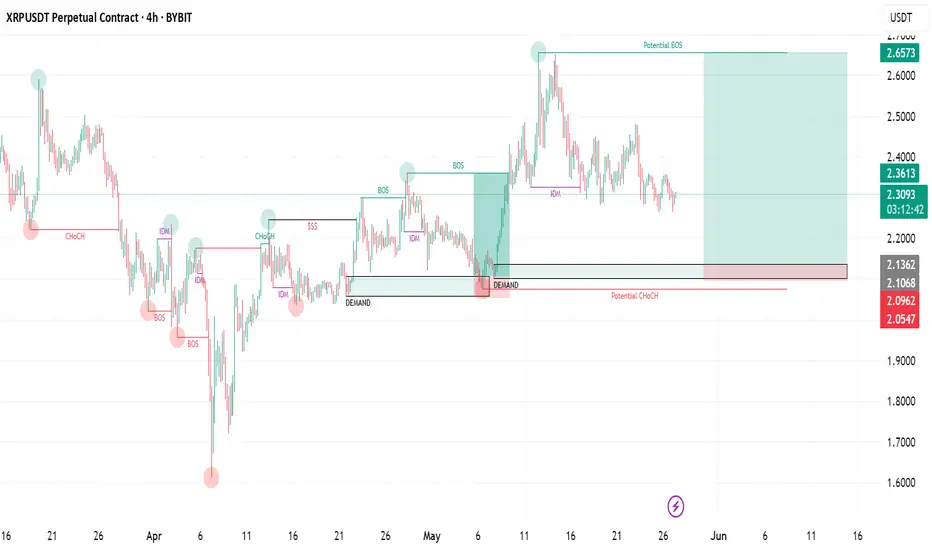
XRPUSDT 4H | Untested Demand Zone RevisitIn this 4-hour chart analysis of XRPUSDT, I’m focusing on a clear and well-defined untested demand zone between 2.05–2.13 USDT . Unlike the first demand zone (already tested and played out), this second zone has not been retested since its formation, making it a fresh area of interest for a potential long setup.
Why this matters :
Untested demand zones often act as powerful magnets for price when revisited, as they represent areas where large buy orders might be waiting to be filled. Because this zone has not been revisited yet, there’s a higher probability for a bullish reaction when price returns to it.
Key Technical Factors :
✅ The 2.05–2.13 demand zone was formed following a significant bullish impulse that created a clear break of structure to the upside.
✅ Price is currently consolidating above this demand zone and also above a potential bearish CHoCH at 2.0784 . This suggests that the bullish structure is still valid unless price breaks below 2.0784.
✅ My bullish target is 2.65 USDT , where previous highs were formed and potential liquidity exists.
✅ My stop loss is set just below the demand zone, around 2.05 , to protect against a deeper retracement or a shift in market structure.
My Thought Process :
I expect that if price returns to the demand zone, there will be a strong chance for buyers to step in and push the market higher. However, I’m aware that if price breaks below 2.0784 , it would signal a bearish CHoCH and invalidate the long scenario. Therefore, patience is key — I’ll wait for price to either test the zone and react strongly or stay above 2.0784 to keep the bullish bias intact.
Clear Trade Setup :
📌 Entry Zone : 2.05–2.13
🛑 Stop Loss : Below 2.05
🎯 Take Profit : 2.65
🧩 Invalidation : Break below 2.0784
💬 Let me know if you have a similar zone marked out or if you see a different setup! Let’s share ideas and refine our strategies together.
Cardano (ADA) Rectangle + Internal Uptrend (1D)BINANCE:ADAUSDT has spent months ranging between ~$0.51 and ~$1.15, and the structure now clearly qualifies as a rectangle pattern.
After a 3rd touch on support in April, Cardano is showing strength with steady higher lows and a reclaim of a key High Volume Node (HVN).
Key Levels to Watch
• Main Demand: ~$0.51-$0.58
• Rectangle Support: ~$0.51
• Rectangle Resistance: ~$1.15
• Internal Uptrend Support: Rising diagonal from April
• HVN Zone: ~$0.75 — key volume cluster
• Rectangle Midline: ~$0.83 — also a previous S/R
• Main Supply: $1.10–$1.32
Measured Target
If price breaks above $1.15 with volume, the rectangle measured move points to ~$1.80.
Context
ADA has respected this range for nearly half a year. A breakout could mark the start of a macro bullish leg.
Triggers
• Bullish: Clean daily close above $1.15 with volume → $1.80 target activated. For a safer entry, it could be worth waiting a full breakout from the main supply above $1.32.
• Bearish: Breakdown of the ascending trendline and HVN → Potential return to ~$0.51. Failure to hold that level could lead to further downside to the previous ~$0.30 demand zone.

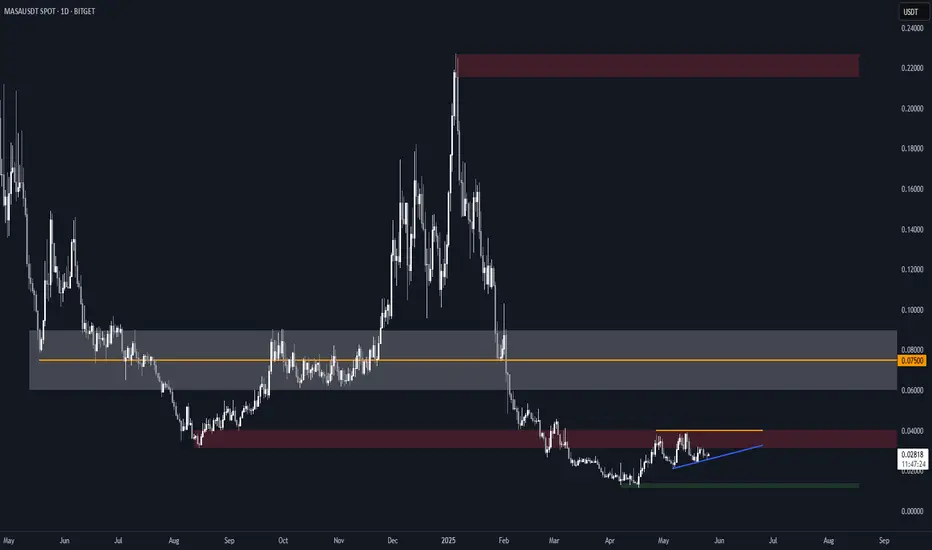
MASA Ascending Triangle (1D) + Key LevelsBITGET:MASAUSDT is currently forming an ascending triangle on the daily chart, with horizontal resistance around $0.040 and rising support.
This structure typically leans bullish and suggests accumulation under resistance.
Structure & Zones
• Resistance: ~$0.040 (triangle top, within flipped demand → supply zone)
• Support: Rising diagonal since early May
• Demand: ~$0.013
• Main Supply: $0.06-$0.09 (High Volume Node, with $0.075 as a key S/R)
Breakout Target
A breakout with strong volume could trigger a measured move toward ~$0.060, aligning with the lower boundary of the High Volume Node (HVN) and the previous price cluster.
Context
The grey $0.06-$0.09 HVN has acted as a pivotal area — both as support and resistance — and could become the next key level if price breaks out.
Triggers
• A clean daily close above $0.040 with volume would be a strong bullish signal
• A breakdown below the ascending support would invalidate the pattern and likely lead to a retest of ~$0.013
NIFTYi Observed these Levels based on Price Action and Demand & Supply which is my own Concept "PENDAM CONCEPTS"... Please don't take any trades based on this chart/post... Because this chart is for educational purpose only not for Buy or Sell Recommendation... Thank Q

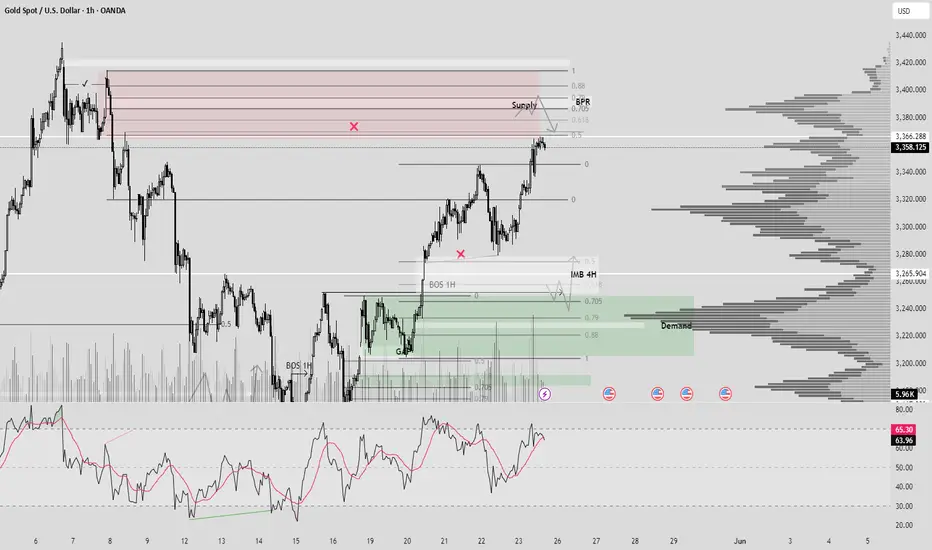
XAUUSD (BPR + SUPPLY + VOLUME + OTE)Hello traders!
1) Price come back to our demand zone, and for me 0.5 Supply still strong zone for selling +BPR 1H + Volume + OTE. RSI in oversold.
2) Also we have open BOS 1H + Demand 0.5 + Volume + Close IMB + OTE.
Have a profitable day and don't forget to subscribe for updates!
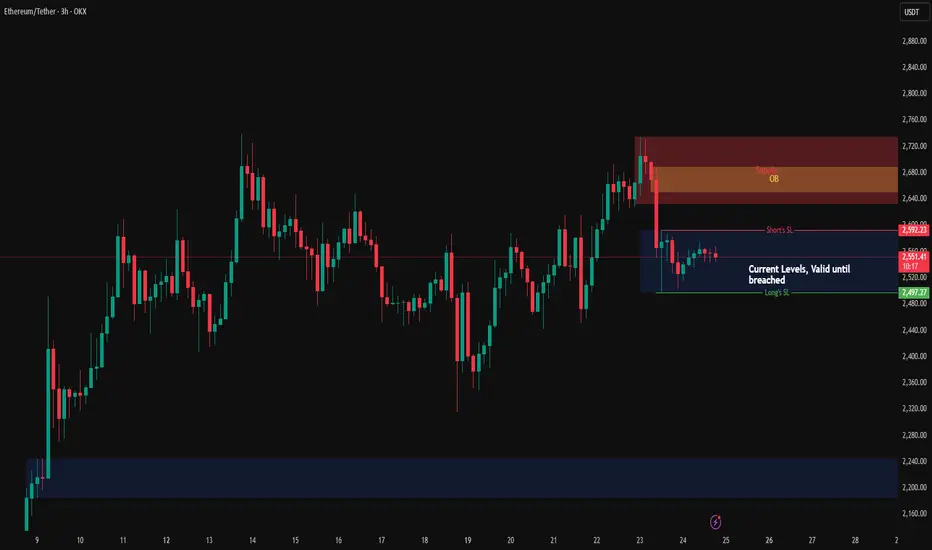
ETH Weekend/next week levelsETH plan for the weekend (24-05-2025 to 25-05-2025) and following week with focus on FOMC minutes on 28th May.
Current zone marked offers long/short SL's if anyone wants to trade within current zone on LTF.
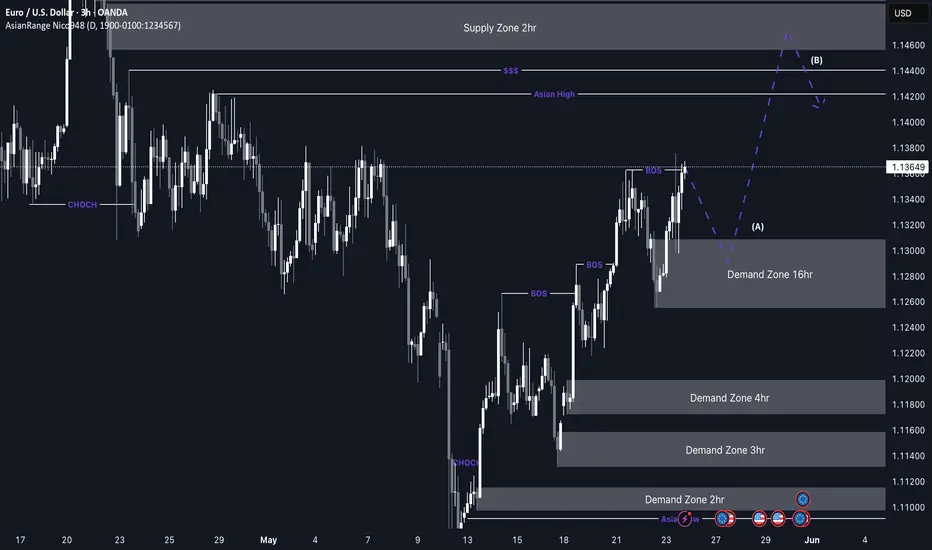
EUR/USD pro trend idea from 1.13000EUR/USD Weekly Outlook – Pro Trend Setup in Focus
My outlook for EUR/USD this week aligns closely with my GBP/USD analysis, as both pairs tend to move in a similar direction. For EU specifically, price is currently much closer to a valid demand zone, making the pro-trend continuation idea more likely in the short term.
After the recent break of structure to the upside, price left behind a well-defined 16H demand zone, which could serve as the base for another bullish rally. There’s also a significant buildup of liquidity above and no major nearby supply zone, so for now, I’ll be focusing solely on pro-trend long setups.
If price doesn’t retrace as deep as the 16H demand zone and continues pushing higher, I’ll be on the lookout for a new demand zone to form that we can then trade from.
Confluences for EU Buys:
- Price is nearing the 16H demand zone that caused the most recent break of structure
- Strong bullish momentum on the higher timeframes
- Clean liquidity above that remains untapped
- DXY continues to move bearish, aligning with a bullish EU outlook
P.S. I’ll be watching for an initial pullback during the Asia session to see how price interacts with the 16H demand. Stay alert and trade smart — let the market come to your zones.
Have a great trading week, everyone! 🔍📈
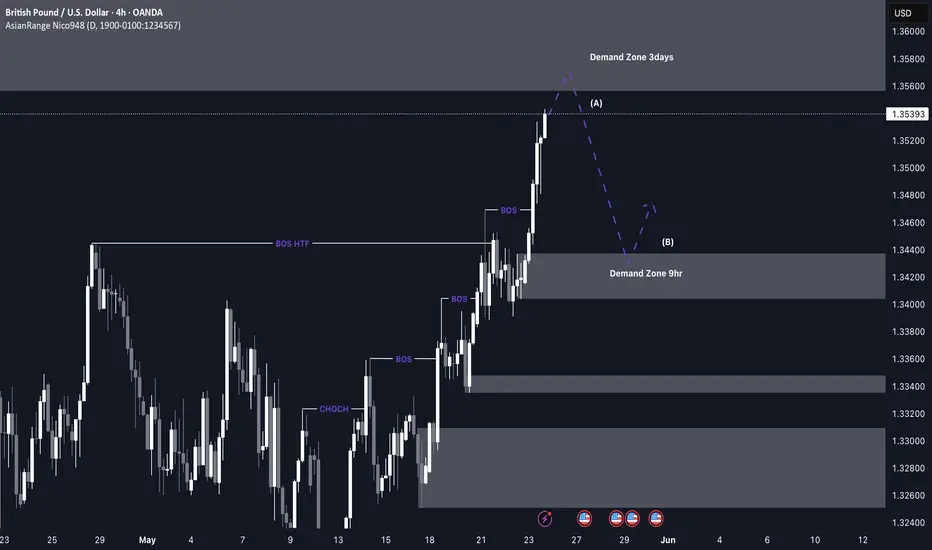
GBP/USD bullish run still going?This week’s analysis for GU is centred around the current pro-trend momentum and where we could see potential entries to continue riding it.
To begin with, there’s a refined 3D supply zone located at a premium level which could cause a short-term bearish reaction. I’ll be monitoring this area for any possible short setups — but only with strong confirmation.
However, the overall structure remains predominantly bullish, as shown by a series of higher highs and higher lows, along with significant breaks of structure. The most relevant point of interest for a bullish continuation sits around the 1.34200 level, where a clean 9H demand zone resides. This is where I’ll be looking to enter long positions if price retraces to that area.
Confluences for GU Buys:
- Clear formation of higher highs and higher lows, confirming bullish structure
- Strong 9H demand zone that initiated the recent break of structure
- Liquidity above still yet to be cleared
- DXY remains bearish, supporting continued bullish momentum on GBP/USD
P.S. Don’t get too caught up chasing countertrend moves. The real edge lies in identifying the nearest POI that aligns with the overall trend and waiting for your setup to unfold there.
NZDCAD | Strong Demand Zone DetectedIf we look at the daily chart for NZDCAD we can see a strong demand zone forming. This level will make a good target for order flow.
Typically, you want to wait for price to reach this level and take a long. However, you can also use this as a higher timeframe orderflow bias. But keep in mind you'll be lowering your odds of success compared to the long.

PEAQ — Fibonacci Meets Wyckoff Structure +100% SetupAfter more than 70 days of sideways action, PEAQ is finally showing signs of life — with a well-defined structure that suggests accumulation is giving way to a potential new trend.
What we’re seeing aligns closely with a classic Wyckoff Accumulation pattern. A local bottom formed around the psychological $0.10 level, followed by a clean breakout — marking a potential Sign of Strength (SOS).
Now comes the real opportunity.
Wyckoff Accumulation Structure
Following the long consolidation range:
🔹 Phase D: Breakout from range = Sign of Strength (SOS)
🔄 Current: Pullback = potential Last Point of Support (LPS)
The recent correction has now retraced into the 0.786 Fib zone of the impulse wave — a deeper but still healthy retracement for Wyckoff structure. Notably, this level also coincides with the previous highs that PEAQ broke out from, now flipping into support. A perfect test of demand.
🔍 Confluence Zone Breakdown
0.786 Fibonacci retracement: ~$0.1312
Previous highs: ~$0.14
Monthly open: $0.1289 (ideal invalidation level)
These overlapping signals create a tightly packed support zone that defines the next high-probability long setup.
🟢 Long Setup — 0.786 ($0.1312)
Entry: $0.1312
Same stop-loss: $0.125 (below mOpen)
Targets: $0.2589 and 1.618 Trend-Based Fib Extension target at $0.2694
R:R: ~16:1+
Potential upside: +100%+
📘 Educational Insight: Wyckoff Meets Fibonacci
This setup is a combination of Wyckoff theory and Fibonacci structure:
SOS breakout signals strength
LPS pullback into 0.786 Fib = high-probability continuation zone
Previous highs now acting as support
When structure, confluence, and psychology align — you don't chase. You wait.
📌 Summary
✅ 70+ days of accumulation
✅ SOS confirmed
🔁 Now retracing to LPS around $0.131
🔒 Monthly open provides clear invalidation
🎯 Targets: $0.2589 and $0.2694
💰 Potential R:R: 16:1+
Each chart is a lesson. Read it with patience, trade it with purpose.
___________________________________
If you found this helpful, leave a like and comment below! Got requests for the next technical analysis? Let me know.

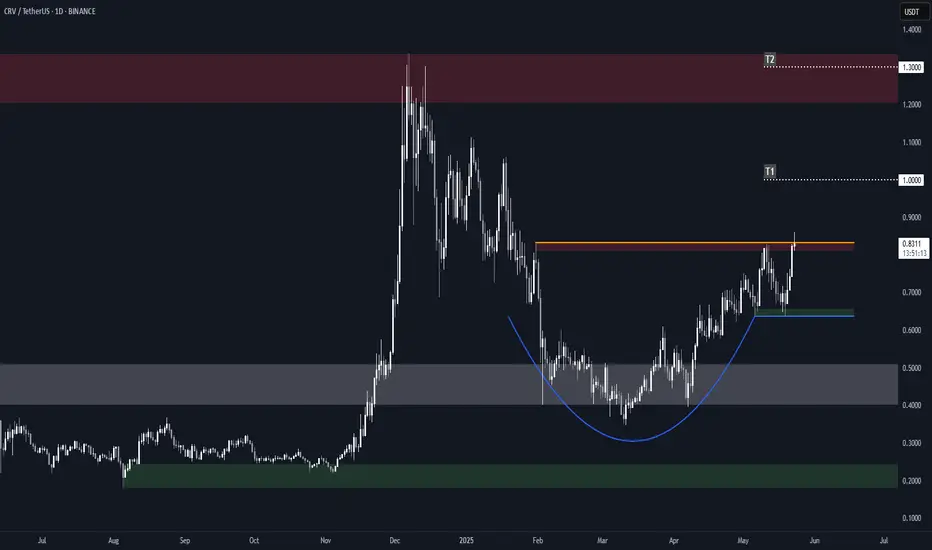
Curve (CRV) Structure Analysis (1D)BINANCE:CRVUSDT formed a rounded bottom (cup) and a minor rectangle, and it's currently attempting to break above the local $0.83 resistance.
Key Levels to Watch
• $0.64: Current support and minor rectangle lower boundary
• $0.83: Current resistance, cup and rectangle upper boundary
• $1.00: Measured target from the minor rectangle pattern
• $1.30: Measured target from the cup pattern (within a key supply zone)
Other Important Levels
• $0.20: Key demand zone, and 2024 low
• $0.40-$0.50: Key S/R dating back to November 2022, aligned with the cup bottom
• $1.20-$1.30: Main supply zone, dating back to February 2023
A daily close above $0.83 with volume would confirm the breakout and trigger the targets.
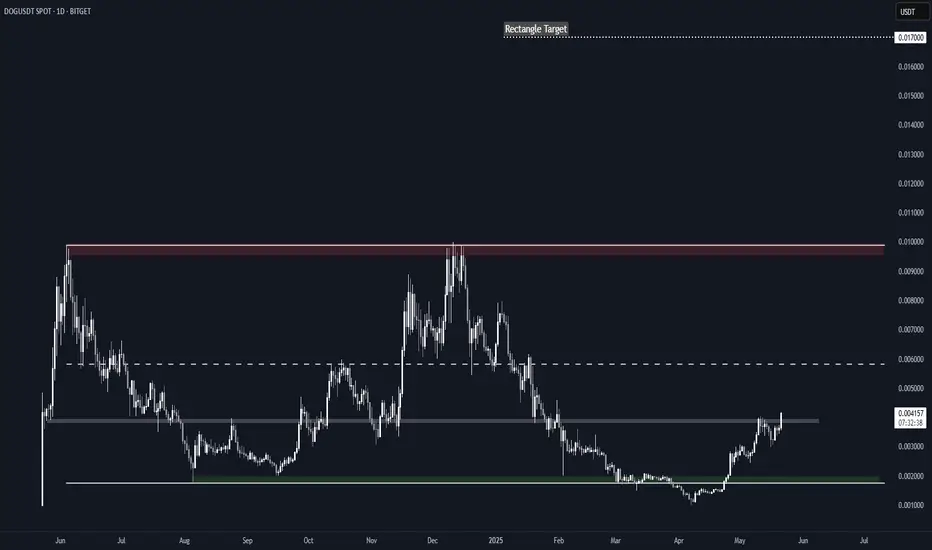
DOG Rectangle + Structure AnalysisBITGET:DOGUSDT has been trading in a rectangle since June 2024, with well-defined boundaries.
After a downside deviation in March, it managed to reclaim the range and it's now attempting to break above $0.0040, a key S/R throughout its price history.
Key Levels to Watch
• $0.0018-$0.0020: Main demand zone
• $0.0040: Key S/R in place since May 2024
• $0.0058-$0.0060: Rectangle midline and previous S/R
• $0.0095-$0.0099: Main supply zone
• $0.0170: Measured rectangle target in case of a breakout
A successful daily close above $0.0040 should set the next target around ~$0.0060. Above that, there isn't much separating DOG from another retest of the main demand zone and ATH.
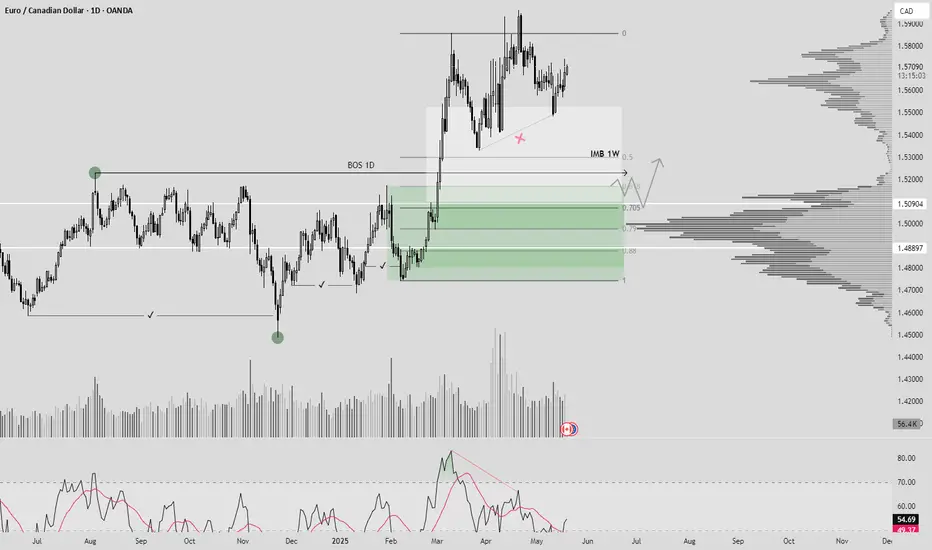
EURCAD (BOS 1D + Demand + OTE + Volume + OrderFlow)Hello traders!
As you can clearly see OF, daily structure(BOS 1D), expecting reversal from OTE zone. Alarm on 618 Fib level. In this moment we see divergence(also possible 3 tops). Price build liquidity to come back to our POI.(DEMAND)
Have a profitable day and don't forget to subscribe for updates!
AUDUSD (MSS + DEMAND + OTE)Hello traders!
My setup: MSS + DEMAND + 705 FIB
Target: till first problematic zone(BOS 1H)
Entry: Through confirmation on LTF
Have a profitable day and don't forget to subscribe for updates!

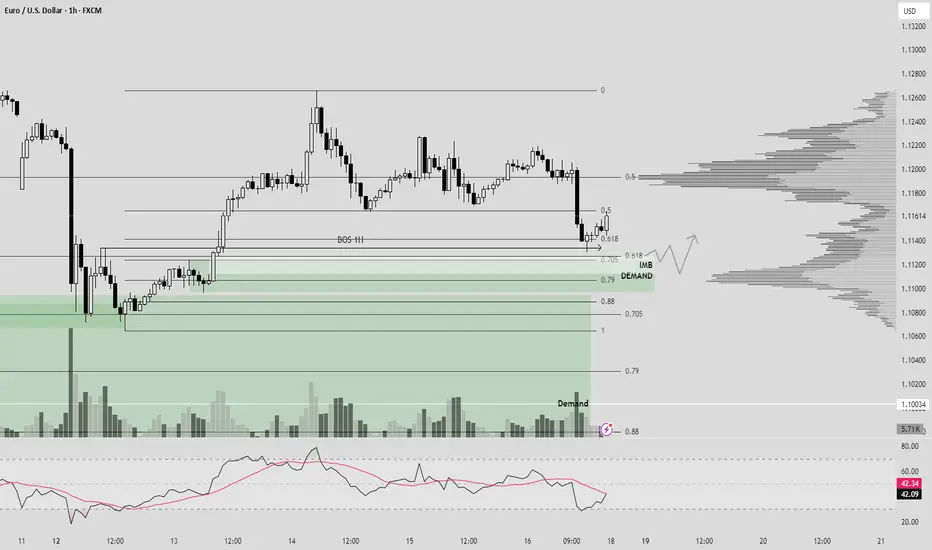
EURUSD (CONFIRMATION + DEMAND + OTE)Hello traders!
Price mitigated demand and after we have confirmation on 1H TF. As you noticed our demand unmitigated. I expecting reversal on LTF after closing IMB.
Have a profitable day and don't forget to subscribe for updates!