🥇GOLD - Consolidation instead of momentum? A trap? Gold is breaking the support of the new price channel. The market is dominated by sellers due to buyer weakness amid dollar strength.
TA on the high timeframe:
1) False break of the resistance of the global descending channel
2) There is a potential for price decline to 1886.
TA on low timeframe:
1) Price tested the key descending channel support for a long time and at the same time the level of 1926
2) With the next move gold breaks the support of the descending channel
3) There is no downside after breaking the support, price is sandwiched between the 1916 support and the previously broken channel line
4) Since there is no downside momentum, price may form a retest of 1926. Further price movement will depend on this level. Since the main trend is falling, we should expect a price decline
Key resistance📈: 1920, 1926
Key support📉: 1916
Descending Channel

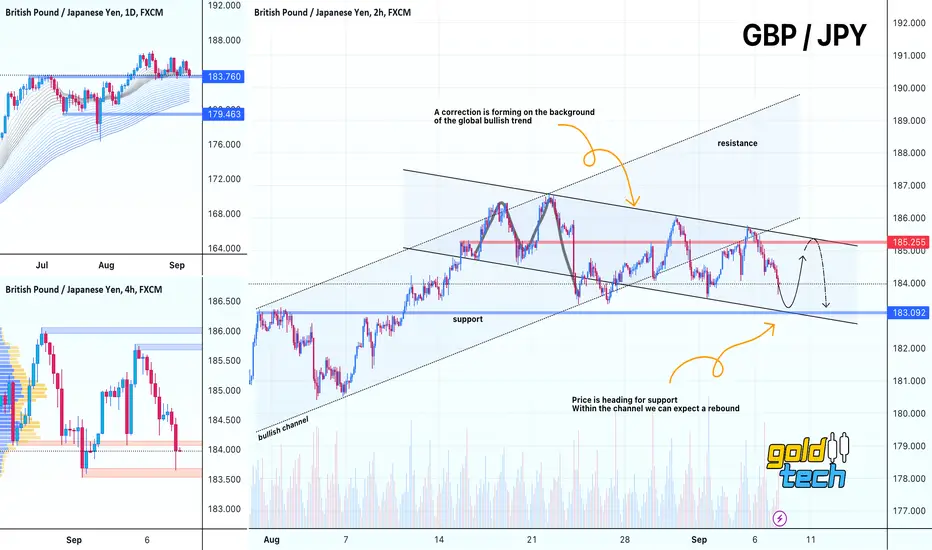
💱GBPJPY - A retest of support could strengthen the price GBPJPY is forming a counter-trend correction on the background of the upward bullish trend. Within the correction and descending price channel, a bullish reaction is possible when support is retested
TA on the high timeframe:
1) resistance line at 183.76 was broken earlier
2) Bulls are trying hard to hold this area. A false breakout may follow on the back of weakening GBP, but a surge in liquidity may push the price up
TA on the low timeframe:
1) A correction forms after a breakout of the ascending price channel
2) The correction is formed within the descending price channel
3) Price may soon test the support area at 183.09
4) From the support, on the background of the global bullish trend, we can expect growth.
Key resistance📈: 185.25
Key support📉: 183.09
🥇GOLD - Bounce to resistance before further decline Gold does form a false breakout of a strong resistance area. Pay attention to the D1 chart on the left. There is a chance that gold could go down to 1885 or even 1840
TA on the high timeframe:
1) Bearish trend and global price channel keep the price above 1950
2) False resistance breakout forms a sell signal
TA on the low timeframe:
1) Price forms an attempt to change the local ascending channel.
2) Price tests 1922 and forms a rebound. The correction may reach the 1930-1935 area. This is like a major step before a further fall
3) We see a trend change and in the long term we should look for strong resistance levels to find a sell entry point
Key resistance📈: 1930-1935
Key support📉: 1922

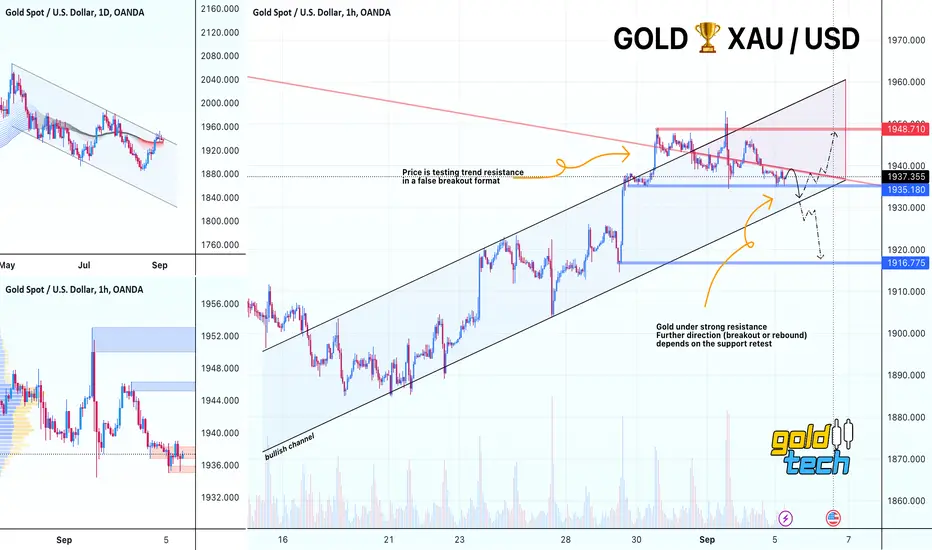
🥇 GOLD - The false breakthrough of global resistance Gold in the global perspective is within the boundaries of the bearish price channel. There are several reasons both for the price fall and for further growth. But in priority we consider the realization of a false breakout.
TA on the high timeframe:
1) A bearish price channel dominates the market for several months. The price retests the resistance after 1 month
2) There is little chance of a breakout at the moment, if a correction and a retest is formed within 1 week, then the probability of a breakout will be higher.
TA on the low timeframe:
1) A false breakout and further consolidation is formed against strong resistance
2) Price forms a false breakout of 1948 resistance, another retest fails and closing around 1946 confirms the presence of a strong seller in the market.
3) The area of 1935 and 1939 plays an important role for us. A break of one of them will form an impulse.
4) But a break of 1935 support will send the price to trend support, which will determine the future direction
Key resistance📈: 1939
Key support📉: 1935, 1931
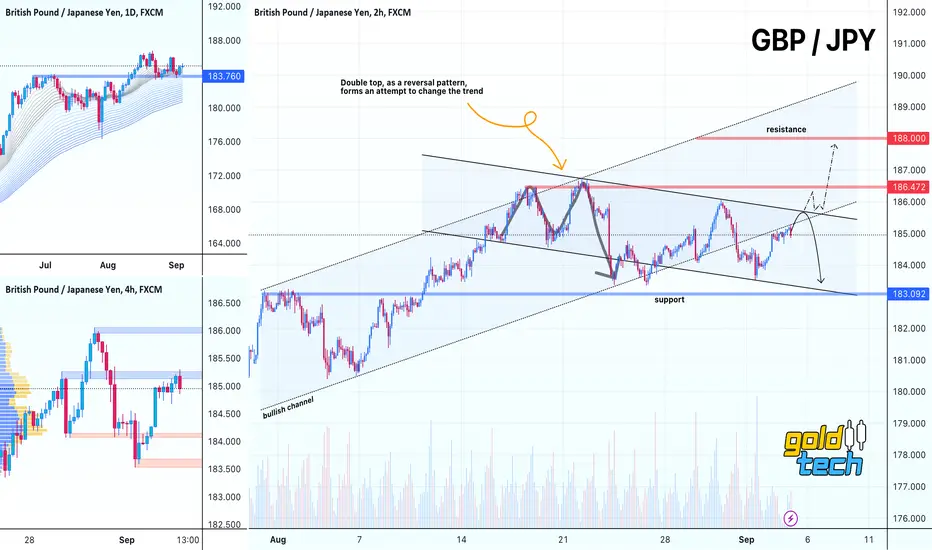
💱GBPJPY - Price may form a bearish momentum GBPJPY forms potentially different signals on different timeframes. But there are localized preconditions that increase the chances for a fall.
TA on the high timeframe:
1) Price failed to form an impulse after breaking through the resistance at 183.76. A consolidation with locally declining highs is forming. We see pressure from the sellers.
2) On H4, a kind of reversal pattern is forming in relation to the local resistance area.
TA on the low timeframe:
1) The price has been in an ascending price channel for a long time. After the formation of a double top reversal set-up, the market forms an attempt to change the trend.
2) Price breaks the bullish channel support, a correction is formed and we see a strong consolidation forming over the last 24 hours.
3) If the price breaks the support at 184.74, we may see an impulse towards 183.00.
4) If the price returns to the boundaries of the ascending channel - the growth will continue.
Key resistance📈: 185.59
Key support📉: 184.74
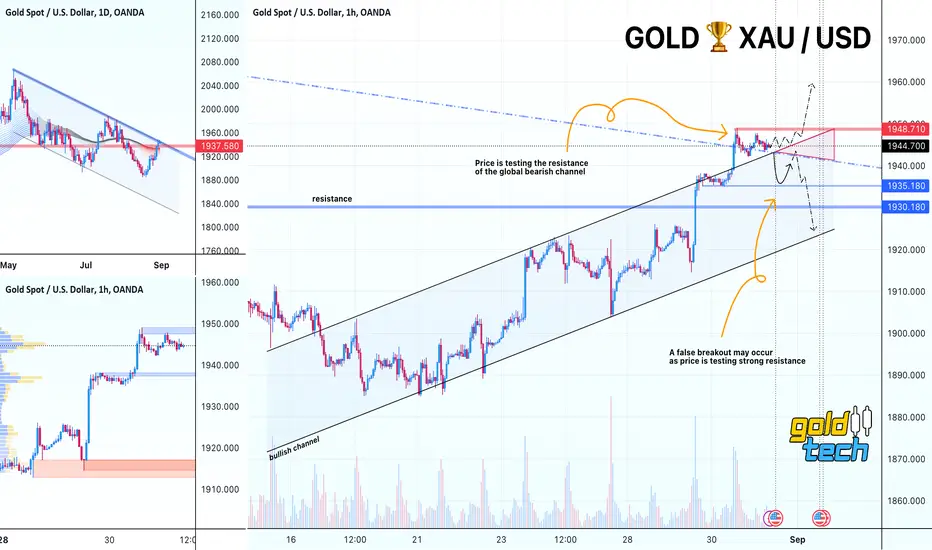
GOLD → Market is at the 0 point on which the direction dependsOANDA:XAUUSD is testing the 1947 resistance again but after updating the low. The market is in place and is forming flat consolidation. Let me remind - globally the price is testing the resistance of the key descending channel
Locally we have a bullish price channel. Globally, a bearish trend is forming on D1, the price is testing the resistance after a month of correction. Consolidation is formed above the resistance of the channel. Distributive growth to the mentioned zone reduces the chances of resistance breakout, and if the price goes below the 1935 area, the market may form a rather strong bearish impulse.
We are currently interested in the levels of 1947 and 1939. A breakout of 1947 will confirm an attempt to change the trend and in this case the price will head towards 1980-2000. A decline below 1939 will send the price to 1935, a break of which will be a bearish signal for the medium term.
Support levels: 1939, 1935, 1932
Resistance levels: 1947, 1950
I expect a retest of 1939 in the nearest future. Further it will be necessary to follow the price reaction to the level, as well as the area of 1947.
Regards R. Linda!
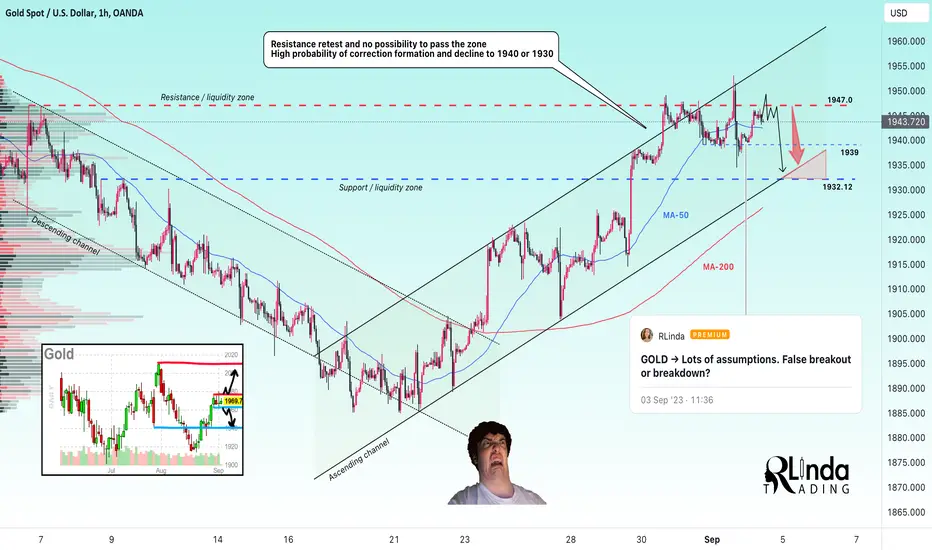
GOLD → Lots of assumptions. False breakout or breakdown? OANDA:XAUUSD on D1 is forming the preconditions for further growth, but there is no such thing on H1. NFP played no role for gold while the dollar is strengthening strongly
There are not many key news this week, but they all come out on Wednesday and are all worth paying attention to as the data indicator will give us a medium-term view on pricing:
1) SP Global US Services PMI
2) ISM Non-Manufacturing PMI
3) ISM Non-Manufatiruong Prices
Monday is a holiday in the US, so we do not expect high volatility.
On the hourly timeframe there was a breakout of the resistance of the ascending channel earlier, everyone expected further growth, I told you that there is a chance of a false breakout. On Friday, after the publication of NFP and unemployment the market forms a shakeout in both directions, brings the price back to the boundaries of the ascending channel (false breakout) and in addition, the closing price remains in place of the opening price of the Friday session. The market is weak.
BUT! The dollar index TVC:DXY is testing strong resistance around 104.5, if the area is broken, the price will head towards 105.5, and this will negatively affect the formation of the gold price.
In this case, if the dollar starts its active growth, then on D1 gold will make a false breakdown of the bearish price channel, which will give a strong bearish signal and a huge potential for the price to fall as much as 6% and almost 1100 points.
It is important for us to wait for confirmation of the market action. The dollar index may fail to pass the mentioned mark and form a flat correction, which is another scenario and gold may get a chance to rise to 2000-2100 in this case
Regards R. Linda!
🥇GOLD - Resistance retest and counter-correlation with DXYGold is testing key resistance with a false breakout and this could be a signal for further declines, while the dollar is closing near a strong resistance level and is likely ready to continue to strengthen further
TA on the high timeframe:
1) DXY closes near 104.3. Regarding the candlestick analysis, we can assume that the price close indicates further continuation of the move. A small pullback may follow from 104.3 before further growth.
2) Gold on D1 is testing a strong resistance line, which is the upper boundary of the descending channel. A false breakout is formed
3) Two correlation situations are formed, the dollar is preparing to grow, and gold to fall. But if one of them starts to develop the opposite scenario, the other, such as gold, will break the resistance and start strengthening towards 1984
TA on the low timeframe:
1) Price is testing 1942.6. A false breakout is formed
2) A retest of blue support and consolidation below 1942 will form a pre-breakout potential against support. The line may be broken and in this case the price will head towards 1914 and towards 1900
3) BUT! If 1942.6 is overcome and the price forms consolidation above the line, the situation will reverse and the price may consolidate to 1984.
Key resistance📈: 1942.6
Key support📉: 1935

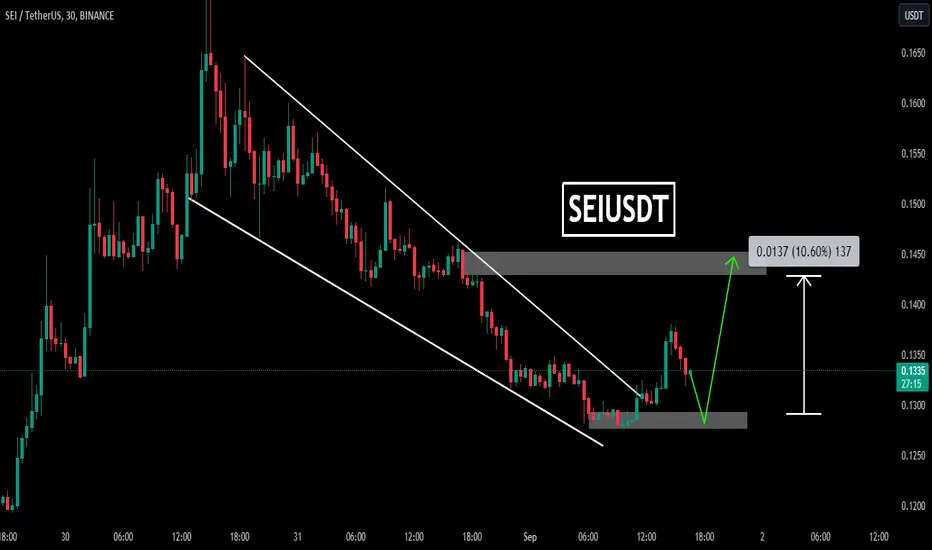
SEIUSDTSEIUSDT was trading in descending channel and recently bulls took the charge and has given the breakout from declining trendline. Currently the price is retracing and creating the support around 0.1300 region.
Will the bulls take charge again continue for leg higher ?
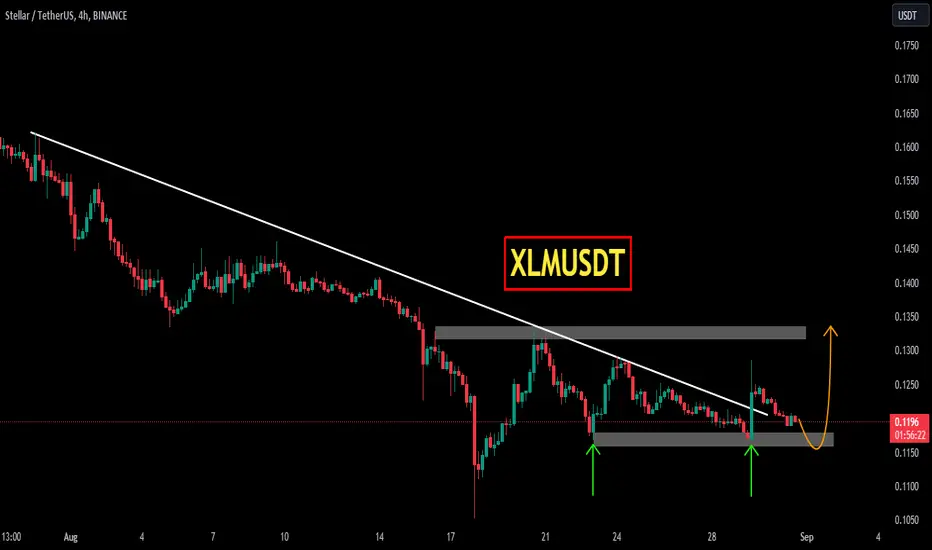
XLMUSDTXLMUSDT was trading under declining trendline and recently bulls took the charge and has given the breakout from declining trendline. Currently the price is retracing and creating the support around 0.1180region.
Will the bulls take charge again continue for leg higher ?
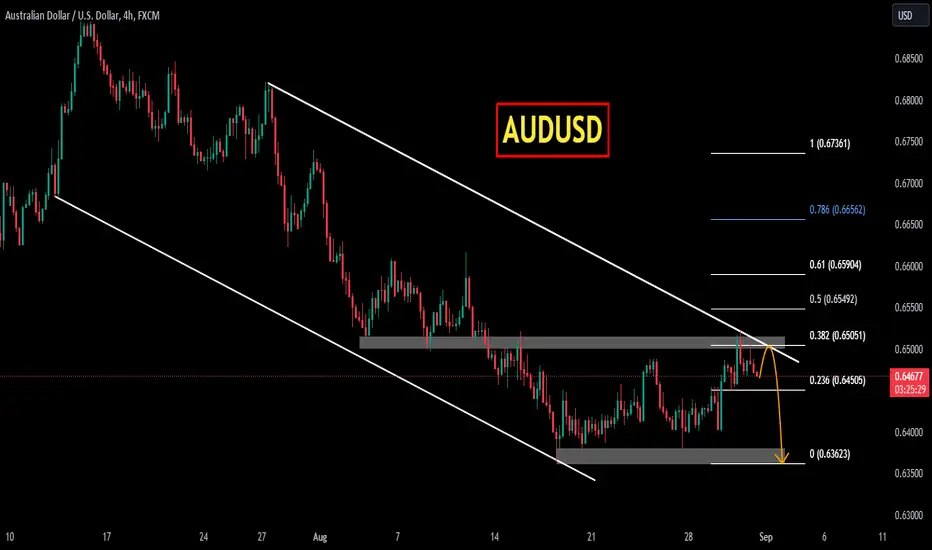
AUDUSDAUDUSD is trading in descending channel and printing consistent LLs LHs. Currently the price is trading at important resistance zone which is 38 % fib retracement level as well. As the red candles at resistance zone indicating the sell pressure.
If the sell momentum continues the red next target could be 0.6360 region.
What you guys think of this idea
🥇GOLD - Retest of global resistance. Trading in the channelGold on the global chart is testing the resistance of the key descending channel. There is little chance of a breakout of this area as gold's growth has been distributive. A pullback after a false breakdown may follow
TA on the high timeframe:
1) A retest of the descending channel resistance is formed
2) The retest is formed after a month, that's a lot of time for price to break resistance the first time around
3) The chance is higher that the decline will start.
4) DXY is testing an important level, if a bullish bounce happens, gold will start falling
TA on the low timeframe:
1) A breakout of the ascending channel is forming, but at the same time the price is bumping into a strong descending resistance line
2) The price can no longer update the local high, the retest forms a local high below the previous one.
3) If the price returns to the channel, under the 1942 area, it will start falling towards 1930.
Key support📉: 1942
Key resistance📈: 1948
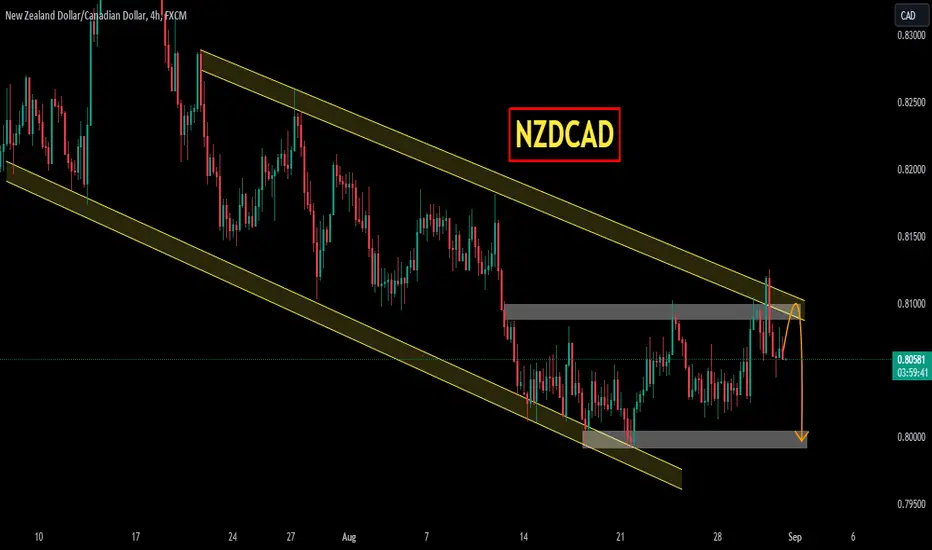
NZDCADNZDCAD is trading in descending channel and printing consistent LLs LHs. Currently the price is trading at important resistance zone. As the red candles at resistance zone indicating the sell pressure.
If the sell momentum continues the red next target could be 0.8000 region.
What you guys think of this idea?
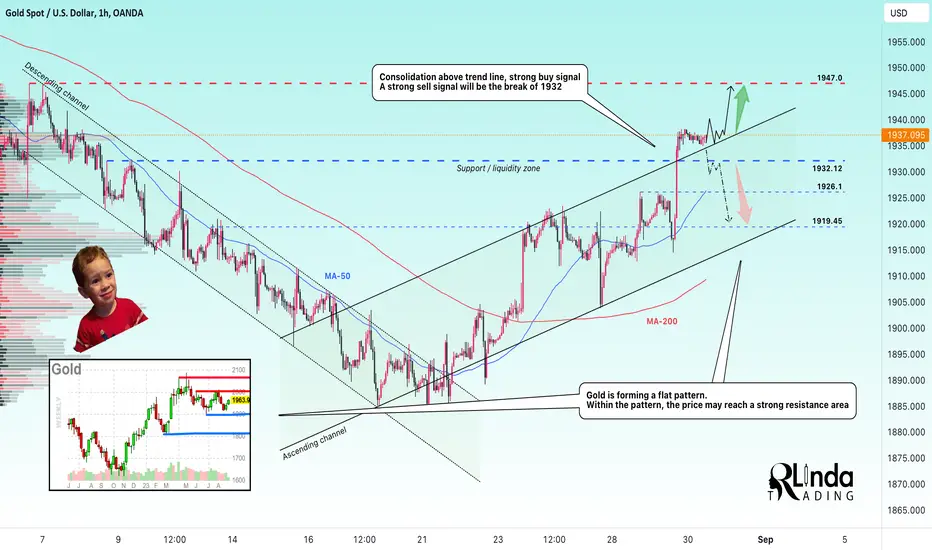
GOLD → False breakdown or breakdown? What's next? OANDA:XAUUSD forms a false break of 1919 support and forms a rally. Yesterday I talked about consolidation on D1, relative to resistance, where we should expect a breakout. It happened, but the momentum was bigger than expected
As part of the bullish momentum and breakout of the consolidation, the price also breaks the resistance of the ascending channel, which can be interpreted differently, depending on the view.
1) It can be a breakout followed by consolidation of the price in the green zone, which gives us a buy entry point and a long position scenario. In such a case, price could consolidate to 1947 quite quickly
2) It could be a false breakout. If the consolidation is prolonged and there is no bullish reaction, a false break of trend support is likely to happen, for us the important level will be 1932, consolidation below this line will allow us to enter the trade comfortably. We follow the price reaction on the chart and look for confirmation of signals.
Support levels: channel boundary, 1932.
Resistance levels: 1937.6, 1947
A flat is forming on d1, within this pattern there is a chance that the price will reach resistance, but globally, the situation with further price growth still looks suspicious.
Regards R. Linda!
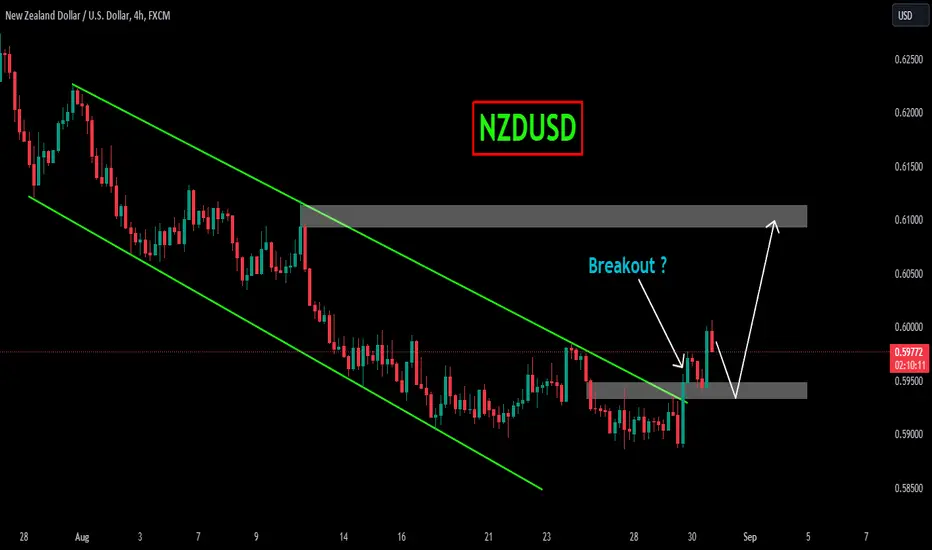
NZDUSDNZDUSD was trading descending channel and recently bulls took the charge and has given the breakout from descending channel. Currently the price is retracing and creating the support around 0.5950 region.
Will the bulls take charge again continue for leg higher ?
CVXUSDT → The coin is preparing to break through resistance BINANCE:CVXUSDT against the backdrop of COINBASE:BTCUSD , which has been falling for a long time and finally stopped, is forming a rather interesting consolidation near the wedge resistance.
The coin on the chart is testing the bottom at 2.417, after which it forms a decrease in volatility and consolidation, within which the coin is creeping up to the trend resistance.There is a high probability that with a small bitcoin consolidation CVX will break the trend resistance and give a gorgeous bullish impulse.
If the accumulated potential is realized, the price could reach the 3.180, 4.235 and 6.400 area quite quickly.
The moving averages indicate a bearish trend, the price will have to go quite a long way to retest the SMA.
Support levels: 2.417
Resistance levels: wedge resistance, 3.180
The altcoin market is waiting for any bullish reaction in the market, including from bitcoin, which plays an important role in this market. Altcoins react weakly to the fall of the flagship and react strongly to the rise. We expect a breakout of the wedge
Regards R. Linda!

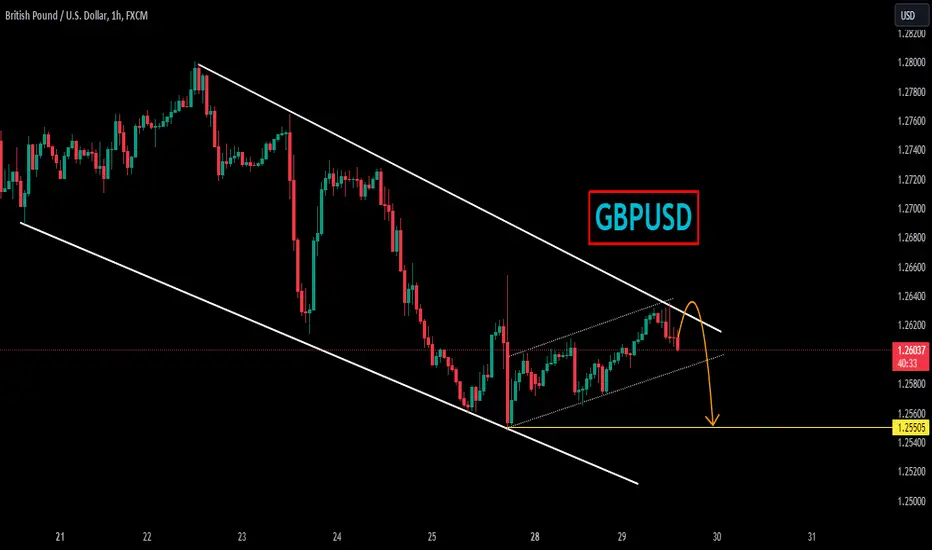
GBPUSDGBPUSD is trading in descending channel and printing consistent LLs LHs. Currently the price is trading at important resistance zone. As the red candles at resistance zone indicating the sell pressure.
If the sell momentum continues the red next target could be 1.2550 region.
What you guys think of this idea?
USOILUSOIL is trading in descending channel and printing consistent LLs LHs. Currently the price is trading at important resistance zone. As the red candles at resistance zone indicating the sell pressure.
If the sell momentum continues the red next target could be 77.50 region.

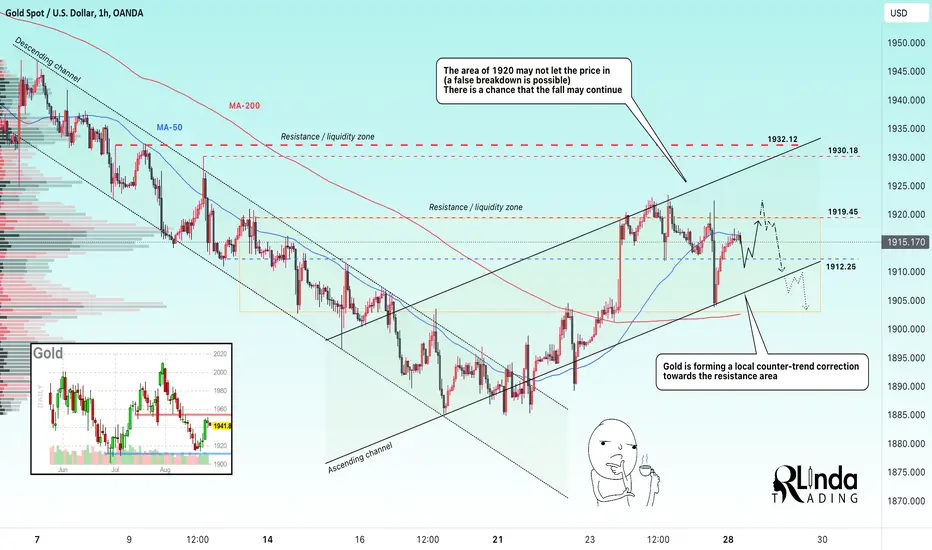
GOLD → XAU bumps into a strong resistance area OANDA:XAUUSD continues to form counter-trend correction within the upward price channel. On the global timeframe the resistance area 1920-1935 plays an important role, the price is testing it
Globally, the market has a bearish trend, an upward correction is forming on the 1H while the DXY continues its strengthening. The forex market, where the dollar is in a sign, as with XAUUSD has already broken the support area, most likely this can be taken as a premise.
DXY continues to strengthen after consolidation and forms momentum towards 105.5 area, which could bearishly affect XAU pricing.
Gold bounces off trend support and heads towards 1920 resistance but falls short. The liquidity area has a big impact and prevents the price from approaching a local high. The price is at a strong resistance, a fall and a possible retest is likely to follow
Resistance levels: 1920, 1922.5
Support levels: 1912
The market has been strengthening since the opening of the session, but still can't update the local maximum. If the bulls do not let the price above 1919.45, it will be the beginning of further decline.
Regards R. Linda!
Bitcoin - Plan for the next 30 days! (This is going to happen)
Bitcoin is moving in this huge parallel channel no one talks about, and the price is respecting it pretty well, including the middle trendline!
The current price of Bitcoin is around 25900 USD, which is very near its bottom in November 2022 at 16000 USDT. I expect this low to be followed by a huge crash, so make sure you are prepared for it. Bitcoin has been very weak compared to other assets this year.
In September, I expect Bitcoin to reach the strong horizontal line at 24820 and potentially take liquidity below it. There are a lot of stop-loss orders from traders, which is a magnet for whales.
This analysis is not a trade setup; there is no stop-loss, entry point, profit target, expected duration of the trade, risk-to-reward ratio, or timing. I share my trades transparently and post trade setups privately.
1 week ago, we had a huge red dildo with a 14% decline. To me, this is an indication that the third wave is in progress in my Elliott Wave count. Wave 5 should go below wave 3 exactly as I have drawn it on the chart! But do not expect any big crashes in the short term. A swing failure pattern (SFP) is something that has a higher probability. Basically, you can buy/long the fifth wave.
This is my current plan for Bitcoin for the next 30 days. Of course, this is my main scenario, but I also have an alternate scenario, which I may post next time, but we will see!
Let me know in the comment section if you are shorting Bitcoin, but I recommend placing a buy order around 24800 for a quick bounce back to 26800!
Thank you, and for more ideas, hit "Like" and "Follow"!

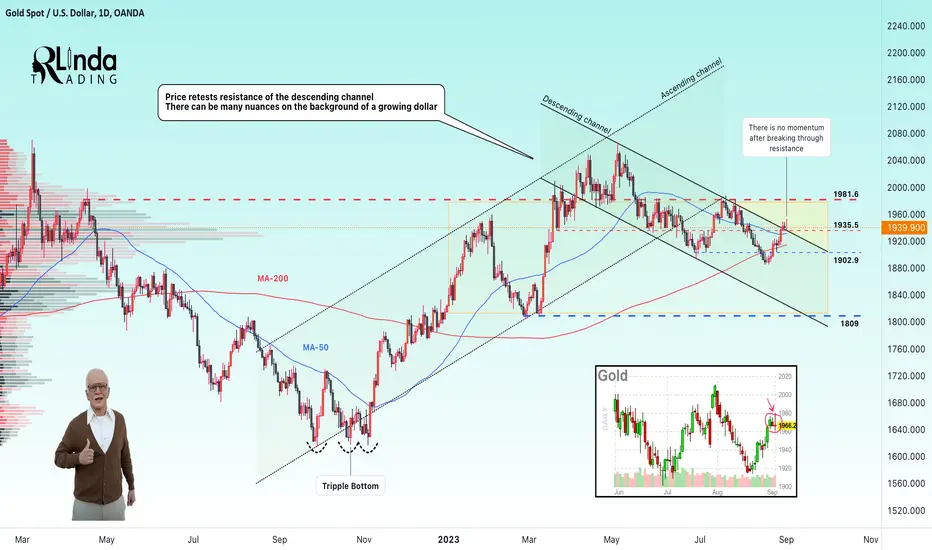
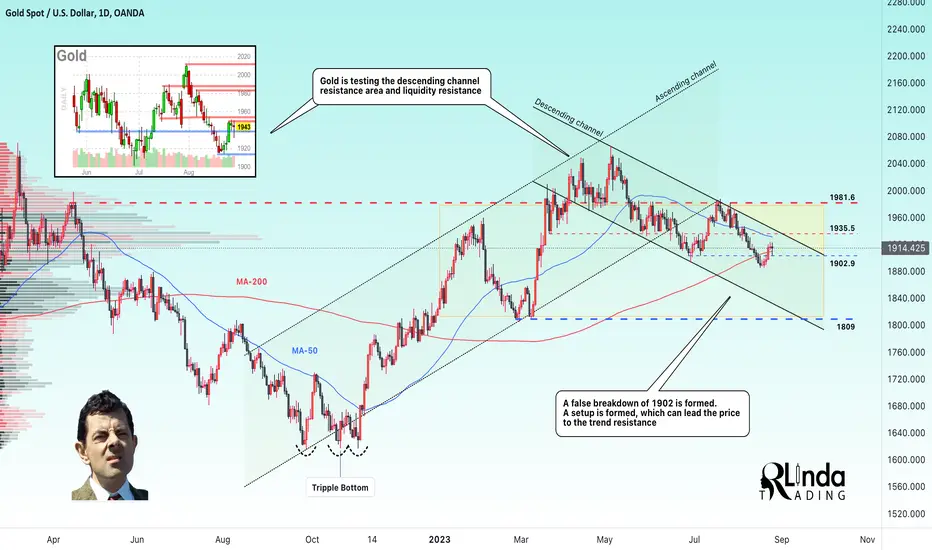
GOLD → Prerequisites for further decline, or?OANDA:XAUUSD is within the descending price channel. The trend break occurred at the end of June. Within the current channel, the price makes a false breakdown of 1902 and forms a rebound to resistance, which many perceived as a trend change, but it is not so
There are not many key news releases this week, but all of them are published on Wednesday, they are worth paying attention to, for the data indicator will provide us with a medium-term insight for pricing:
1) SP Global US Services PMI
2) ISM Non-Manufacturing PMI
3) ISM Non-Manufatiruong Prices
Monday is a day off in the US, hence we do not expect high volatility.
From the technical analysis point of view:
The price is in a descending price channel. The nearest resistance that may play an important role for the price is at 1920, 1935, on Monday and Tuesday the price is likely to reach this area before falling further. Why am I expecting a fall? Pay attention to the DXY chart. The dollar index has consolidated above the strong 103 level, forming an impulse and testing a false break of 104.3. In the medium term, the DXY could continue to rise towards 105.65, which would give a bearish push for gold
Support levels: 1902.9, 1884
Resistance levels: 1920, 1935.5
The direction of the dollar will give us the primary movement of the gold price in the first half of the weekly session, the news on Wednesday will determine the further movement.
Regards R. Linda!
✅AUD_CHF WILL GO DOWN|SHORT🔥
✅AUD_CHF is trading in a
Falling parallel channel and
The pair is retesting the
Falling resistance of the
Channel so I think that
We will see a move down
SHORT🔥
✅Like and subscribe to never miss a new idea!✅

GOLD → The price will break 1914 and start another decline OANDA:XAUUSD is declining amid the strengthening of the dollar. TVC:DXY finally consolidates above the key support of 103 and starts upwards to 105-107, which gives a new kick to gold for the fall
On the chart we see the price stopping in the area of 1914-1918 and the price forms a retest of 1914 after a false breakout - a strong enough syschgnal that prepares us for a possible fall in the value of the metal. If the price breaks 1914 and forms a consolidation below the level, it will give us a strong signal that the price will continue its fall to 1900-1885 after a shakeout in the form of a rally to 1918.
A stronger dollar means that no one will cut rates anytime soon as the market still sees strong inflation.
Moving averages are acting as support but MA-50 may be broken soon which would open a new corridor for price
Support levels: MA-50, 1914, 1911
Resistance levels: 1918
I expect a short setup and the development of the situation in the format of price decline to 1900, but something against the scenario can always happen. If the price breaks 1918, it will start to rise to 1925.
Regards R. Linda!
