Tron TRX is breaking out! Explosive pump is likely.
As you can see, TRX is currently breaking out of the descending triangle on the daily/weekly timeframe, and an explosive pump is now likely!
The take-profit is at the top of the triangle, which is 0.18 USDT. I think it's possible to go higher, but we don't want to risk anything, because we could be in wave 5 from the Elliott Wave perspective. Triangles are typically formed as a 4th corrective wave.
This bull market that started in January is absolutely amazing, and I hope it will continue as long as it possibly can! We want to take as much profit as possible from this bull run.
Sending USDT via the TRX network (TRC20) is very popular among crypto people. Furthermore, Tron's value held up very well during the 2022 bear market. It's definitely a positive sign.
Now is the best time to buy TRX if you don't want to miss out on the upcoming pump! It will be huge!
This analysis is not a trade setup; there is no stop-loss, entry point, profit target, expected duration of the trade, risk-to-reward ratio, or timing. I post trade setups privately.
If we take a look at the previous price action from 2020 to 2021, there are no gaps that need to be filled. In other words, it's possible that we will never go back to these levels.
I'm not sure how you feel about it, but I'm already long in the futures market. 171% is a good profit, so be greedy!
Thank you, and for more ideas, hit "Like" and "Follow"!
Descending Triangle

WAVESUSD: Potential ABCD BAMM Could Take It Up 18%Waves is in a Descending Triangle at the highs but it showing signs of a Potential Bullish Head and Shoulders and a Potential Bullish ABCD BAMM, if this plays out the measured move will bring us up about 18-25%

IPCALABIpcalab broke out of descending triangle pattern on hourly TF with decent volumes.
Could be bought with mnetioned stoploss & target.

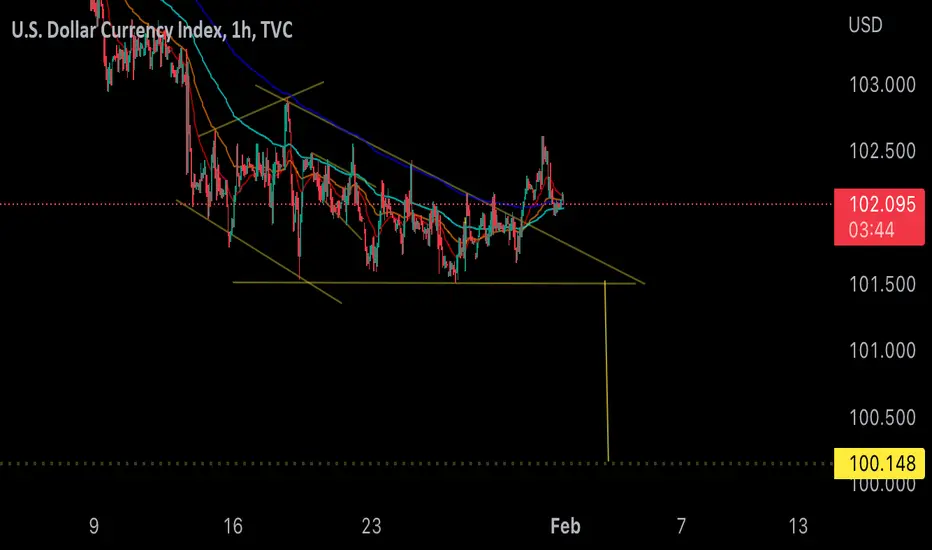
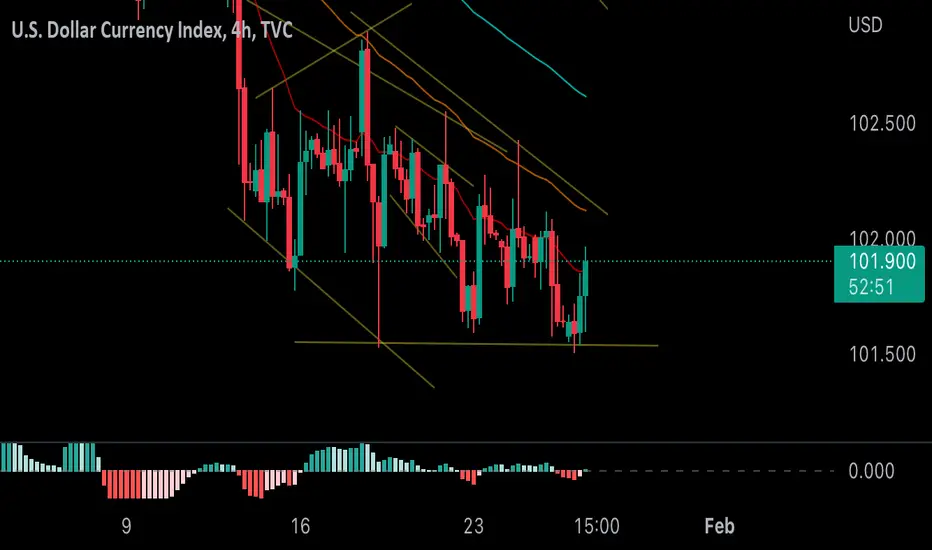
DXY Target 100.18Jokes aside here it is. Triangle target. This index is highly efficient at hitting targets. Dollar down. Who knows what sort of fledgling additional bear flag it coul puke out on the way there. Bear fomo is still a thing I guess....
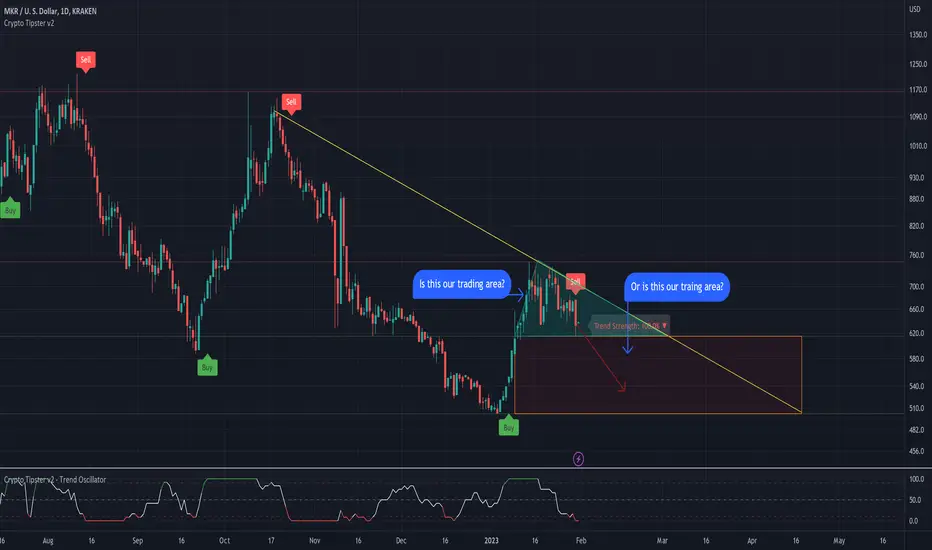
MKRUSD - Consolidation or Downward Move?After around 6 months of hugely profitable trading with MKR we've received a Short signal from Crypto Tipster v2 - looking at the chart there's 2 possibilities from here.
Either we're actually looking at a period of consolidation whereby the price isn'y going to do all that much within the current range until it reaches the end of this wedge in a couple of weeks; or we're going to experience a drop into the trading area below this wedge.
Given how profitable Crypto Tipster v2 has been with MKR recently we're inclined to go for it, 10% on the Short should be acheivable, 20% is also not unlikely!
If you enjoyed or agree with this idea - drop us a comment, like & follow! :)
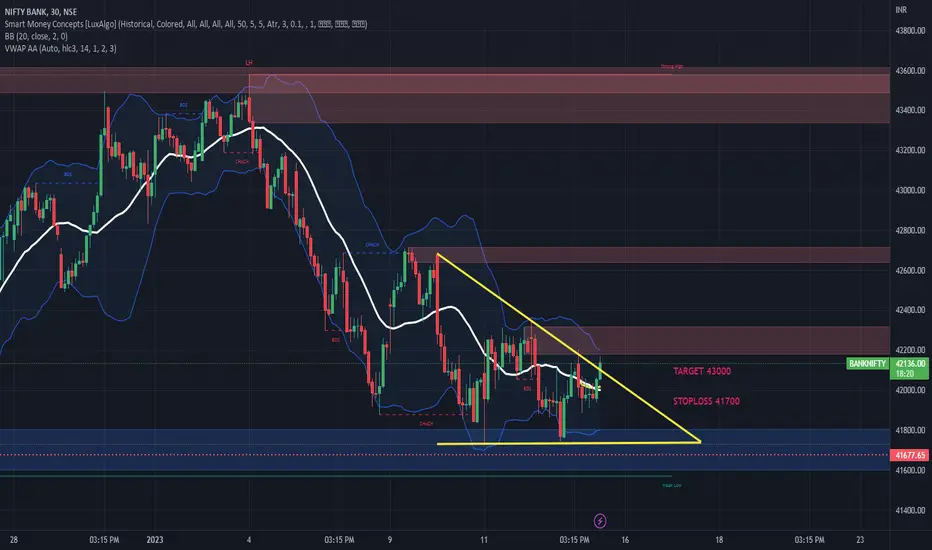
BANKNIFTYBanknifty broke out of descending triangle pattern on 30 min TF.
Could be bought with mentioned stoploss & target.
Bitcoin - 25% CRASH from this level! Be prepared.
The bulls are incredibly strong! This may be the best January in Bitcoin's history. But the bears are waiting patiently to short bitcoin at the key level!
The Resistance 1 level is strong because there is a POC of the previous structure, the start of the massive previous GAP, and a horizontal level from 2021.
With this strong confluence, we can short bitcoin on the futures market for a potential 20%–25% profit. Like I have said many times, I am here for the bulls and bears. So this is clearly an analysis for the bears.
This analysis is not a trade setup; there is no stop-loss, entry point, profit target, expected duration of the trade, risk-to-reward ratio, or timing. I post trade setups privately.
I am a professional trader with almost 6 years of experience in the crypto market. I can tell you that with this major resistance, we will see a pretty strong rejection!
What I recommend you to do is to short Bitcoin between 28,750 - 30,100 . I will specify this level more precisely in one of my next analyses on lower time frames or privately!
If we take a look at the volume profile, we can see there is no volume area. These areas tend to be filled, and at the end of the area, we should see a big rejection.
We have only 4 strong resistance levels on the way up to the new all-time high. However, it may take some time to break it all down.
Bitcoin started its new bullish cycle in November 2022. I expect another bearish cycle to start sometime in September 2025. I have predictions for years or even decades in advance!
Thank you, and for more ideas, hit "Like" and "Follow"!

XRPUSDT wants the breakout from the key level?The price had a clear breakout from the descending channel and retest it as new support on 0.36$ area on 0.618 Fibonacci level.
XRP got the liquidity from the false breakout from the 0.33$ area, where the market created the local demand zone
At the moment the price is going to create a pennant just below the daily resistance and key level
How to approach it?
the price needs to create a new breakout from 0.41$ area, it's a clear and strong resistance for the price. For that reason, we could see an accumulation phase below this structure.
–––––
Follow the Shrimp 🦐
Keep in mind.
🟣 Purple structure -> Monthly structure.
🔴 Red structure -> Weekly structure.
🔵 Blue structure -> Daily structure.
🟡 Yellow structure -> 4h structure.
⚫️ Black structure -> <= 1h structure.
Follow the Shrimp 🦐

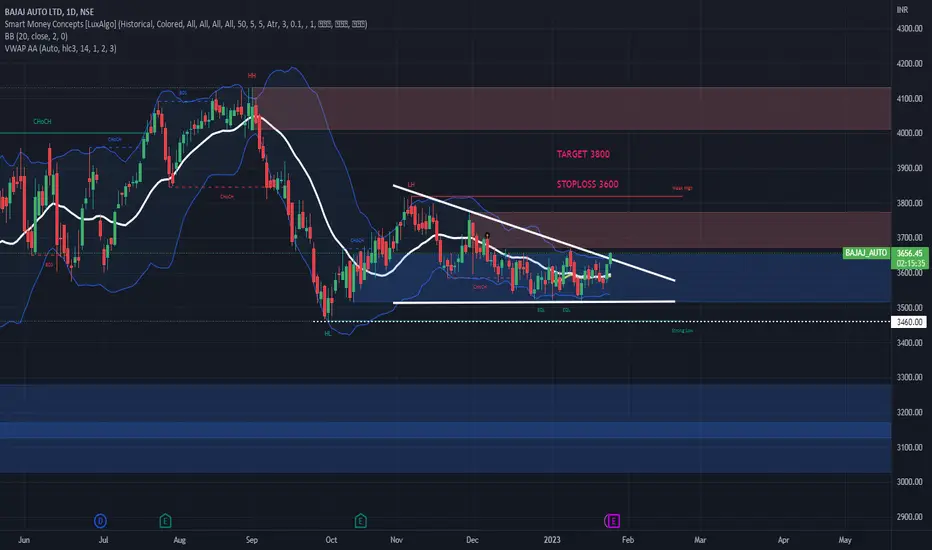
BAJAAUTOBajajauto broke out of descending triangle pattern on daily charts with good volumes & with very good risk:reward ratio.
Could be bought with mentioned stoploss & targets.
Literal buffalo chips... DXYLive from west yellowstone I present to you the daily morning impotence of the US DOLLAR. Long this if you wanna rid yourself of worldly possessions and a warm home.
WISH: FOLLOWER REQUEST / SQUEEZE??? / CONVERGENCE / LOTTO PLAYDESCRIPTION: In chart above I have included an analysis of TICKER SYMBOL WISH as per follower request. Despite it's short market history since IPO price action has seen plenty of volatility and has broken many fundamental supports and has fallen into PENNY STOCK TERRITORY. With that being said refer to FULL CHART LINK DOWN BELOW to see what I am talking about.
POINTS:
1. CURRENT DEVIATION is at 0.9.
2. Ceiling for current price action stand at 4 Points while new floor threshold stands at 0.4
3. DOWNTREND MOMENTUM has given way to a DESCENDING TRIANGLE PATTERN.
4. MA'S indicate a tightening of price action (MA LEVELS = 45, 100, 200).
5. MACD indicates POTENTIAL SQUEEZE UNDERWAY with little DEVIATION from MEDIAN.
6. RSI currently does in fact show signs of overbought pressure with current levels oat 64.97.
IMPORTANT: In order to exit PENNY STOCK TERRITORY price action must eventually rise above 4 points to once again be in congruence with previous ALL TIME HIGH.
SCENARIO #1: In a bullish scenario I would only consider a long position if price action is to break above 1.0 to the upside this would confirm current setup and can give way to a potential squeeze.
SCENARIO #2: In a bearish scenario I would consider a shorting position if price action falls anywhere below 0.4 and would not hold any actual stock at that point.
FULL CHART LINK: tradingview.sweetlogin.com
NASDAQ:WISH

Bitcoin - Last chance to buy below 20k! (lifetime opportunity)
Congratulations to the bulls for this successful start of the bull market! It's really a pleasure to watch these candles.
Bitcoin may give you the last chance to buy below the 20k level, so I hope you are going to take this once-in-a-lifetime opportunity! You can buy on the spot market or leverage long on futures.
It's still possible to retest the previous breakout level of the trendline, which is around 18,300. So this will be your dream entry, and trust me when I say this!
This analysis is not a trade setup; there is no stop-loss, entry point, profit target, expected duration of the trade, risk-to-reward ratio, or timing. I post trade setups privately.
So, why do I believe bitcoin has reached its bottom? From the technical perspective, there are multiple indications, and I will tell you all the arguments.
The halving is coming, and usually bitcoin finds incredible strength before and after the halving event. This is statistical data based on historical performance.
Bitcoin is breaking out of the falling wedge, bullish reversal pattern on the weekly chart and also is breaking out of the major trendline established in November 2021 with a successfull retest. Basically, Bitcoin is above all major trendlines on the linear scale.
We have a bullish divergence on the weekly RSI, that has been confirmed recently. All altcoins show huge signs of trend reversal, not just Bitcoin.
As per my Elliott Wave analysis, the downtrend has been completed as an ABC ZigZag (5-3-5 structure). You can see my Elliott Wave count on the chart. We are starting a brand new impulse wave to the upside!
On the way up, there is a lot of resistance. Resistance 1 is almost certainly going to be reached. The next resistance is the 0.618 FIB + 0.618 FIB LOG and, of course, the unfilled GAPS, POC, and the previous all-time high.
Thank you, and for more ideas, hit "Like" and "Follow"!

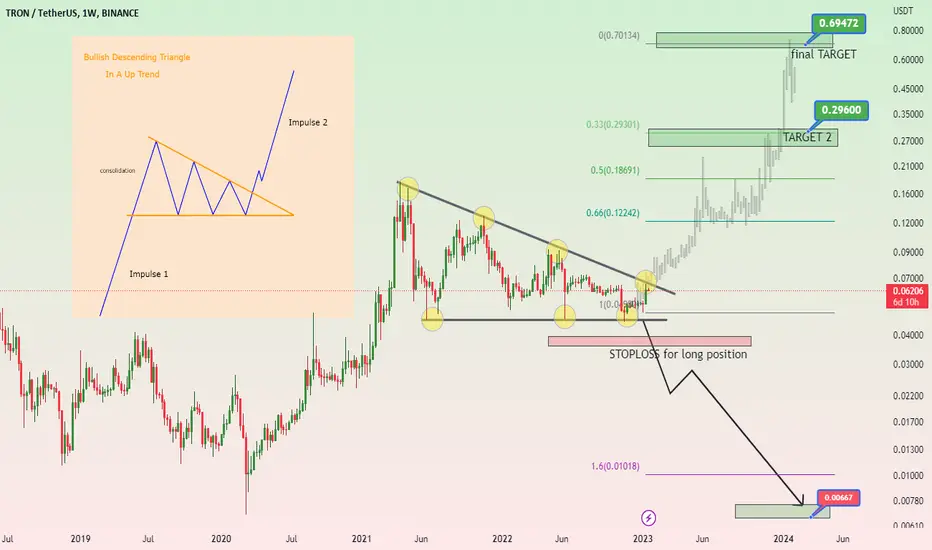
Who wants to 10X their capital with TRX ?hello guys...
as you can see on the TRX chart, it has formed a descending triangle on an upward trend, 3 times touched the bottom line and 4 times the top line touched, wining upward movement so far :))
but be patient until the top line breaks up after that you can get a long position until $0.29 and if you are so greedy hold it until $0.69.
if the price breaks up the bottom line, get a short position.
note: if the price breaks up from the end of the pattern makes it invalid.
always do your own research.
If you have any questions, you can write them in the comments below, and I will answer them.
And please don't forget to support this idea with your likes and comments.
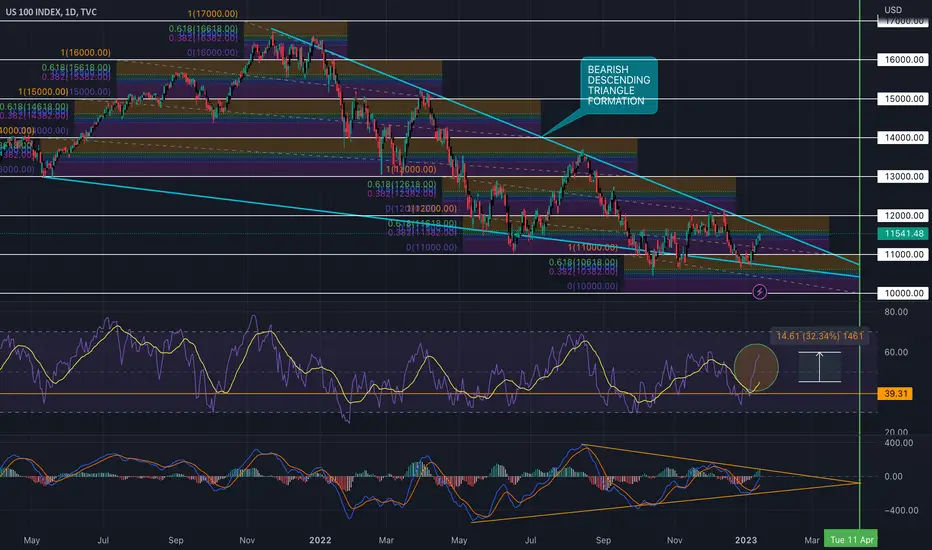
NDQ US 100 INDEX: MARKET MAKERS MAGIC??DESCRIPTION: In the chart above I have provided a MACRO analysis of NDQ that is in fact showing strong signs of PENDING CAPITULATION but I will leave the rest to INDIVIDUAL INTERPRETATION.
POINTS:
1. DEVIATION OF 1,000 POINTS is where NDQ usually finds appropriate CONSOLIDATION to then draw out SUPPLY & DEMAND POCKETS.
2. RSI is DANGEROUSLY OVER EXTENDED and looks ready for some PULLBACK.
3. MACD is CONSOLIDATING and moving closer to its MEDIAN SIGNALING A BIG MOVE IS ON THE WAY.
*IMPORTANT (FOOD FOR THOUGHT): ALL SIGNS ARE BEARISH BUT IS THAT WHAT THE MARKET MAKERS WANT US TO THINK? TO MANY PEOPLE ARE BEARISH AND PLACING MONEY ON PUTS. JUST DOUGHT MARKET MAKERS WOULD ALLOW FOR EVERYONES CONTRACTS TO EXPIRE IN THE MONEY.
SCENARIO #1: A BULLISH scenario would require a hold of 11,000 POINTS followed by SIDEWAYS MOVEMENT or a BREAK of TREND.
SCENARIO #2: A BEARISH scenario would require a lose of 11,000 POINTS followed by an AGGRESSIVE BREAK of TREND to the DOWNSIDE.
FULL CHART LINK: tradingview.sweetlogin.com
TVC:NDQ
B | Wave Projection | TFW Bullish Divergence | Ending Diagonal?Price action and chart pattern - descending triangle with a bullish divergence pattern in weekly timeframe is considered a strong reversal trading signal.
Wave projection: A possible 5 wave of major A-wave correction coming forming an ending diagonal wave targeting 0.5 - 0.618 fibonanci extension of previous 3-wave downtrend.
Entry: Descending triangle breakout / SMA200W zone
Stop: Lower triangle support -12%-15%
Target: 0.382 - 0.5 retracement of current downtrend A-wave +40% - 50%
Risk reward ratio: 3:1
Always trading with affordable risk and respect your stoploss
Good Luck

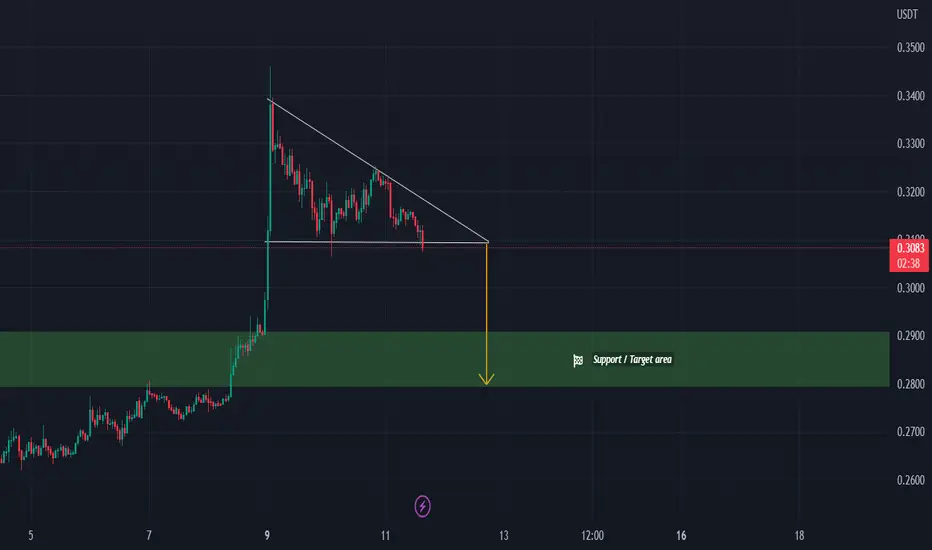
ADAUSDT - Descending Triangle - BearishOn the chart of Cardano (Ada) we can see a descending triangle has appeared on 1h timeframe.
A descending triangle is a bearish chart pattern. Once the price breaks down of the support it is really likely that the price will dropp.
Profits can be taken when the price approaches the support area.
All further details are shown on the chart.
Goodluck!
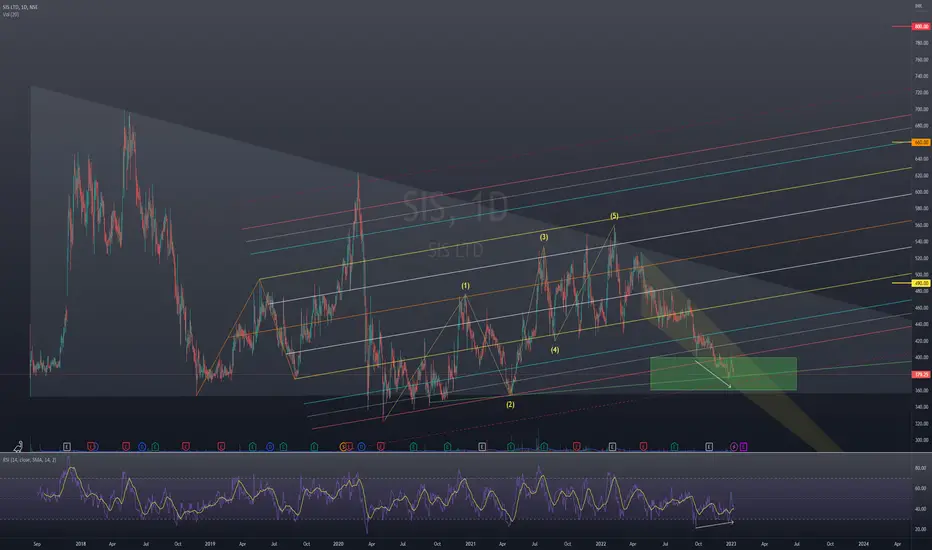
SIS Ltd Trend AnalysisFundamentals are good, revenue has increased more than 10 times in 11 years but OPM dropped by 66% due to increase in employee cost which is concerning.
Borrowings increased to almost 100% but trade receivables & cash equivalents can make it up to 87.5%.
Technically price is about to reach the base of the big descending triangle as highlighted and forming strong bullish divergence with RSI.
Good to accumulate around 360-400 levels for the following targets:
Short term swing target @ 490 (29% ROI from CMP)
Medium term swing target @ 660 (73% ROI from CMP)
Long term swing target @ 800 (110% ROI from CMP)
Mandatory stop loss @ 320
Do your own due diligence before taking any action.
Peace!!
BTC Descending Triangle WeeklyThere is a huge descending triangle range on bitcoin on the weekly timeframe, and bitcoin is also reaching the end of the range and is getting tighter. There is also a tight range marked by the contraction indicator, showing that it will expand.

Shiba Inu is breaking out! Take a huge profit here.
Shiba Inu is absolutely prepared for a massive uptrend on the daily chart! We can see that the price is breaking out of the falling wedge pattern.
This falling wedge pattern is not a standard wedge because it is also an ending diagonal from the Elliott Wave perspective, which is a powerful combo.
Also, on the RSI indicator, we can spot a bullish divergence between the swings. It's also a strong indication that the bears are losing steam.
It's a great time to open a long position on the futures market, as I already did!
This analysis is not a trade setup; there is no stop-loss, entry point, profit target, expected duration of the trade, risk-to-reward ratio, or timing. I post trade setups privately.
Now the most important question is: where is the profit target? On the way up, you obviously want to target strong resistance.
Strong resistance is undoubtedly the start of the previous GAP + top of the parallel channel, and if the bulls break this level, the previous consolidation structure's POC will be reached. You can see these levels on the chart!
If you haven't seen my analysis about Bitcoin's exponential pump, then you must, so check out my related section down below.
December was an extremely good month when it came to opportunities in the crypto market, and January is starting very positively as well.
Thank you, and for more ideas, hit "Like" and "Follow"!

EXPE - Descending Triangle - BearishOn the chart of Expedia (EXPE), we can see a descending triangle. A descending triangle is a bearish formation.
The price has already broken the support and is now retesting the support. When the support turns into a resistance a short position can be taken. The price is likely to drop more until it has reached its target.
All further details are shown on the chart.
Goodluck!

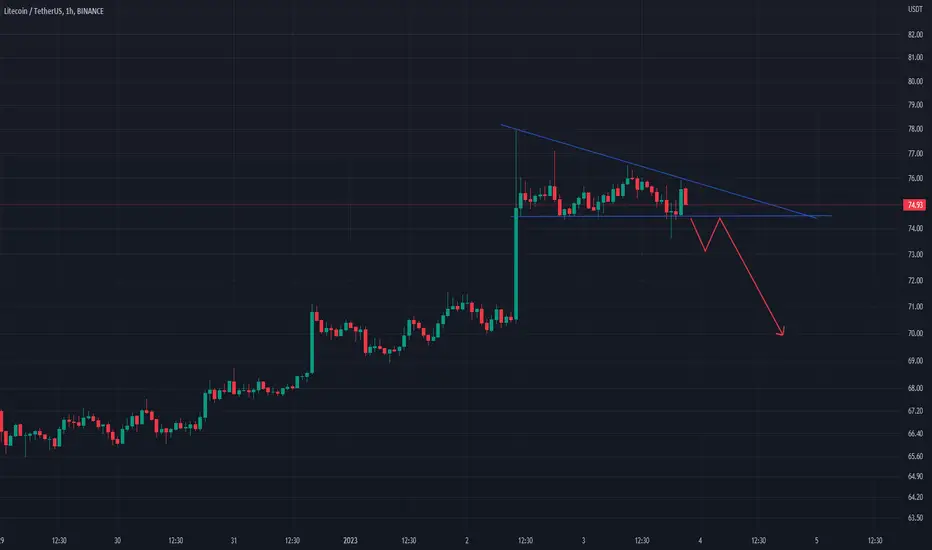
LTC/USDT Short Positionltc is in a Descending Triangle.if breakout its gonna touch 70.
s;:76.63
tp:70
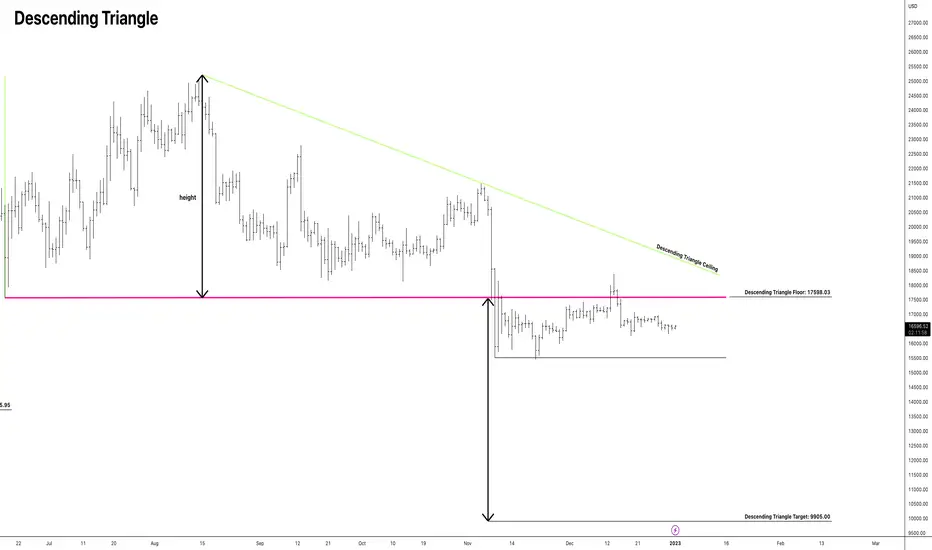
BTCUSD DESCENDING TRIANGLEBTCUSD has formed a Descending triangle on its Daily Chart.
The price has broken down the floor of the descending triangle @17598.03.
At first the price objectives are:
Target: 9905.00
What do u think Traders here in this situation?
Could it be a False Breakout? I know traders benefit from it?
or could we hit the Descending Triangle Target: 9905.00?
let me know what others overviews u have