Dominance BTC.D - ALT SEASON STARTING! + ABCDE Completed
The 14-month long consolidation is over, it was truly an endless price action, but nothing last forever.
ABCDE rectangle/triangle has been successfully finished and now we can finally continue in the direction of the main trend.
According to my analysis of Elliott waves, we are now in the 3rd wave and this can be huge!
Bitcoin Lightning network is still not supported by major exchanges, because it is not in their business plan and this is definitely a positive sign for altcoins.
What to do during the alt season? It's good to pick promising altcoins, which is not an easy task, but even very bad coins can easily pump.
Look at my ideas about interesting altcoins in the related section down below ↓
For more ideas please hit "Like" and "Follow"!
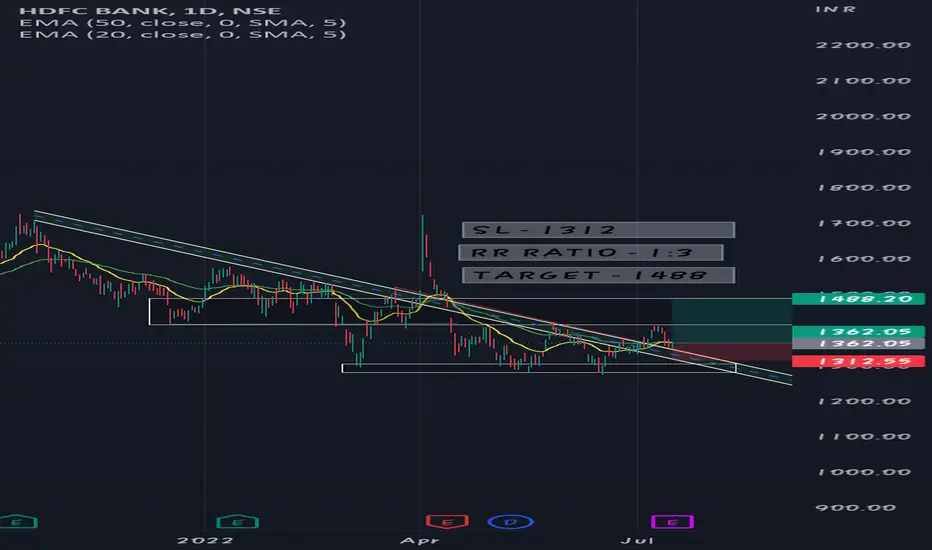
Descending Triangle

HDFC BANK has retested, and showing BULLISH signs hey guys ,
just found a good stock to talk about ,
HDFC BANK was moving in a great downtrend .
This stock was following a pattern called
DESCENDING TRIANGLE 📐 PATTERN
previously also ,
this stock has tried to cross his resistance
and to break hi pattern,
but it FAILED
and it resulted to BULL TRAP for TRADERS
but now this stock has again broke his resistance and pattern ,
and now I think that
this stock will be successful in BREAKING HIS PATTERN ,
because there is no place left for this stock to continue his pattern ,
therefore , from my opinion you can bet on this stock and earn high returns ,
i have marked the RR RATIO , TARGET AND SL
y'all can trade according to this RR RATIO ( IF U WANT TO )
otherwise, you can adjust it accordingly. BUT PLS CONSIDER THE GLOBAL MARKET SITUATIONS
1. INFLATION
2. WAR
3. RISING BANK RATES ( IMPORTANT FOR THIS STOCK )
😀😀
HDFC BANK
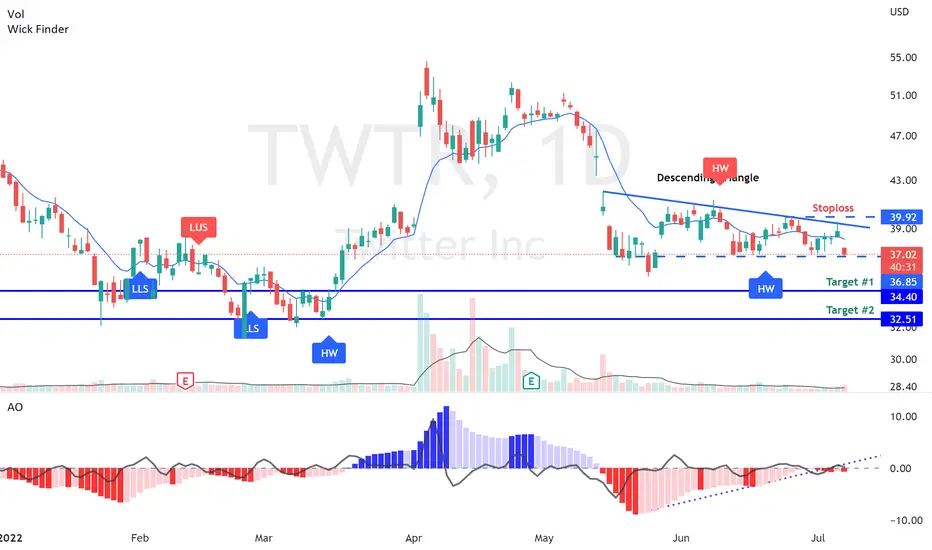
TWTR - Just cancel the deal alreadyRumors says the Twitter-Elon Musk deal is falling through. It should be a straightforward trade if it does. The stock has been trading in an undeniable descending triangle pattern. I have used previous supports as possible targets and outlined a stop loss above the most recent swing high. Lets do this!
Ripple XRP - Finally huge opportunity! + Elliott Wave + Channel
XRP can finally make an uptrend, we have a local descending channel on the daily chart, which is very close to a breakout!
As per my Elliott wave analysis, the ABC correction can be completed, so we there is a great chance for an uptrend.
On the RSI indicator we can spot a bullish divergence with higher lows.
We haven't retested the massive yellow triangle yet, so we can definitely do it in the immidiate short term.
Your profit target can be end of the wave (1) + retest of the triangle + 200MA.
Look at my ideas about interesting altcoins in the related section down below ↓
For more ideas please hit "Like" and "Follow"!

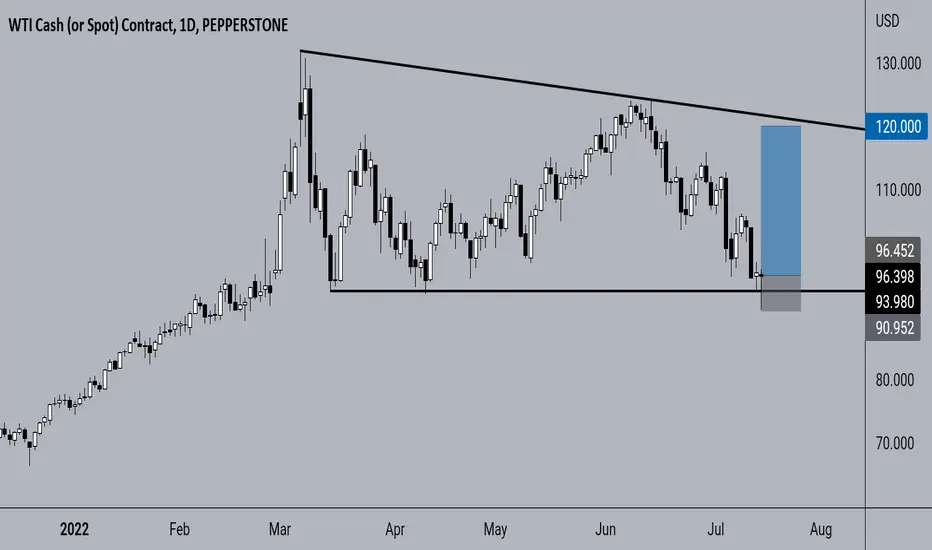
Spot Crude Long 7-14-2022As I had mentioned earlier, this market is trading within a descending triangle and I was waiting for the daily close to decide if I was going to enter or not. Well, today's candle close was a long-tailed doji rejecting support. I am now long and looking for a potential move up to triangle resistance (about 120.000). Other important levels are 105.000 and 115.000.
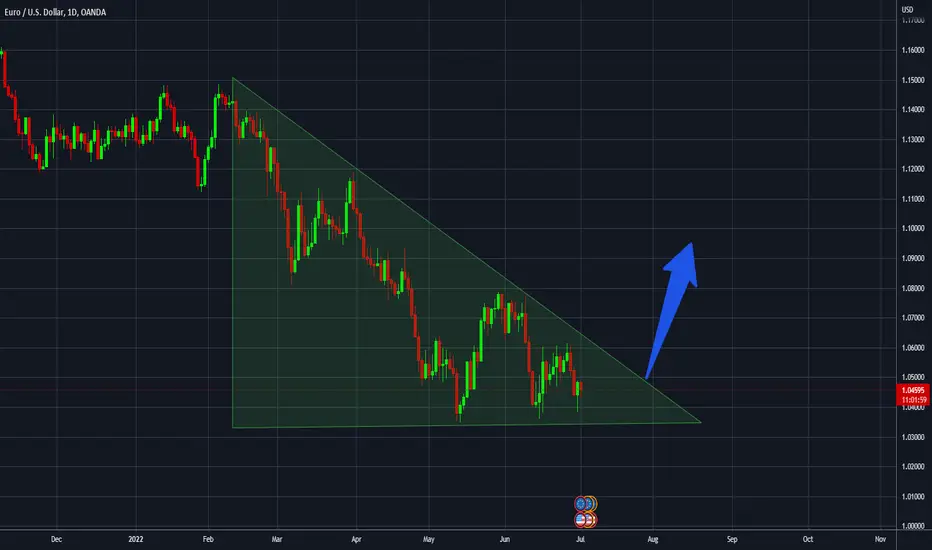
Descending Triangle spotted on the EURUSD D1Spotted a descending triangle on the day chart of the EURUSD. Expecting a breakout to 1.11817 (5891 pips from 1.05866)
ADAUSD - Descending Triangle - SHORTADA is approaching the end of a descending triangle that has been forming since May. I opened a short trade with a target of 0.3874. Stop loss will be set at the 50 day moving average.
Long term bullish for ADA!

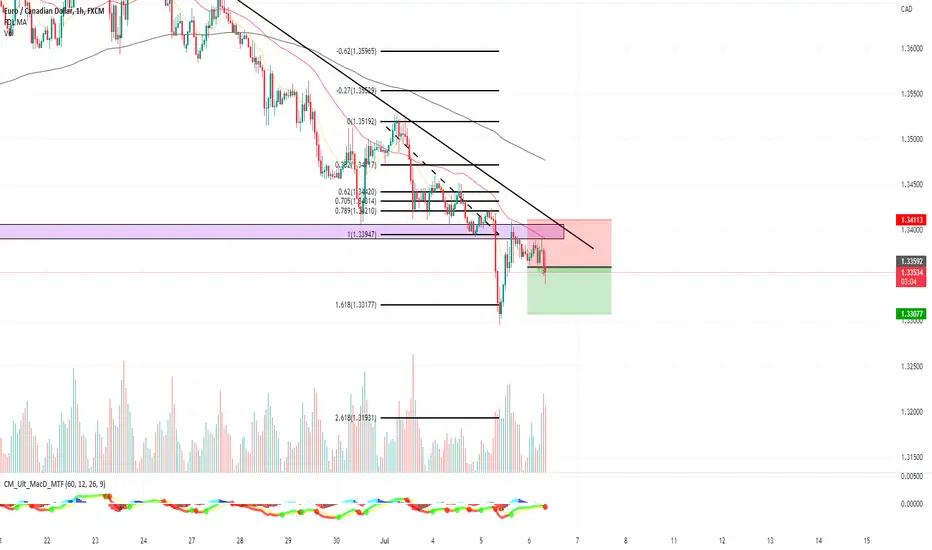
EURCAD Possible SellEURCAD broke Daily support and retested, showing some strenght to the downside, im gonna short from here.
4hr support zone and 15 minute descending triangle!EurJpy: On the left side (4hr chart), you are able to see a support level that was hit multiple times. This support line is an attractive spot for all traders that analyze the chart. This level can either hold and push the price up or break and push the price down. On the 15-minute chart, you are able to see a descending triangle forming. Wait for the triangle to form and a higher high to take place. This trade can also go to the downside. that is if the triangle is broken to the downside which means the 4hr chart wants to break that support line. Indicators on the 4hrs match up with the descending triangle. They want to push the price higher.

BTC.D Dominance - When Alt season? + Elliott Wave + Sym.Triangle- As per my Elliott wave technical analysis on the weekly chart - we can expect a retracement (ABC) in the immidiate short term.
- But in the long term bitcoin dominance should go down and make a new lows.
- We have a descending triangle , which is a bearish pattern (on the weekly chart).
- If you are an Elliott wave trader, please submit your analysis below, so i can check!
- Look at my ideas about Bitcoin, Ethereum and TOTAL crypto cap in the related section down below ↓
- For more content, please hit "Like" & "Follow"!

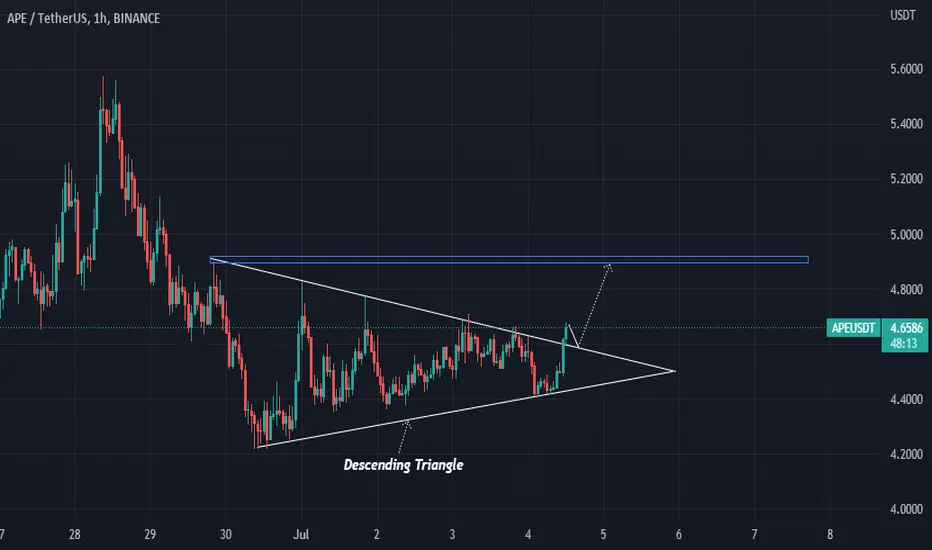
APEAPR/USDT forming Descending Triangle waiting for Breakout on resistance zone and BUY targets 4.900
Is Xem going to be profitable ? 🦬 💰💰 🦬Hi everyone 👋🏽
🕊 Wish y'all have a profitable lifestyle 🍀
📌 XEMUSDT- Daily Time Frame - Heikin Shi
📌 Support zone - Descending trend line - double bottom
📍 xem or nem project is looking a little bit more bullish than other crypto currency pairs, although it has seen a slight 90% price drop since its ATH, I think it is the time to invest carefully in this crypto pair
📍 A possible double bottom along with an important support zone are the reasons that I find this pair bullish
⚠️ However, as you may know the crypto currency world and pairs are so much reliable on BTC and other big coins like ETH, ADA , etc.
✍🏼 I personally think that BTC and other crypto may see a bullish momentum again in the upcoming month so other coins may be seeing pumps and of course bigger pump compared to BTC due to their smaller market cap
⚠️ The following bullish leg is not confirmed yet so any investments in the cycle is so risky right now
THIS IS NOT A FINANCIAL ADVICE
PLEASE DO YOUR OWN RESEARCH BEFORE TAKING ANY SELL OR BUY POSITION
GOOD LUCK
NP TRADER

Msft:Even the giants are falling!Microsoft
Short Term - We look to Sell at 260.71 (stop at 269.78)
The primary trend remains bearish. A sequence of weekly lower lows and highs has been posted. We can see no technical reason for a change of trend. Preferred trade is to sell into rallies. Further downside is expected.
Our profit targets will be 238.72 and 230.00
Resistance: 267.00 / 290.00 / 315.00
Support: 238.00 / 200.00 / 180.00
Please be advised that the information presented on TradingView is provided to Vantage (‘Vantage Global Limited’, ‘we’) by a third-party provider (‘Signal Centre’) . Please be reminded that you are solely responsible for the trading decisions on your account. There is a very high degree of risk involved in trading. Any information and/or content is intended entirely for research, educational and informational purposes only and does not constitute investment or consultation advice or investment strategy. The information is not tailored to the investment needs of any specific person and therefore does not involve a consideration of any of the investment objectives, financial situation or needs of any viewer that may receive it. Kindly also note that past performance is not a reliable indicator of future results. Actual results may differ materially from those anticipated in forward-looking or past performance statements. We assume no liability as to the accuracy or completeness of any of the information and/or content provided herein and the Company cannot be held responsible for any omission, mistake nor for any loss or damage including without limitation to any loss of profit which may arise from reliance on any information supplied by Signal Centre.

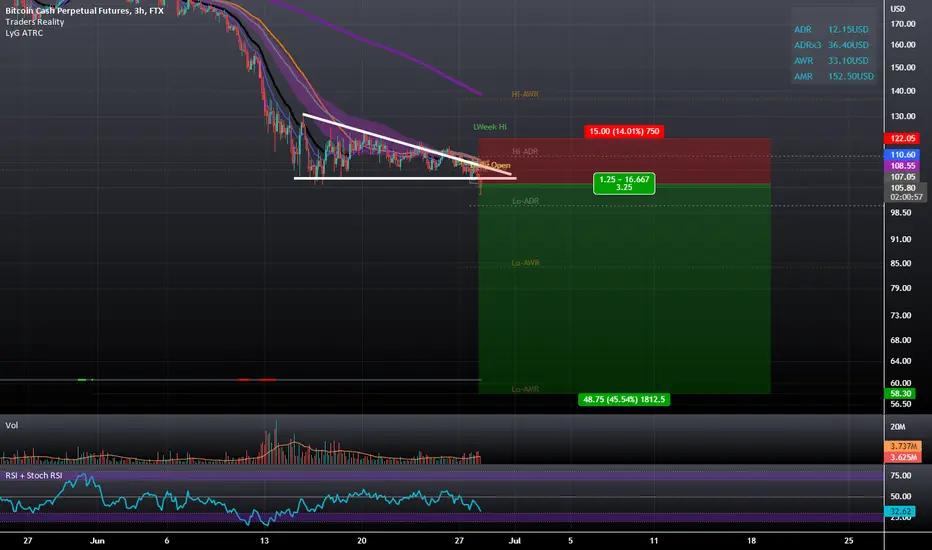
BCH Breaking Down a Descending Triangle and Losing to LitecoinThe LTCBCH pair has been showing signs of bullishness for many months now and in that time LTC has rallied while BCH has gone down and stood still now we see here BCH is breaking down a descending triangle while LTC is still trading near the highs of the rally. I expect that we may see BCH meet Litecoin halfway and come down near the $30-$65 price range as LTC either slowly goes down and consolidates or as LTC potentially goes up and surpasses BCH.
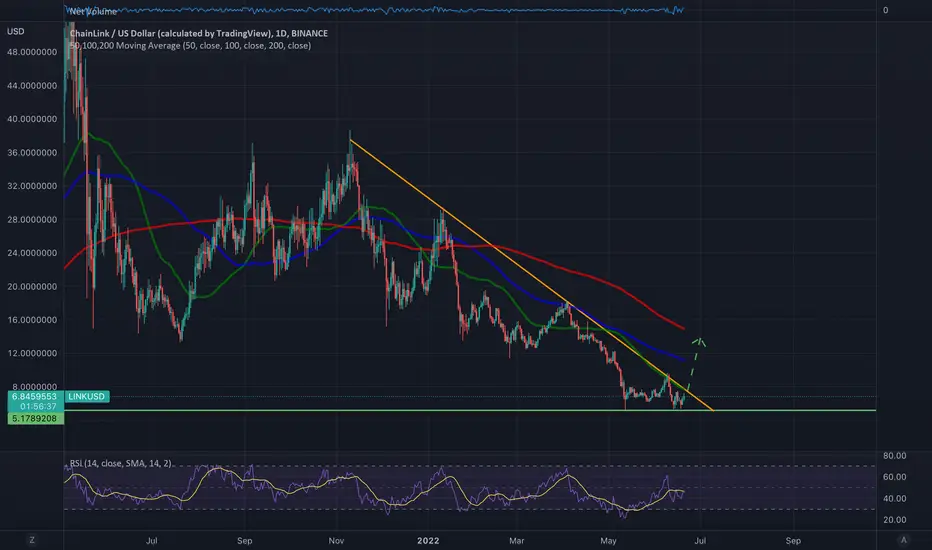
Chainlink's Desending Wedge Setup, will it shrug off macro woes?Will the major altcoins (ADA, LINK, UNI ) descending wedge setups, be the signal for a breakout to the upside?
Or will continuing macro woes make the TA analysis null and void.
Potential bounce might be coming over the next two weeks in equity markets. Spurred by the strong support at the 200 daily moving average.
Time to wait and see.
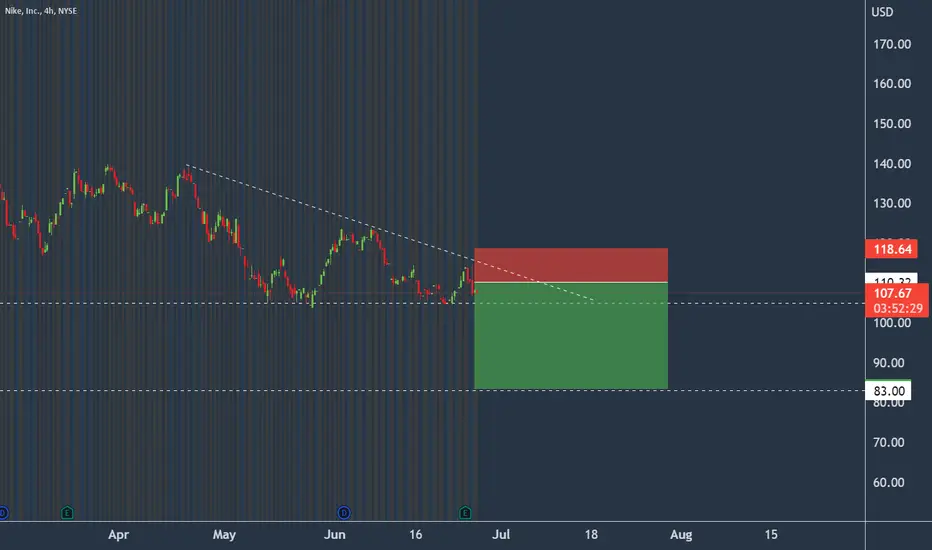
Nike: Air Jordans in murky Asian watersNike
Short Term - We look to Sell at 110.32 (stop at 118.64)
The company built caution into 2023 guidance on fears of more China Covid lockdowns. Trades with a bearish descending triangle formation. The bias is to break to the downside. We look to sell rallies. The measured move target is 83.50.
Our profit targets will be 83.50 and 75.00
Resistance: 115.00 / 120.00 / 140.00
Support: 105.00 / 95.00 / 83.00
Please be advised that the information presented on TradingView is provided to Vantage (‘Vantage Global Limited’, ‘we’) by a third-party provider (‘Signal Centre’) . Please be reminded that you are solely responsible for the trading decisions on your account. There is a very high degree of risk involved in trading. Any information and/or content is intended entirely for research, educational and informational purposes only and does not constitute investment or consultation advice or investment strategy. The information is not tailored to the investment needs of any specific person and therefore does not involve a consideration of any of the investment objectives, financial situation or needs of any viewer that may receive it. Kindly also note that past performance is not a reliable indicator of future results. Actual results may differ materially from those anticipated in forward-looking or past performance statements. We assume no liability as to the accuracy or completeness of any of the information and/or content provided herein and the Company cannot be held responsible for any omission, mistake nor for any loss or damage including without limitation to any loss of profit which may arise from reliance on any information supplied by Signal Centre.
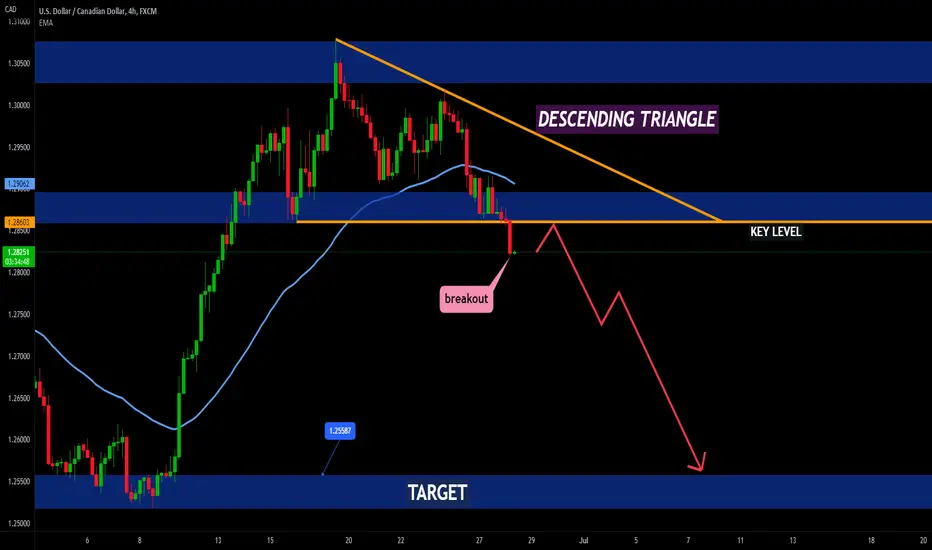
USDCAD - DESCENDING TRIANGLE BREAKOUT 📉the USDCAD price reached a daily resistance level and is in descending triangle pattern .
the key level has broken 🔥 i'm waiting for a retest (sell confirmation)
i predict a bearish move 📉
TARGET: 1.25587 🎯
...
if you agreed with this IDEA, please leave a LIKE, SUBSCRIBE or COMMENT!
ORCL beautiful setupBeautiful descending triangle pattern.
For the downside scenario, price must break below 69 which has been strong.
Below that we might see an acceleration to the downside towards 64
A break above 71.54 could have price moving towards 74
Keep both directions in play

BTC Bearish Continuation - Descending TriangleBTC drops down to around $19,000 after a bearish continuation pattern forms a descending triangle.
Date is 06/18/22

BTC will bottom at 12k, accumulation 12k and 19k, 2025 135kIf we break 20k and flip it to resistance then we will indeed go to 12k levels, where there is big support.
This is possible from fundamental analysis
1. more rate hikes for about three quarters
2. stock market has not bottomed out, there is support coming in, though
3. borrow protocols like celsius and 3ac who needs to be liquidated
4. 4 year cycle respected
Adam and Eve inverted pattern is also very strong, don't underestimate it

Sonova Holding AG bearish scenario:The technical figure Descending Triangle can be found in the Swiss company Sonova Holding AG (SOON.vx) at daily chart. Sonova Holding AG is an internationally active Swiss company headquartered in Stäfa that specializes in hearing care (hearing instruments, cochlear implants, wireless communication). It is one of the largest providers in the sector worldwide. The group operates through its core business brands Phonak, Unitron, Hansaton, Advanced Bionics and AudioNova. The Descending Triangle has broken through the support line on 17/06/2022, if the price holds below this level you can have a possible bearish price movement with a forecast for the next 32 days towards 259.20 CHF. Your stop loss order according to experts should be placed at 351.20 CHF if you decide to enter this position.
Sonova said it had faced shortages of microelectronic components towards the end of the first half. The disruptions to the global economy during the pandemic have upset supply chains across continents, causing shortages of goods and services, including microelectronic components used for hearing aid.
Risk Disclosure: Trading Foreign Exchange (Forex) and Contracts of Difference (CFD's) carries a high level of risk. By registering and signing up, any client affirms their understanding of their own personal accountability for all transactions performed within their account and recognizes the risks associated with trading on such markets and on such sites. Furthermore, one understands that the company carries zero influence over transactions, markets, and trading signals, therefore, cannot be held liable nor guarantee any profits or losses.

BTC Descending Wedge = Bullish (in a normal economy)Very large descending wedge. Watching to see if we rebound here. If 2 candles close below lower wedge line, that gives us confirmation we go lower. Yellow lines are very heavy resistance lines which makes it harder to break upward.
SOL breakout!$Sol broke $35.5 yesterday and is heading down to the next support at $24.4.
That's the first level you need to watch for longs.
I’m expecting the rock bottom at below $20.
Weekend’s moves usually are misleading, so it’s better to wait for a confirmation before place any order.
