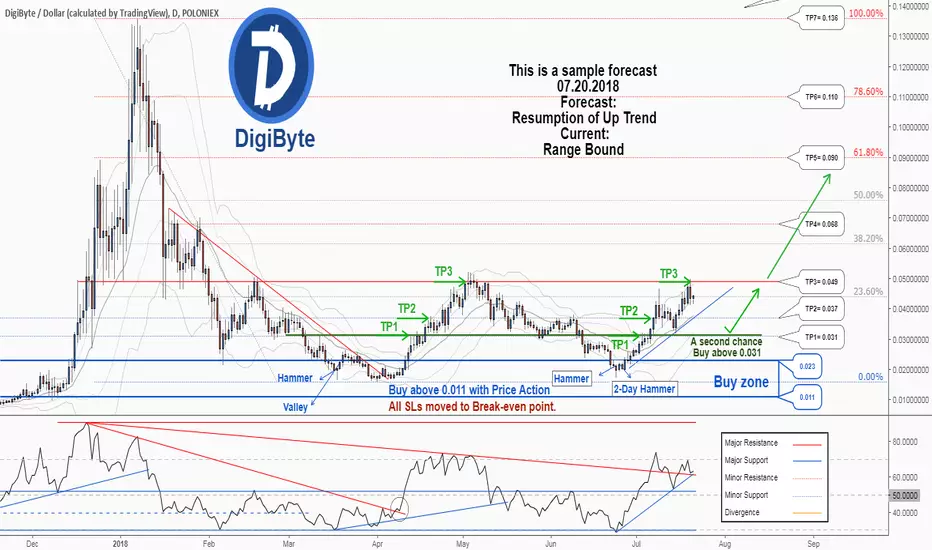
A Second Chance to Buy in DGBUSD ...New trading suggestion:
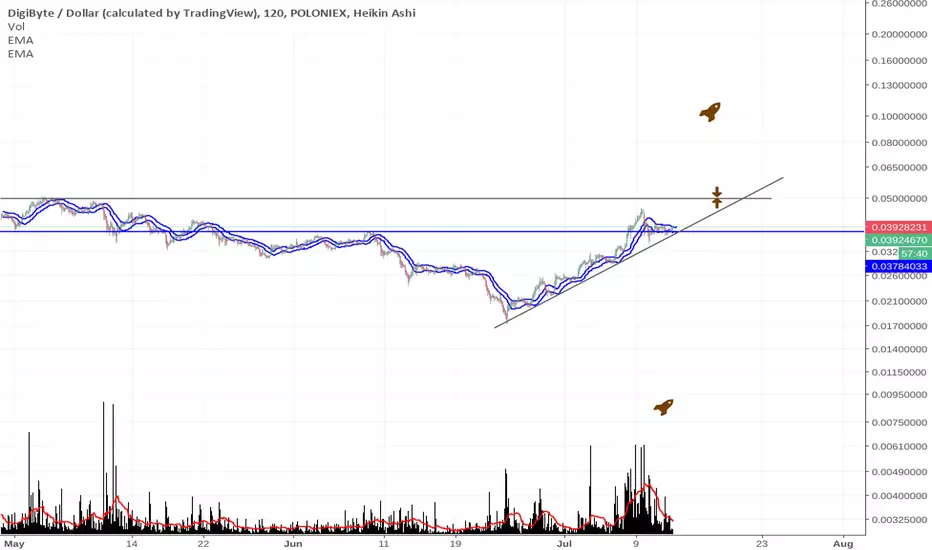
*The price is in a range bound and we forecast the uptrend would resume.
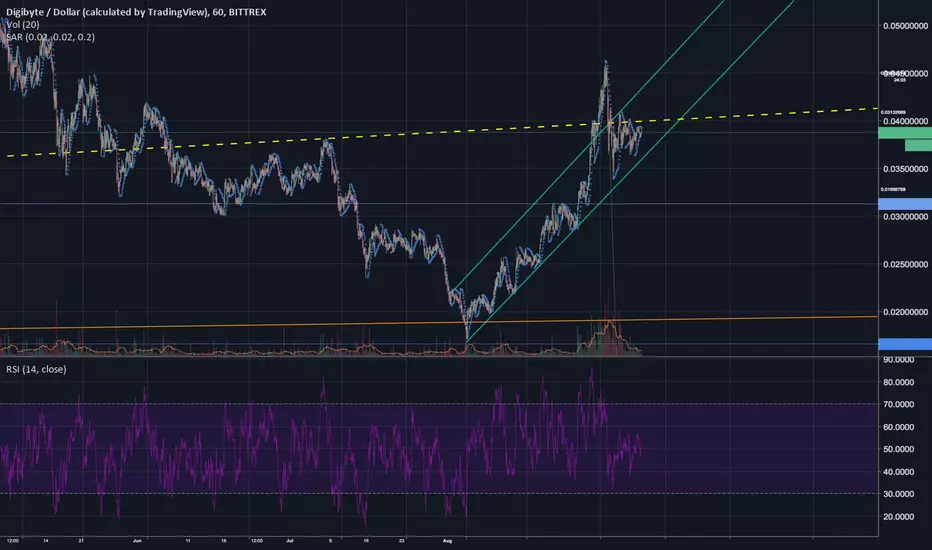
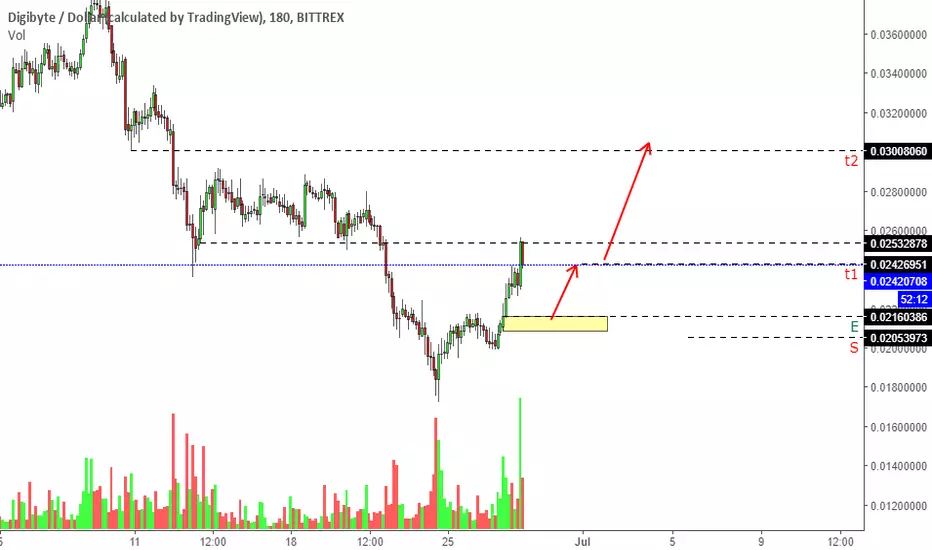
*There is still a possibility of temporary retracement to suggested support line (0.031). if so, traders can set orders based on Price Action and expect to reach short-term targets.
* If you missed our first HUNT, you have a second chance to buy above the suggested support line (0.031).
Entry signal:
Signal to enter the market occurs when the price comes to "Support line" then forms one of the reversal patterns, whether "Bullish Engulfing" , "Hammer" or "Valley" , in other words,
NO entry signal when the price comes to the zone BUT after any of the reversal patterns is formed in the zone.
To learn more about "Entry signal" and special version of our "Price Action" strategy FOLLOW our lessons:
Technical analysis:
Price is aboveWEMA21, if price rises more, this line can act as a dynamic support.
Relative strength index (RSI) is 63.
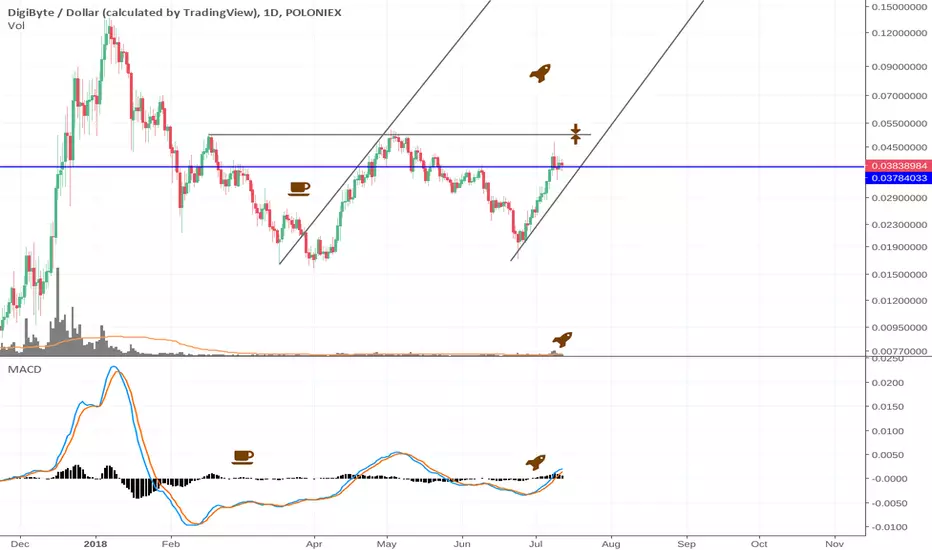
Take Profits:
TP4= @ 0.068
TP5= @ 0.090
TP6= @ 0.110
TP7= @ 0.136
TP8= Free
Trade Setup:
We opened 8 BUY trade(s) @ 0.01985817 (day close price) based on a reversal candle ( Hammer ) at 06.24.2018 in our previous suggested support zone.
Total Profit: 17803464 pip
Closed trade(s): 5742549 pip Profit
Open trade(s): 12060915 pip Profit
Closed Profit:
TP1 @ 0.031 touched at 07.03.2018 with 1114183 Profit.
TP2 @ 0.037 touched at 07.07.2018 with 1714183 Profit.
TP3 @ 0.049 touched at 07.20.2018 with 2027 Profit.
1114183 + 1714183 + 2914183 = 5742549
Open Profit:
Profit for one trade is 0.04398000(current price) - 0.01985817(open price) = 2412183 pip
5 trade(s) still open, therefore total profit for open trade(s) is 2412183 x 5 = 12060915 pip
Dgbusd
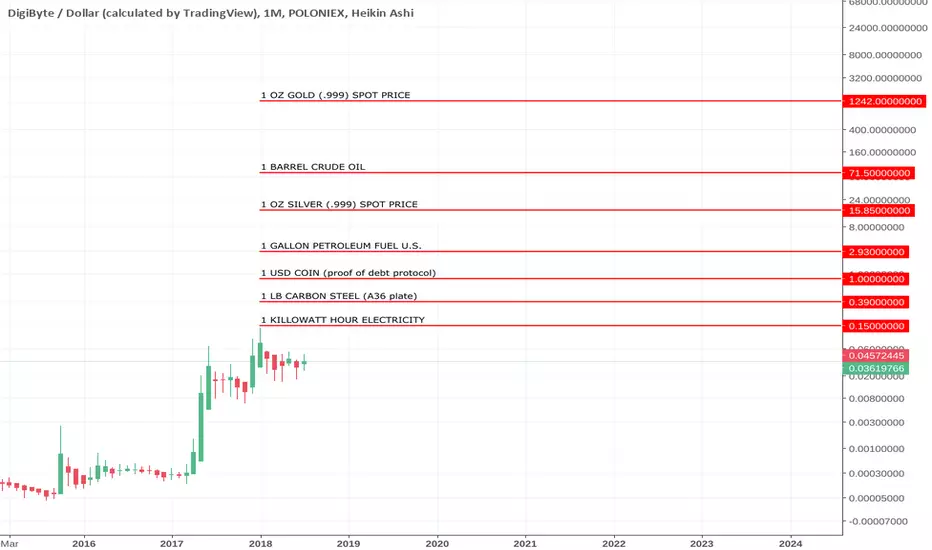
DGB CRYPTO THERMOMETERas a measure of trade, where will digibyte find itself on the scale in the coming years?
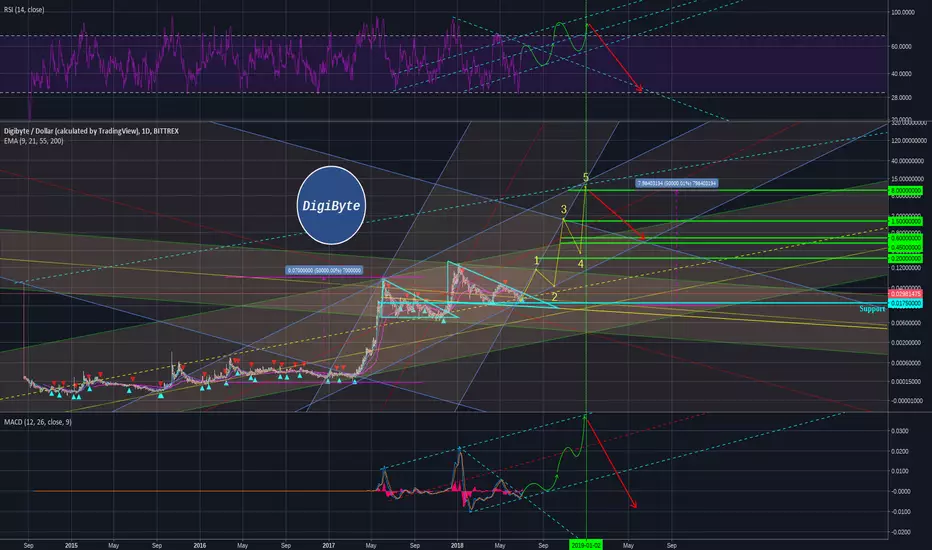
DGBUSD - Digibyte is on the supportDigibyte is in the support area and is on the trend line, there is a good chance to move up.
In the last 24 hours price fell by 8,84 % and it's bigger dump than others crypto. People withdrawed their profits from DGB, thanks to that the price is on the interesting level.


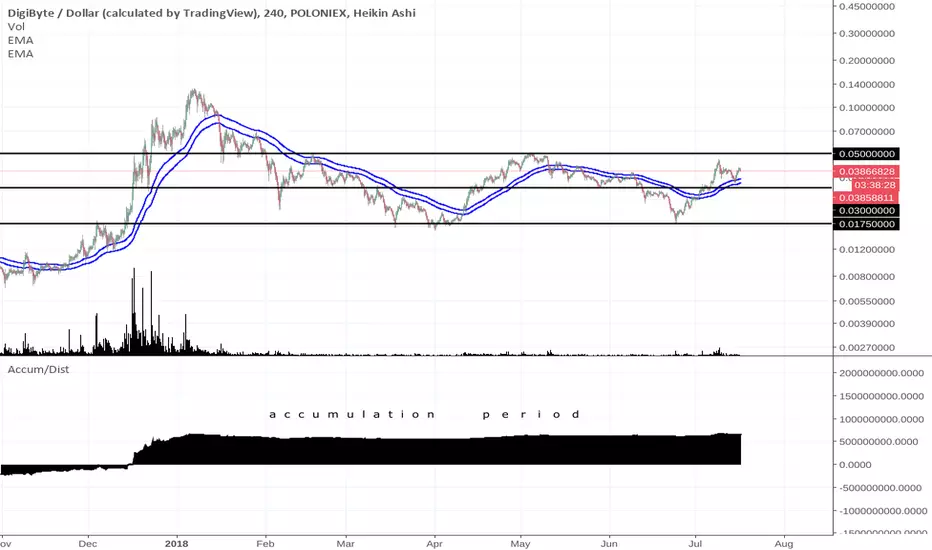
DGB .038 BATTLE ZONEonce resistance, may soon be support
this market is heating up
there can only be so much stealth accumulation before the market moves higher
DGB/USD refreshRefining the idea, looking a different scenarios... targets seems to stay very similar...
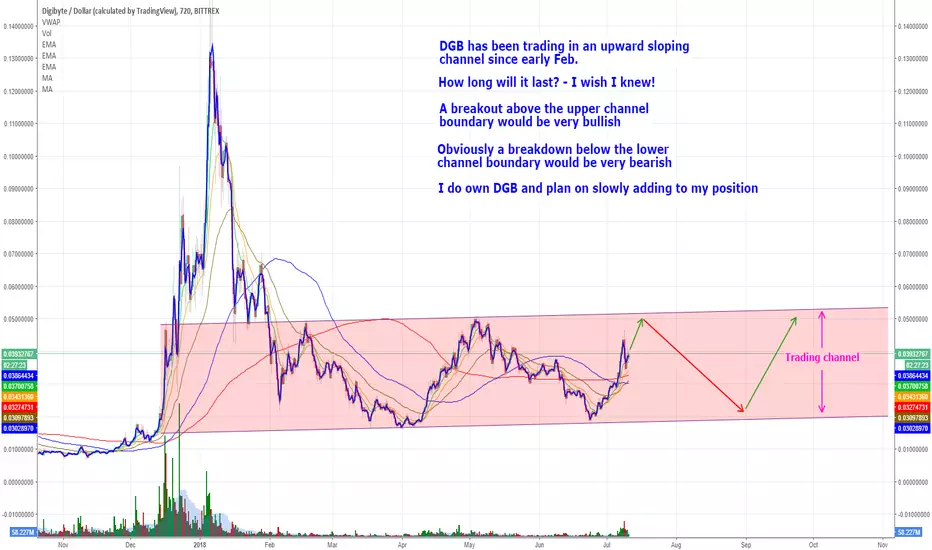
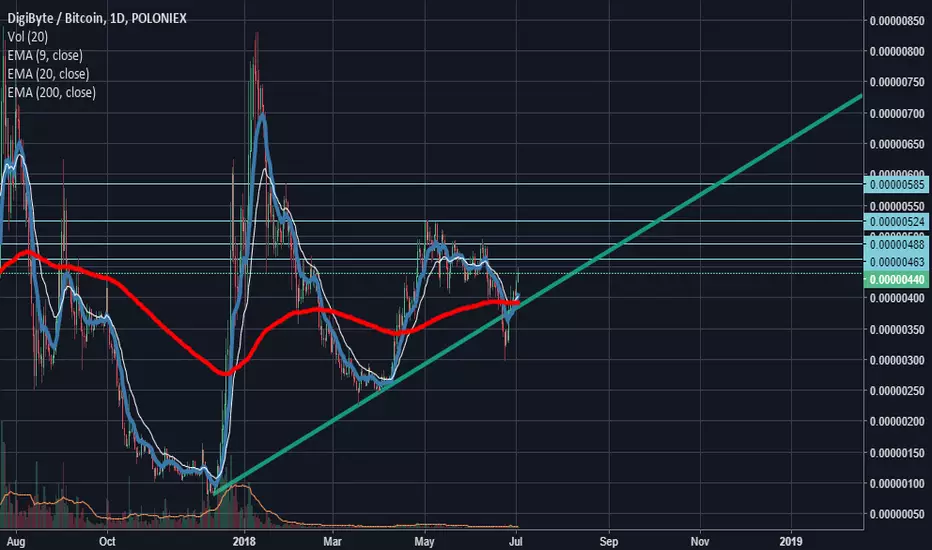
Digibyte - A Bullish TrendHello and thank you for checking out my charts. Although most of my money is invested in the larger market cap. cryptos I do own quite a few other smaller market cap. cryptos also. One of the small cap. cryptos that I am very bullish on is Digibyte. In my opinion, it has been one of the strongest cryptocurrencies as of late, it has shown strength even when many other cryptos were falling, including Bitcoin. I like the price chart which shows that DGB has been in a consolidating trading channel for about six months. To be honest I have no idea how long DGB will continue to trade in the channel, at this point I really don't care as I consider my position in DGB to be a very long-term position (years). I have been adding and will continue to add to my position especially on any pullbacks, ultimately I am looking at a minimum position size of 50,000 to 100,000 depending on future purchase prices.
In my opinion, DGB looks even better when compared to Bitcoin (see chart below), DGB is forming an upward sloping symmetrical triangle and has just pushed above what I see as a pretty strong resistance zone that extends from around .00000500 up to .00000600.
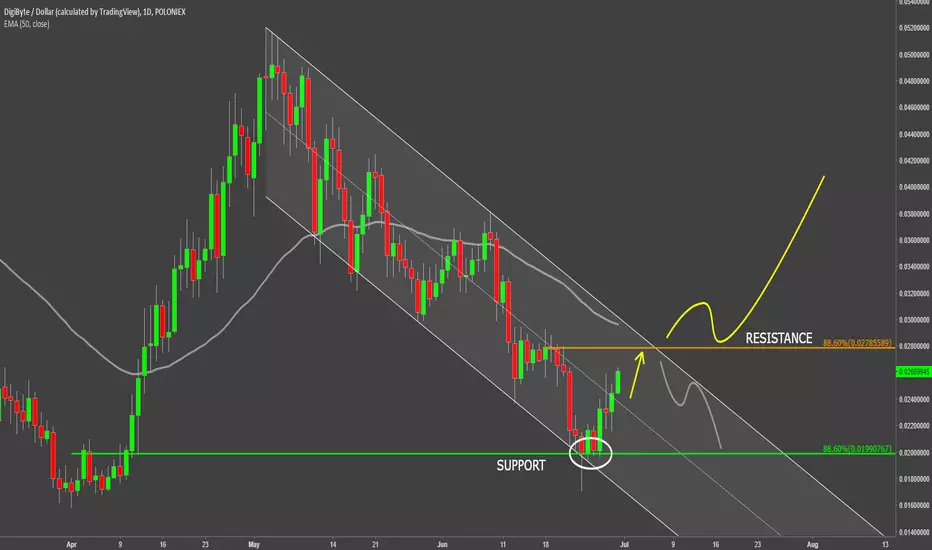
DigiByte Rejecting Support - What Next?Recently DigiByte found the support at 88.6% Fibonacci retracement. It has been trading there for 4 consecutive days, and although it tried to break below, daily close always stayed above that level.
At the same time DGB/USD reached the bottom of the descending channel and for the past 4 days price has been steadily moving up. Now DigiByte is approaching the 88.6% Fib resistance, that corresponds to the upper trendline of the descending channel as well as 50 Moving Average.
So, the $0.027 could be the key resistance level that could help to determine further price direction. Break above should result in the uptrend continuation, although the corrective move down first is likely. But on the other hand if resistance is rejected, DGB cold move down towards $0.02 support to form a double bottom and potentially even lower.
DGB 3H WAVE UPI am not a seller here, but I might add if we see .025 again.
new volume looks like accumulation.
DGB might sprint out in front of the pack as it climbs the market cap ladder.
can't wait to see it pass Zcash, Monero, and the king of fluff Litecoin. Ha!

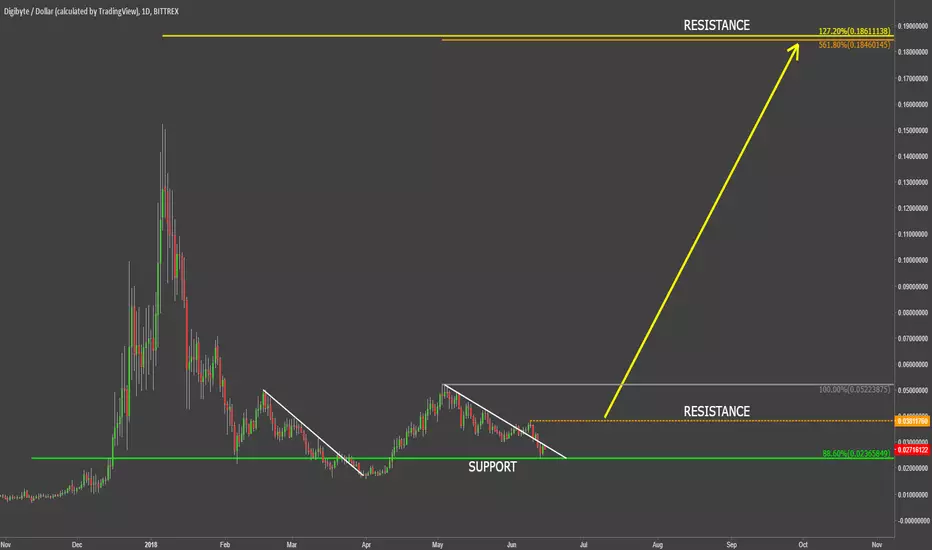
DigiByte Key Support/ResistanceOn the 6th of November, DigiByte did hit the low at $0.022, where it rejected the 88.6% Fibonacci retracement level. Since then price price went down again, producing spikes below the previous low. However no clear break and close below has been established by DGB.
The interesting fact is that DGB/USD is once again tested this level yesterday, and it has been rejected cleanly. Nevertheless, there is also a resistance established at $0.032, where the downtrend trendline has been rejected.
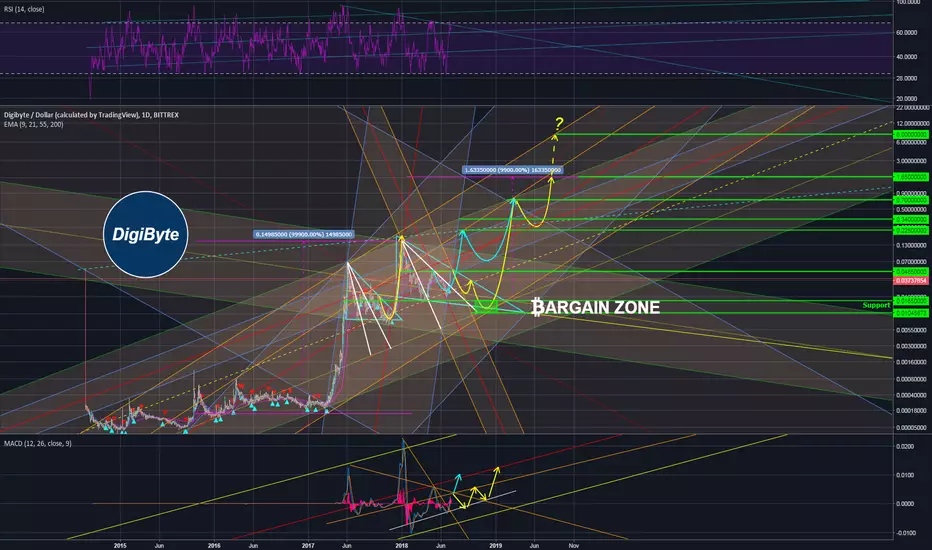
If the support will hold and price will break and close above the $0.038, the change in trend could take place, where DigiGyte could produce a new all-time high. The very strong resistance is seen at $0.185 area, confirmed by the two Fibonacci retracement levels.
On the downside, it seem that break and close below $0.016 could invalidate the potential reversal and the downside pressure would become much more obvious.
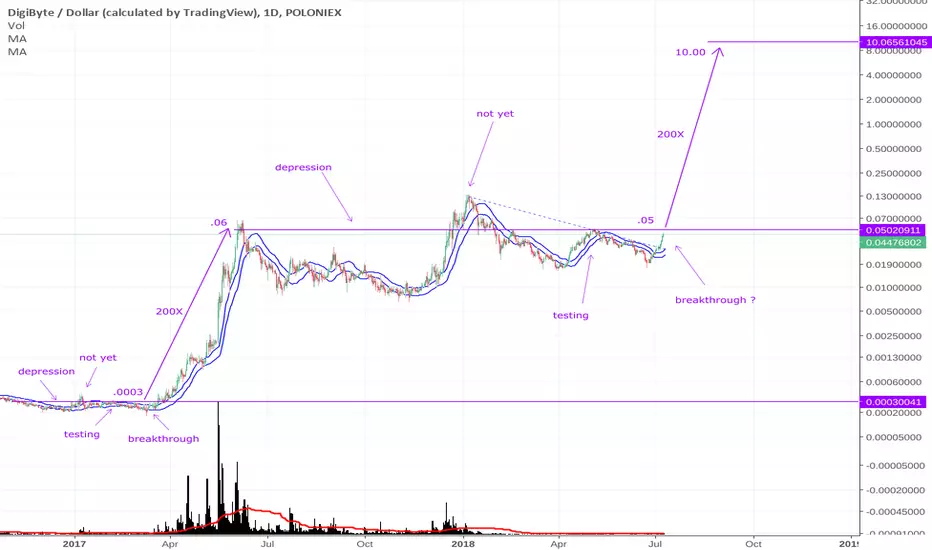
DGB 200X BREAKTHROUGHsimilar patterns to the breakout in 2017.
a considerable amount of time has gone into the consolidation for DGB
it looks like a big move is coming
What is going on with Digibyte?I have an open trade on digibyte.Digibyte pulled some expected moves
not negatively but postively.But I want to know why.What's going on.
In this idea were going to talk about what may have caused digibyte to lit very greenly
is this a sign of a new rally.Why did my other idea on digibyte didn't go as expected.
I was analyzing the weekly chart of digibyte ,I have encounterd something interesting.
What if the we are in the middle of a rally that started in march and now it's finishing the last touches.
That would explain a lot
In this picture you see the elloit 5 waves
The first wave was very short so that's why wave 5 was extended that explains why digibyte was lit very greenly
and do you remember that drop from 500 sats to around 310 sats I do. Do know what caused it?
The correction of wave 2 to was short and retraced not a lot.
It when from 283 sats to 250 sats and compared to the drop from (wave 4) 500 sats to 310 region.
Next time remember when a correction is over very fast and the rally resume you know there is a deep retrace coming.If we resume and this rate 700 sats doesn't sound strange in the ears.Let's see and wait
Taking profits on the way never hurst(mostly)
I will keep you update daily

DGBBTC poloniexBITTREX:DGBBTC Daily chart analysis on DGB.
Take profit on 500 satoshi, buy at the deep at 420, take profit again on 600
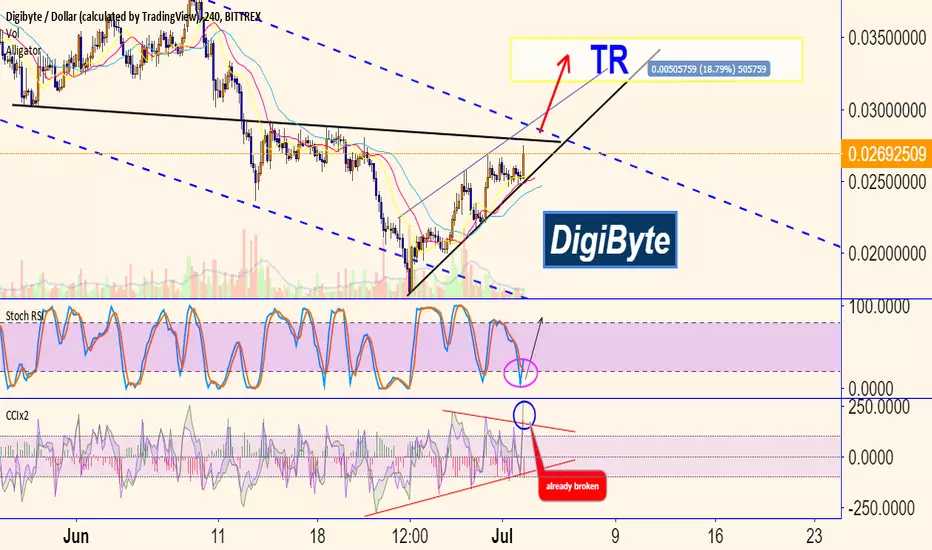
DIGIBYTEDGB/USD look very nice. Stoch RSI's already broken the resistance, waiting the real price-broken! BTC also overcame this lvl.
Target
0.032-0.035
A short term DGB analysisWhat a great day it has been. We're not out of the woods yet IMO. But things are looking swell.
I see confluence with resistance levels that we recently broke through (green line, intersecting with fib level.) A close above that would be somewhat bullish if you ask me, as we re-enter the rising wedge shape. I don't foresee much consolidation given the bull volume on the last few candles that we have seen. But it will consolidate, as we are overbought on the 4h. However, I as a holder I like to zoom out to the daily and weekly preferably, where I can still see much more room for upside before consolidating.
Also, I follow DGBAT on twitter. One of their members made a comment that led me to believe native wallets will be enabled on Abra's mobile app, which would be killer!
Link to tweet: twitter.com
That is my opinion, speculation, whatever, but it sounds good whatever it is! DGB's voice is being heard.
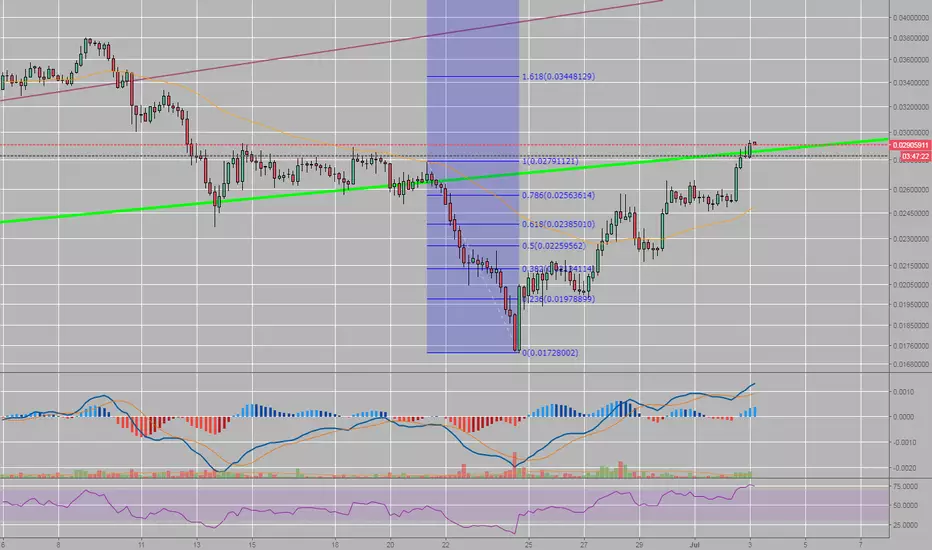
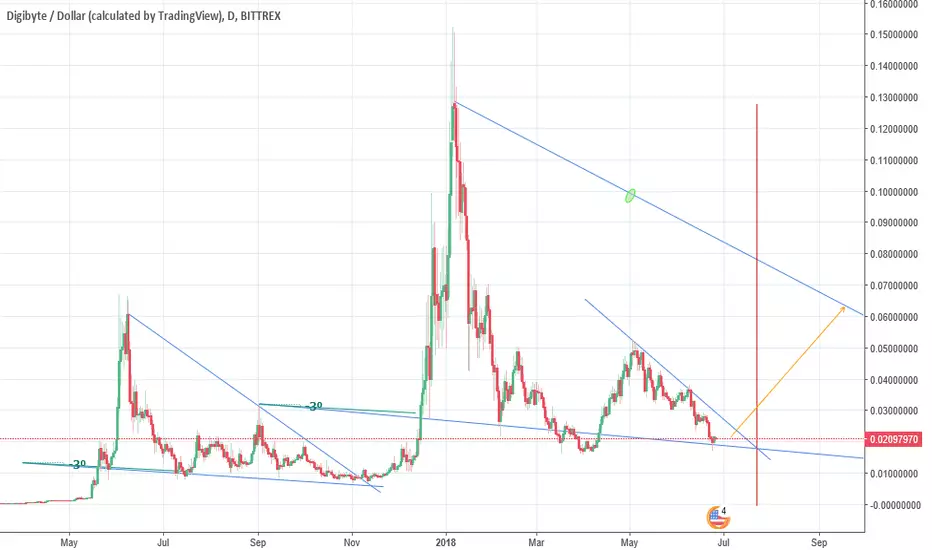
DGB/USDSince we've seen a repeated patern in DGB, I've made the following chart showing when will it moon to +200%. I've elaborated this chart mathematically with parcentages and several calculations. I really think it will be like that so, if it Works, we'll see a PUMP starting on the 03/07 approximately.
Leave your opinions in the comments below.
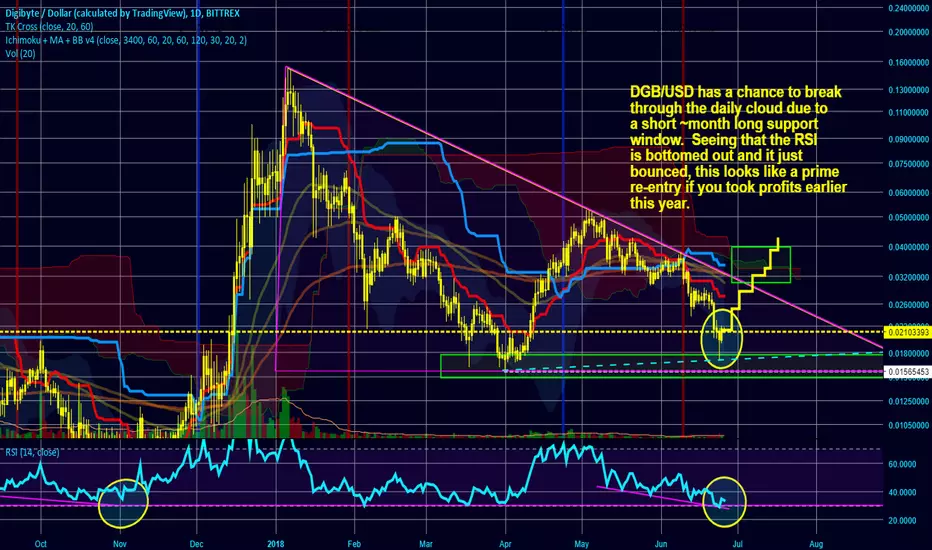
Window for DigiByte to break above the cloud!On the daily chart, DGB just bottomed out on the RSI, and has a month long gap to break out big time do to a short support cloud, despite whatever BTC does. If DGB can rise to ~3.5 cents, there will be no resistance between it and the moon. DGB will likey hit the dollar sooner than later. Please share your thoughts in the comments.
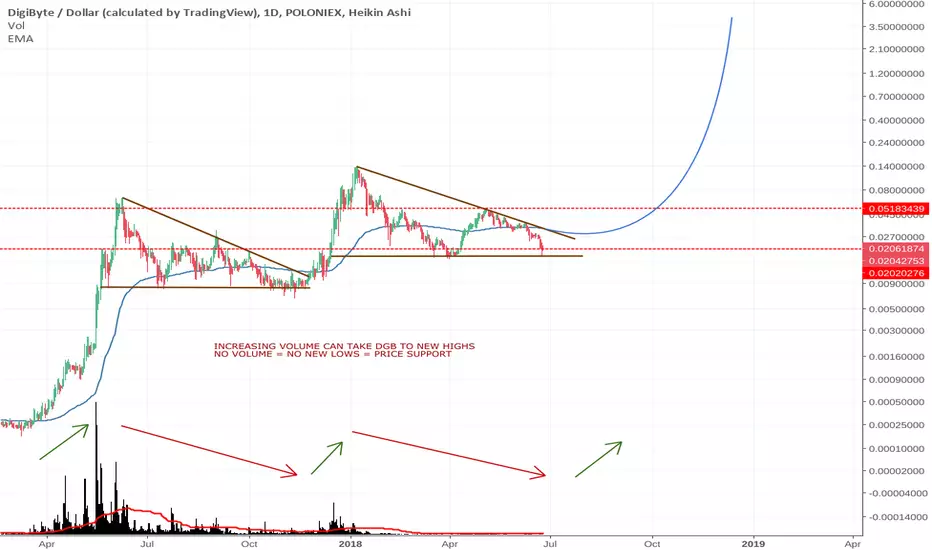
DGB VOLUME AND SUPPORTvolume at all time lows
selling at all time lows
buying pushes the price up at the minute to minute level and will certainly translate to new highs when additional volume comes in.