DGB/USDT — Descending Triangle at a Critical Demand Zone🔎 Technical Overview
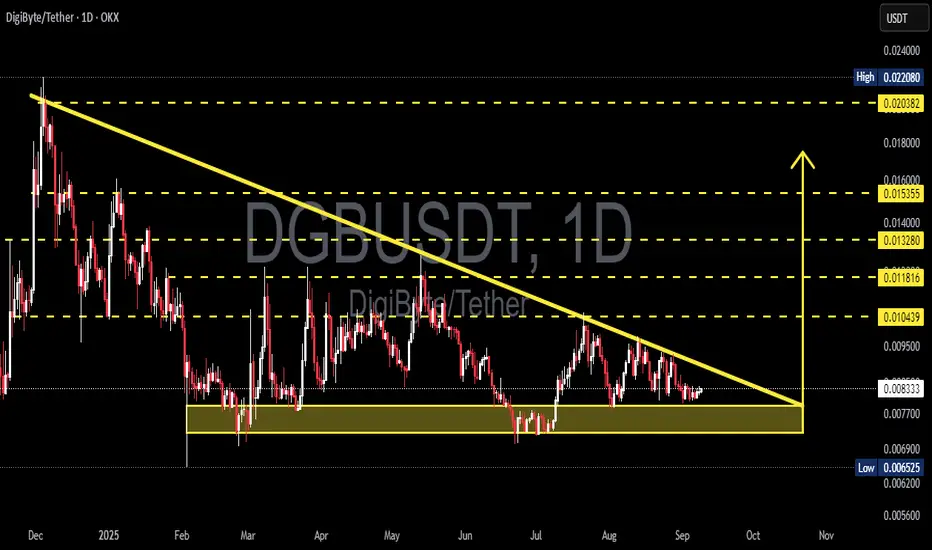
On the daily chart, DGB/USDT is forming a descending triangle, with a clear downward sloping trendline acting as dynamic resistance and a horizontal demand zone around 0.0065 – 0.0077 USDT providing strong support.
This setup reflects a phase of accumulation or distribution, where the market is preparing for a decisive move: either a bullish breakout above the descending trendline or a bearish breakdown below the demand zone.
---
📊 Key Technical Levels
Current price: 0.008295
Demand zone (support): 0.0065 – 0.0077 (yellow box)
Upside resistance levels:
0.010439 → first breakout confirmation
0.011816 → secondary resistance
0.013280 → mid-term target
0.015355 → extended target
0.020382 & 0.022080 → major upside levels if momentum accelerates
---
🟢 Bullish Scenarios
1. Confirmed Breakout (conservative):
If the price manages to close a daily candle above the descending trendline and reclaim 0.010439, bullish momentum is likely to strengthen.
Targets: 0.0118 → 0.0132 → 0.0153
Key signals: rising volume, RSI recovery, strong daily green candle.
2. Bounce from Demand (aggressive):
If price retests the 0.0065–0.0077 zone and bounces, this area may serve as a strong accumulation point.
Stop loss: below 0.0063–0.0065.
Initial target: 0.0104, with extensions to higher resistances.
Risk-to-reward ratio could be highly favorable if the bounce holds.
---
🔴 Bearish Scenario
A daily close below 0.0065 would confirm the descending triangle breakdown.
This breakdown could trigger further downside with a target toward 0.0056 or lower.
After the breakdown, the 0.0065–0.0077 zone would flip into a supply zone (resistance).
---
📌 Pattern & Sentiment
Descending Triangle: traditionally considered a bearish continuation pattern, but in crypto markets, upside breakouts are also possible.
Historical Demand Zone: the highlighted yellow box has been tested multiple times since March 2025, making it a key psychological support.
Market Sentiment: the reaction around this zone and the ability to break the trendline will dictate the medium-term direction.
---
⚖️ Conclusion & Strategy
Bullish play: wait for a breakout above 0.0104 with strong volume (safer) or accumulate cautiously in the demand zone with a tight SL (riskier).
Bearish play: a daily close below 0.0065 signals breakdown and opens the door for deeper declines.
Risk management: always use stop loss and limit exposure to 1–2% risk per trade.
DGB is currently at a make-or-break point. Whether buyers can defend the demand zone or sellers push through support will define the next big move.
---
#DGBUSDT #DGB #DigiByte #CryptoAnalysis #TechnicalAnalysis #DescendingTriangle #CryptoTrading #SupportAndResistance #Altcoins
Dgbusdc
Massive gains are coming to DGB over the next 3 years.Long-term investors of DGB are going to see life-changing gains over the next three years. The vast majority of crypto investors are infected with the 'instant-gratification' disease, which makes them uneasy if they don't turn a massive profit within minutes of buying any given crypto. But that's not how the world works (unless you're incredibly lucky).
The long-term holders of DGB will see gains that the impatient short-term holders will only dream of seeing.
Keep stacking and enjoy the ride!
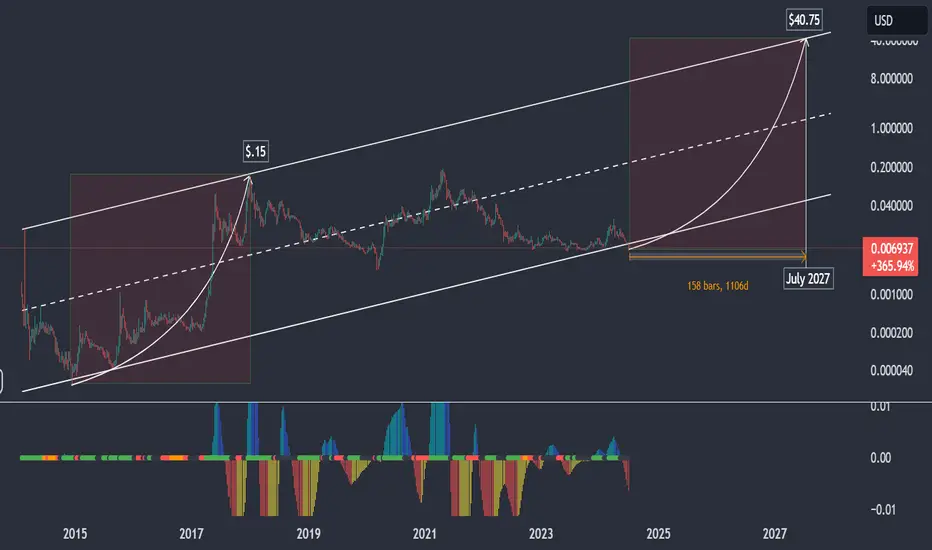
A 50X may be coming for DGB (Digibyte) in 2024/2025.The current chart for DGB (Digibyte) is one of the best looking charts in all of crypto! This coin has a ton of potential in my opinion, and as the dollar continues to deteriorate, cash will be flowing into digital assets faster than you ability to comprehend.
Good luck, and always use a stop-loss!

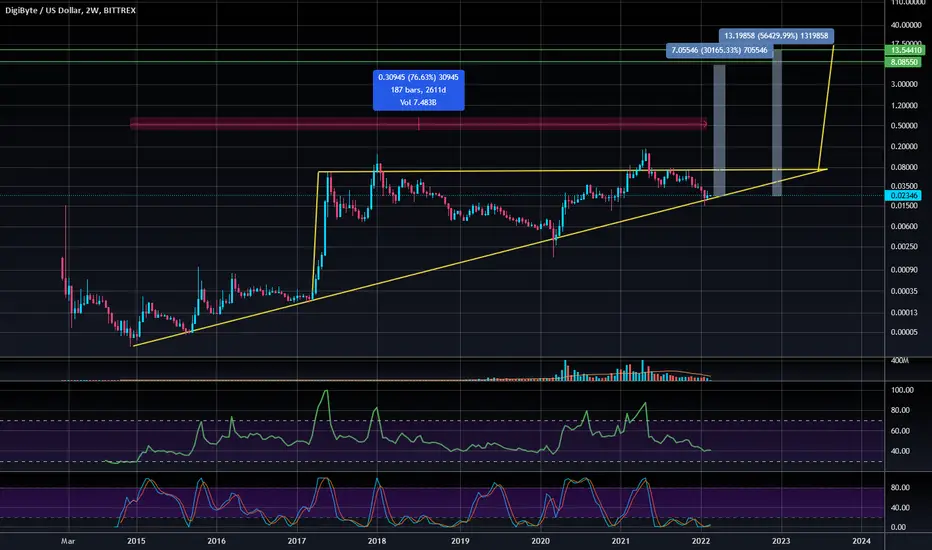
DGB retested 2600 day trend line. x300-500 opportunity (2W)I found interesting trend line on DGB-USD 2W chart that started more than 2600 days ago and recently price retested it again and reversed upwards.
Since bullrun 2017 DGB formed a MASSIVE ascending triangle.I took it's height and put it on the breakout point which brought it to 8-13$.
Also my targets on 8$ and 13$ were measured with FIB retracement before.
From current price gains could be from x100 to x500 if this pattern plays out but it seems that this trend line is pretty important.
This coin did not perform well for the last months but i still tying to accumulate more DGB.
DGB investors could see life changing returns very soon. Patience will be rewarded :)