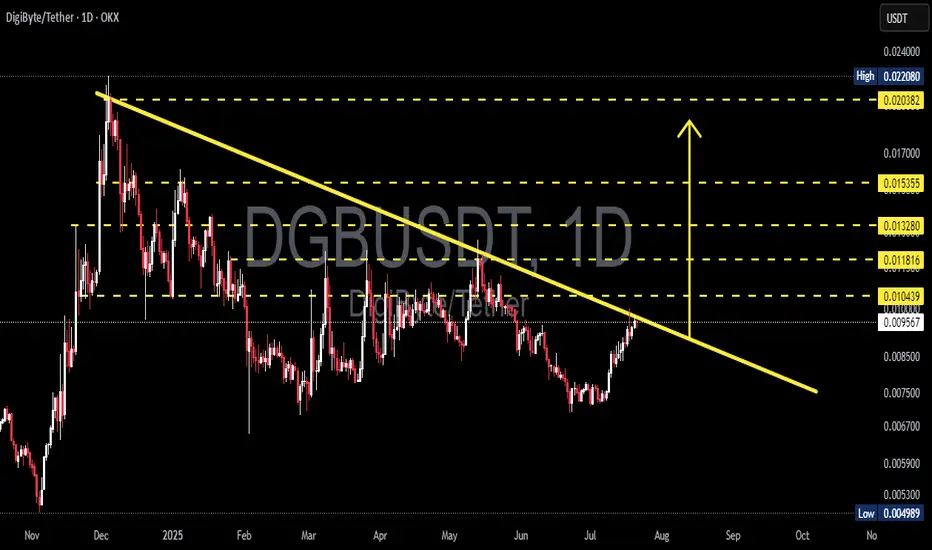
DGBUSDT Ready to Explode? Major Breakout from 7-Month Downtrend📉 Pattern: Falling Wedge / Descending Triangle Breakout
DigiByte (DGB) is currently showing a high-probability breakout from a descending trendline that has held price action in check since December 2024. This structure hints at weakening selling pressure while buyers have started forming higher lows, suggesting potential momentum shift.
🔍 Chart Structure & Key Technicals:
Descending Trendline Resistance (yellow line): Tested multiple times since December 2024. The more often a level is tested, the more likely it breaks.
Breakout Zone: Price is now breaking and retesting the key breakout zone between 0.0095 - 0.0104.
Volume: Gradual increase in volume hints at accumulation by bulls and supports the breakout scenario.
🐂 Bullish Scenario: Breakout Confirmation Could Trigger 100%+ Rally!
If price closes decisively above 0.0104, it would confirm the breakout and open up multiple upside targets:
Target Price Level Notes
🎯 Target 1 0.0118 Minor resistance — initial profit zone
🎯 Target 2 0.0132 Previous structure resistance
🎯 Target 3 0.0153 Major Fibonacci and psychological level
🎯 Target 4 0.0203 Key breakout level from early 2025
🎯 Target 5 0.0220 (High) Full breakout target based on historical high
➡️ A confirmed breakout from this 7-month trendline could trigger a powerful mid-term bullish run.
🐻 Bearish Scenario: Rejection = Downtrend Still Intact
If DGB fails to hold above 0.0095–0.0104 and gets rejected:
Price could fall back toward support zones at 0.0075, then 0.0060
A breakdown below 0.0050 (historical low) could lead to deeper selloffs
Lack of volume on breakout = potential fakeout / bull trap
🧠 Market Psychology & Pattern Context:
Falling Wedge Pattern: A classic reversal pattern signaling that sellers are losing control while buyers prepare for a breakout.
Volume Confirmation: Valid breakouts are almost always accompanied by rising volume. Watch this closely!
Psychological Price Levels: Zones like 0.01, 0.015, and 0.02 often act as magnet levels and take-profit targets for institutions or swing traders.
⚠️ Summary & Strategy:
DGB is currently at one of its most critical levels in 2025
Bullish breakout could deliver 50%–120% upside for swing traders
Rejection = caution, don’t FOMO into resistance
Ideal SL (stop loss) below 0.0090 for breakout entries
📢 Final Tip:
> "Breakouts are only as strong as the volume and candle closes behind them. Wait for confirmation — don’t chase shadows."
#DGB #DGBUSDT #CryptoBreakout #AltcoinAnalysis #TechnicalAnalysis #FallingWedgePattern #BullishSetup #BearishScenario #CryptoTrading #TrendlineBreakout
Dgbusdsignal
DGBUSDT 1W AnalysisDGB ~ 1W Analysis
#DGB Buy back gradually from this support block with a short term target of at least 20%+ from here.
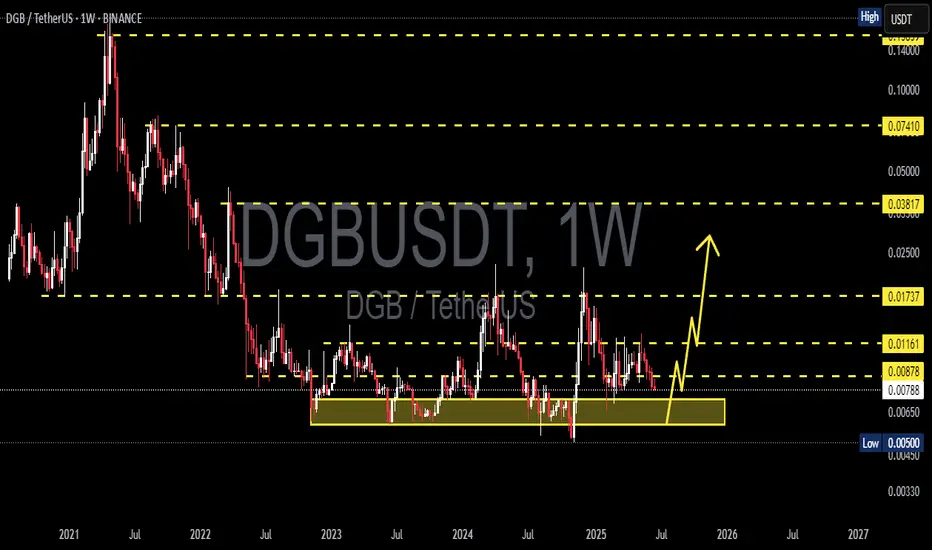
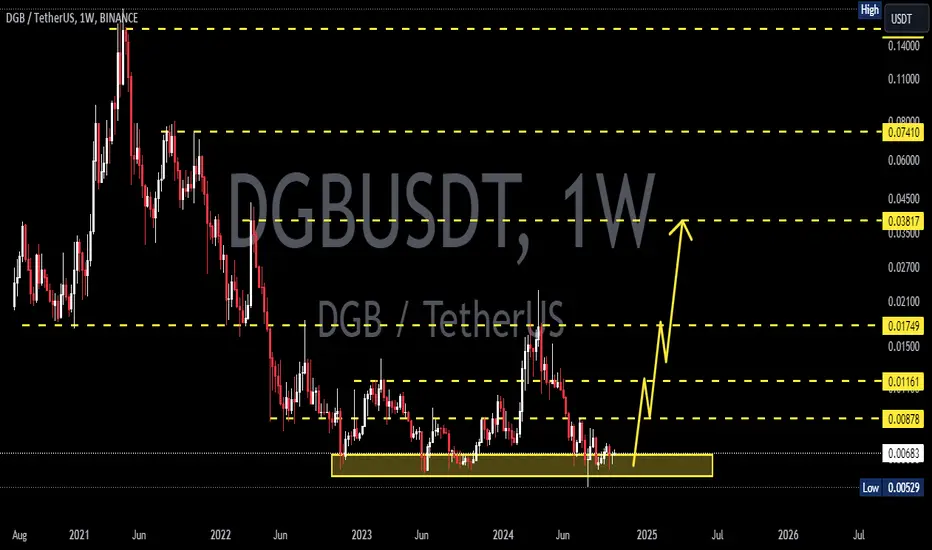
DGBUSDT 1WDGB Update ~ 1W
#DGB So far it continues to maintain its bullish structure. The this block is wave 2 in the Eliot Wave pattern. Minimum target 20%++
DGBUSDTDGB ~ 1W
#DGB Retesting this lowest support block. If you have Conviction on this coin,. This is a great time to buy back.
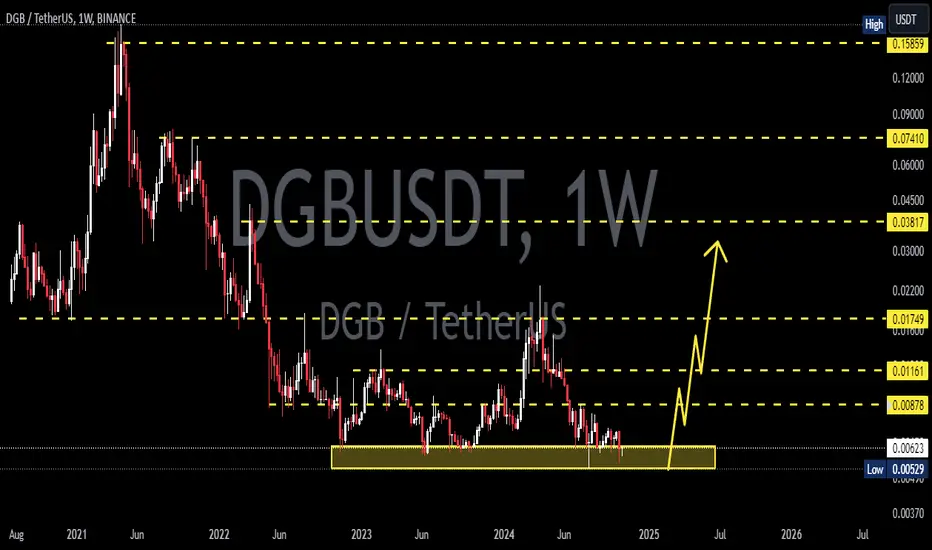
DGBUSDTDGB ~ 1W
#DGB Retesting this lowest support block. If you have Conviction on this coin,. This is a great time to buy back.
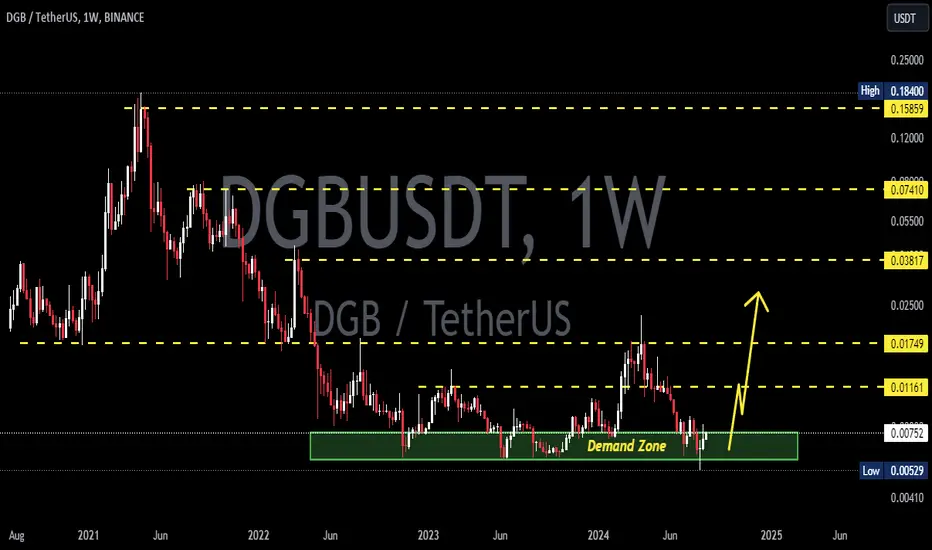
DGBUSDT 1WDGB ~ 1W
#DGB Price maintains this Block of demand zone, It seems that the current price is good enough to start buying, at least for the short 20%+.
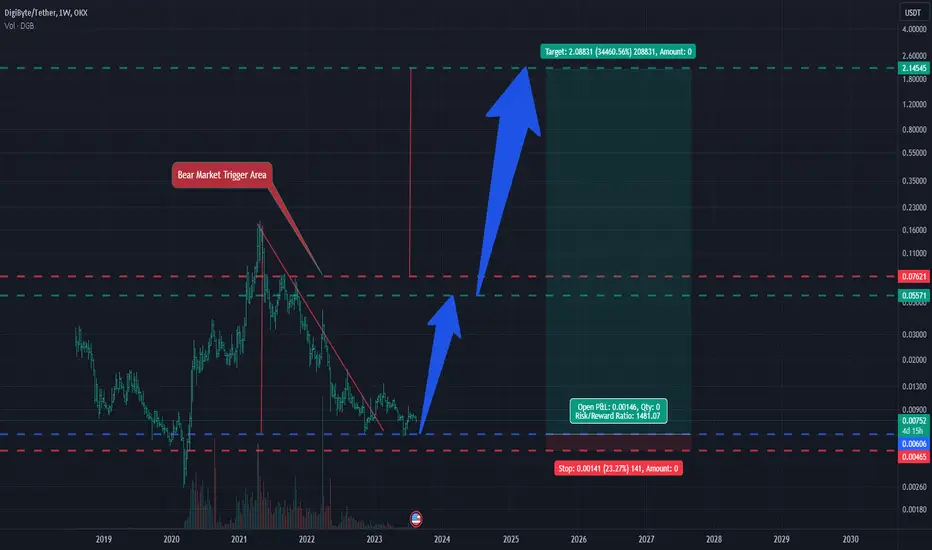
DGB showing a very impressive investment opportunityHi Everyone;
today we have one of the best risk to reward Investment opportunity
it is more than 1480 times the risk and the chart is look very promising.
I expect breaking the previous bear market key point will clear the way to the final target
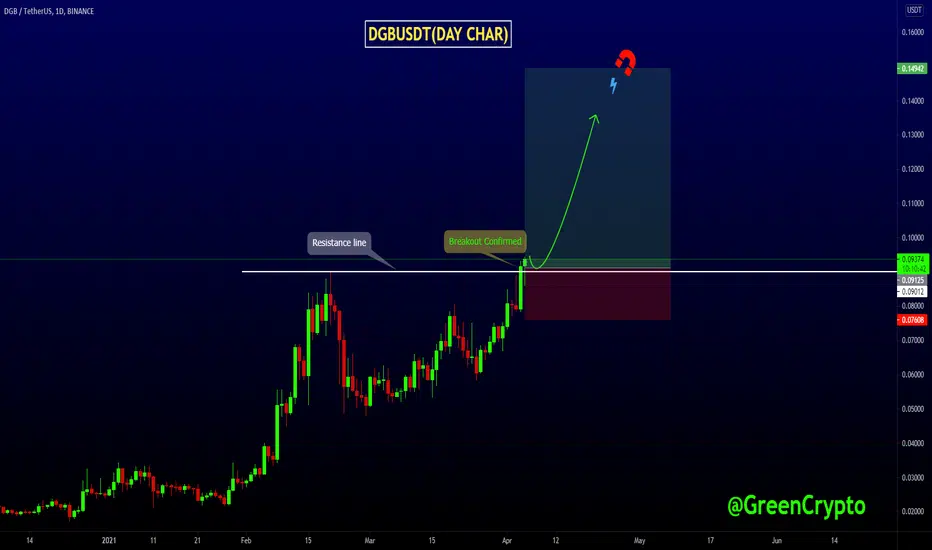
DGBUSDT Breakout Confirmed!! DGBUSDT (Day CHART) Technical Analysis Update
Resistance Breakout in day chart
DGB/USDT currently trading at $0.093
Buy-level: $0.090 -$0.094
Stop loss: Below $0.075
Target 1: $0.110
Target 2: $0.125
Target 3: $0.135
Target 4: $0.150
Max Leverage: 2X
ALWAYS KEEP STOP LOSS...
Follow Our Tradingview Account for More Technical Analysis Updates, | Like, Share and Comment Your thoughts.
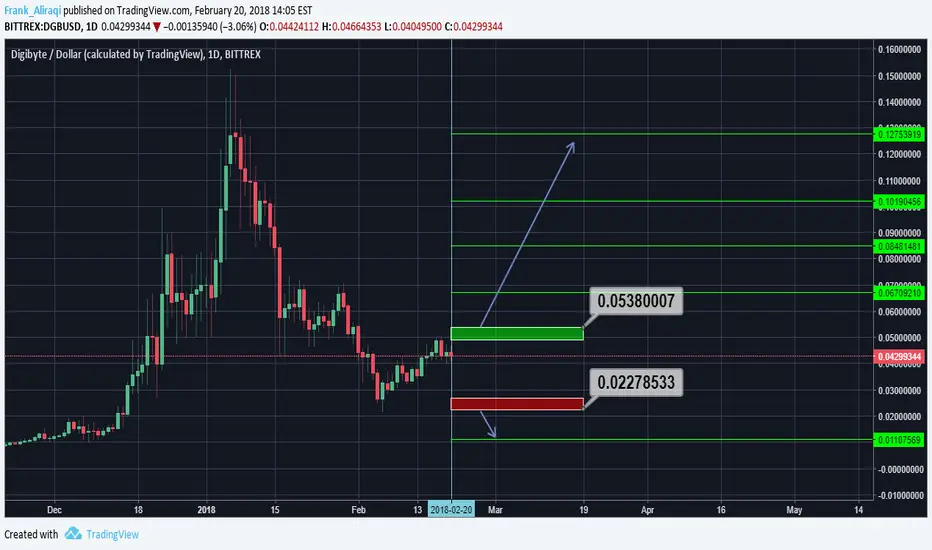
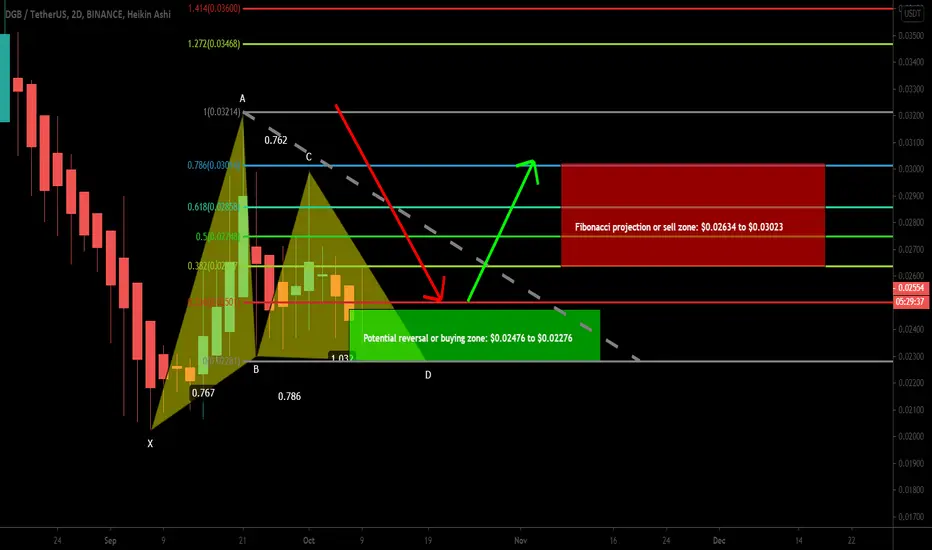
DGBUSDT formed bullish Gartley | Upto 32% move expectedThe priceline of Digibyte (DGB) has formed bullish Gartley on the 2 day chart, the targets as per Fibonacci sequence of Gartley are:
Potential reversal or buying zone: $0.02476 to $0.02276
Fibonacci projection or sell zone: $0.02634 to $0.03023
Regards,
Atif Akbar (moon333)
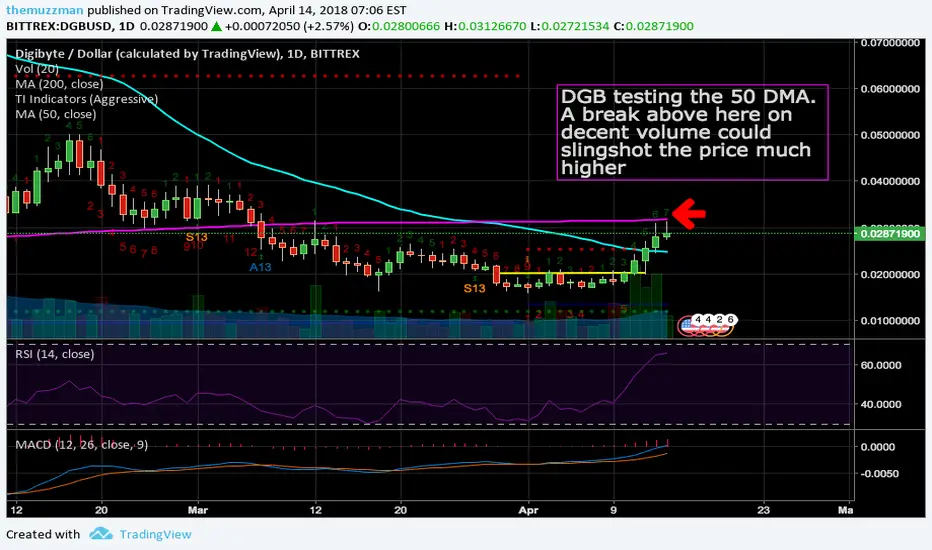
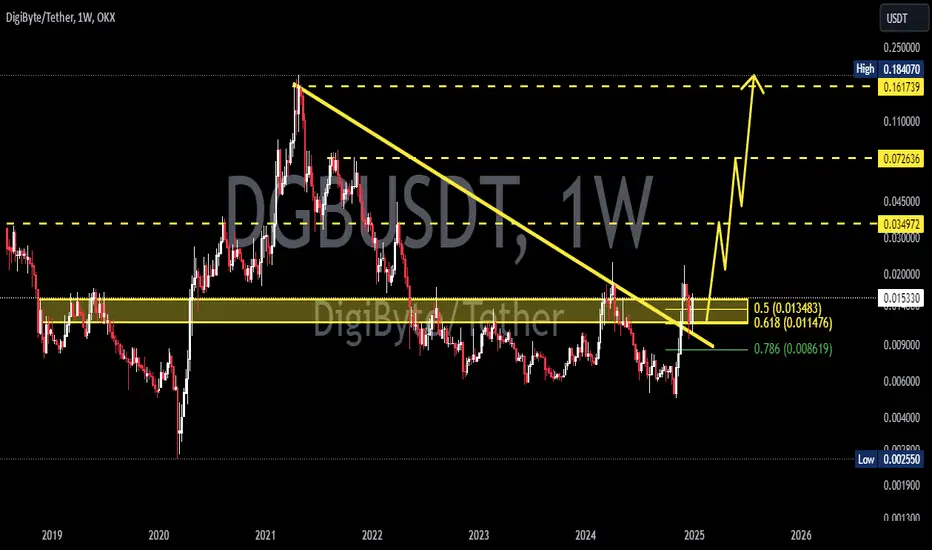
DigiByte Weekly ReviewOverall chart suggests DGBUSD is consolidating above a significant horizontal, with current price action leaning up.
The 50 MA is now pointing up after the long correction since previous ATH.
MACD is still pointing down however, so perhaps this week will see DGBUSD building pressure against the top of the triangle, with next weeks momentum turning up strongly enough for a decisive breakout towards the 160% target we previously set.

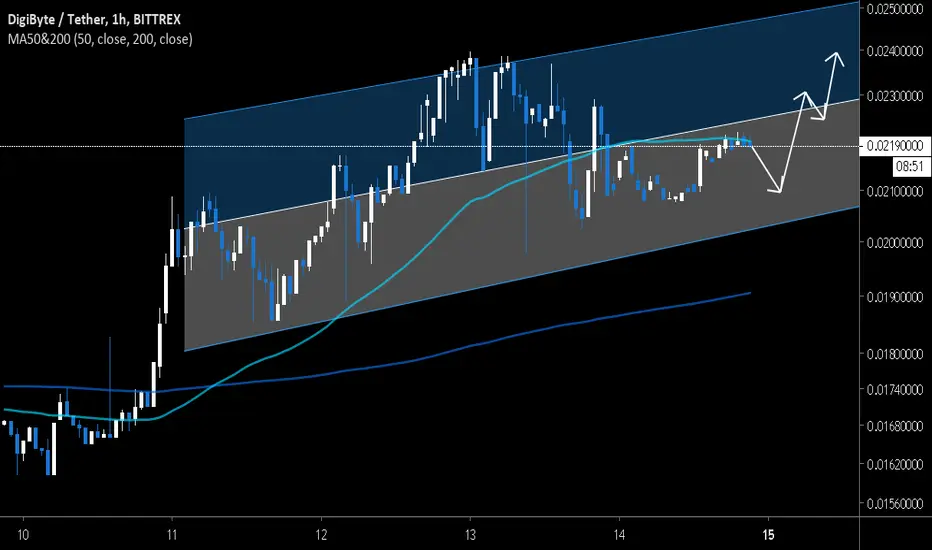
DGB Flirting with the 50 Day. Ready for a major breakout?Digibyte has been testing the 50 day moving average and has been showing relative strength. A break through here with meaningful volume could send the price much higher. What do you think?