DIA

DIA Target 2250. Called 10% decline last week.Called the %10 down last week (See last Idea) and I think we are not done yet. Most tech stocks are still overbought AMD, AAPL. We could get a relief next week but it will be a trap.

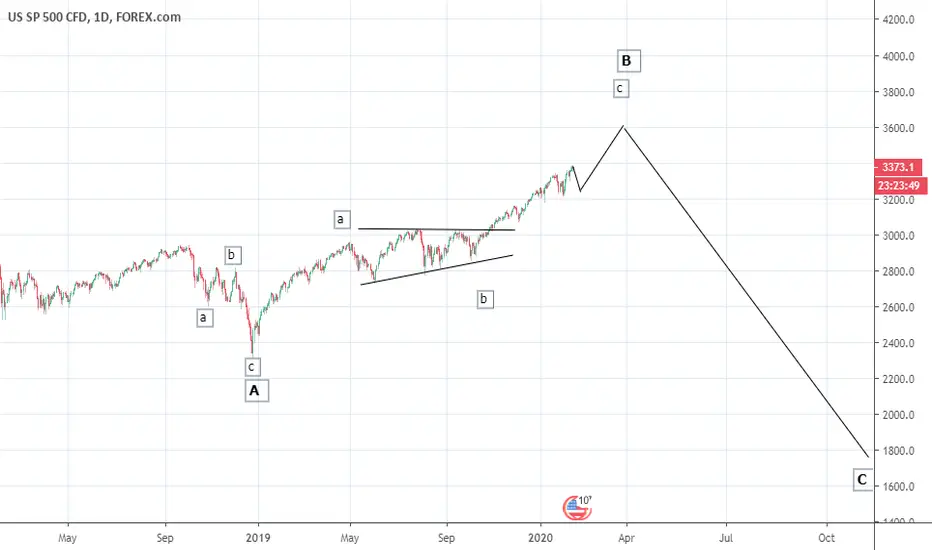
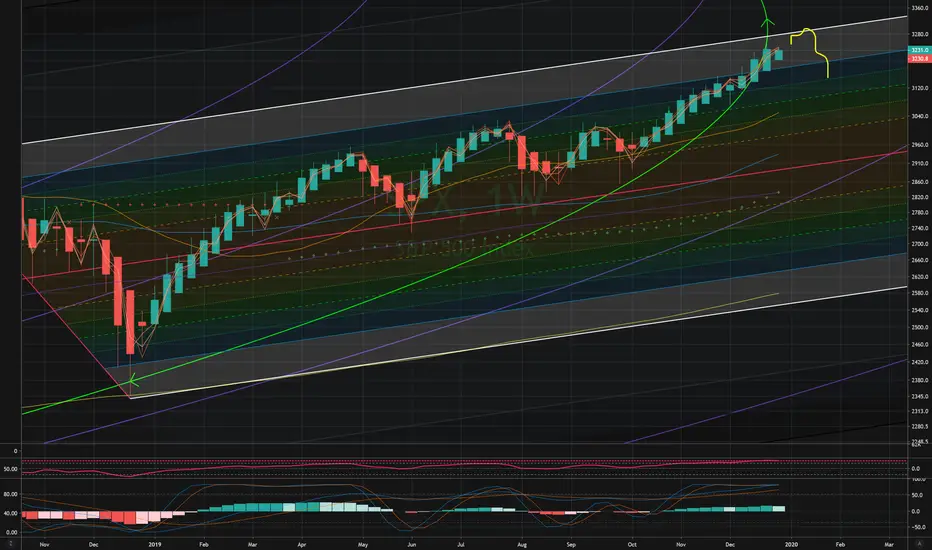
Entering final phase of correction.We formed a triangle after coming out of Dec 18' bottom. A triangle is a warning that we are entering the last wave of a cycle. This is going to culminate in a blow-off top up until April 1st. Expect a crash to follow, that could take us to 17' lows.
Alot of people think we are in a wave 3 of some degree. This is possible but unlikely because of the triangle formation I mentioned. Triangles are only found in waves B and 4 as well as X's.
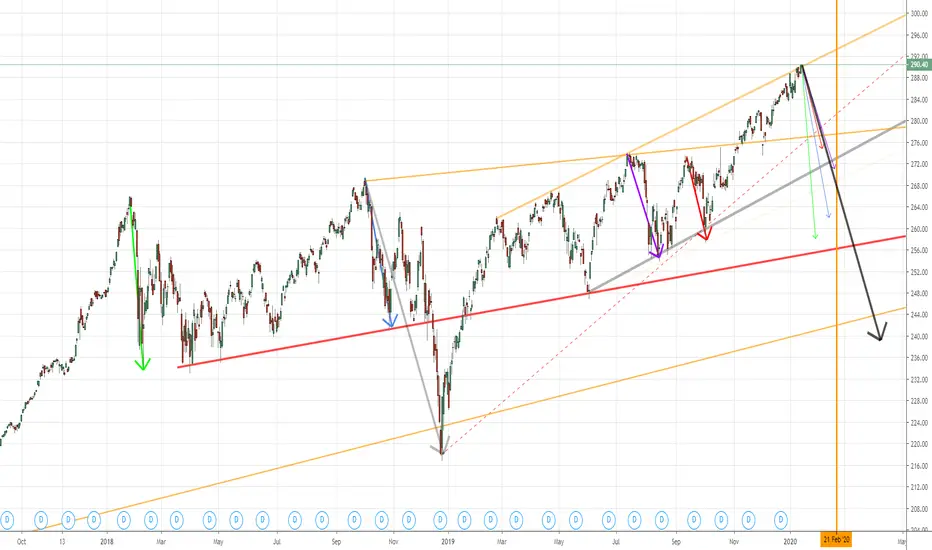
DIA could potentially pulls back further towards 266 supportDIA (SPDR Dow Jones Industrial Average Index ETF) peaked at 293.61 on 1/21/2020. Despite the current pullback, the ETF remains overbought. Further downside is expected. The 266 area near the prior H&S breakout becomes near-term support and target.
Happy Trading!

Alex Vieira Urges Sell Deere to Invest in TeslaDeere downgraded in 2019 to invest in Tesla which became the world's best stock performer as Alex Vieira forecasted

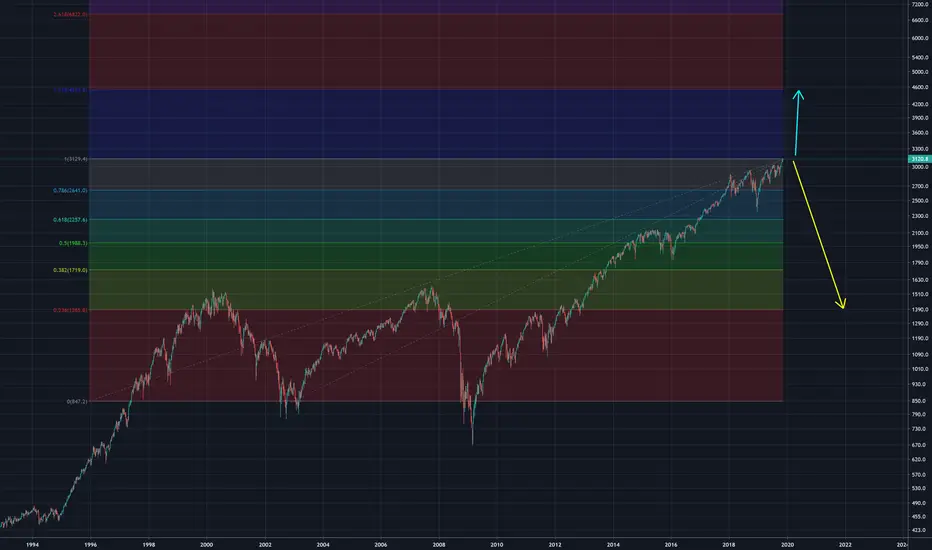
SPX possible retrace points. The market tells you where!Trendlines just work like this... Dont overthink. Look at past trends to see... SPX back to 2950 by march. I wouldnt short until some confirmation. We could go beyond the current fib level (straight up) and get a HARSH squeeze*...

DIA Puts InTaking a fun look at DIA with the retracements of the past to give an idea about the potential next drop.
8:14:01 pm EST Monday, January 6, 2020 Montréal, Quebec, Canadaupdate only to show a negative balance at the moment.

S&P 500 Next Week Expected Move ($44.5) | Broadening Top Short Call - Took an initial short position in several stocks at the end of day Friday. Looking to add more exposure throughout the next several weeks. I don't expect a crash or a recession or anything until late 2021, just a swift and moderate correction at some point in the near future.
Larger move than we've had in many weeks - you can see this by the orange bars enveloping the prior two weeks orange bars.
It's been an exercise in patience these last few months. Finally think the time is ripe for a reversal.
Fear-Greed hit 98 on Thursday, the highest I've ever recorded.
Put-Call is extremely low.
Bulkowski CPI went bearish as of today.
Window Dressing and Santa Claus rally have concluded.
AAII survey elevated and complacent.
Ned Davis sentiment is extremely elevated.
We are in the 3rd standard deviation of the trend , which is where a contrarian investor like myself finds the opportunity.
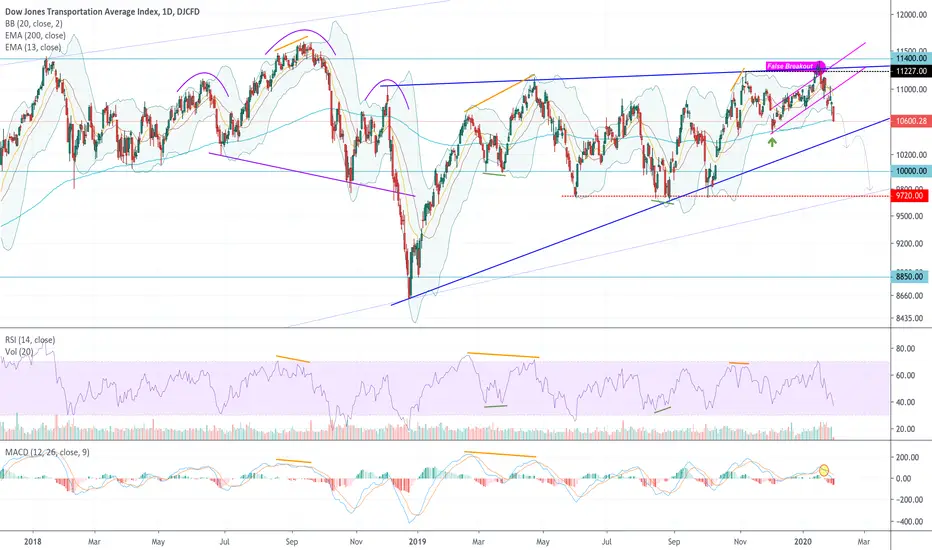
Dow Transports (IYT) is struggling and severely underperforming.
VIX is no longer declining, I believe volatility should increase which is further supported by the expected moves.
Breadth is declining, signaled by Percent of stocks above 20,50,100 day moving averages
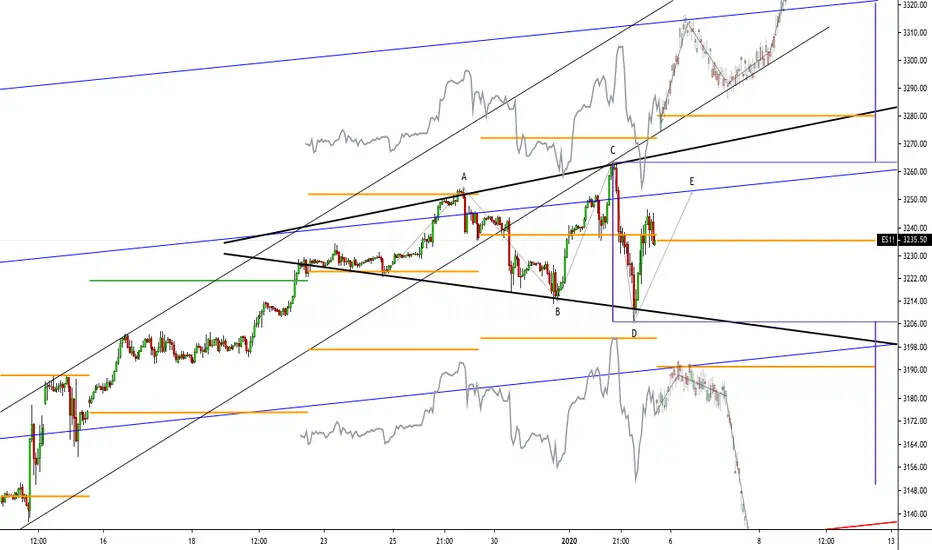
Looks like we have a broadening top formation . I have, in purple , marked the initial target for both outcomes. Broadening Tops have poor reliability, so my ABCDE count might be flipped due to my bearish bias. I've shown how both outcomes should look.
Last Weeks Expected Move: (Excellent week in my opinion)
First Five Days:
seekingalpha.com
January Barometer:
www.yardeni.com
3rd Standard Deviation of Trend:
SKEW:
Breadth Declining:
VIX:
Bonds TLT Perking Up:
Transports:
Initial Claims:
- I recently lost my Investment Analyst job for what it's worth.
PMI: (Disappointing reading but expecting it to pick up)
Goodluck out there next week, please do your own due diligence and don't blindly follow me or anyone's investment suggestions. Everyone is different.
Best to all you traders and wishing you a tremendous 2020.
- RH
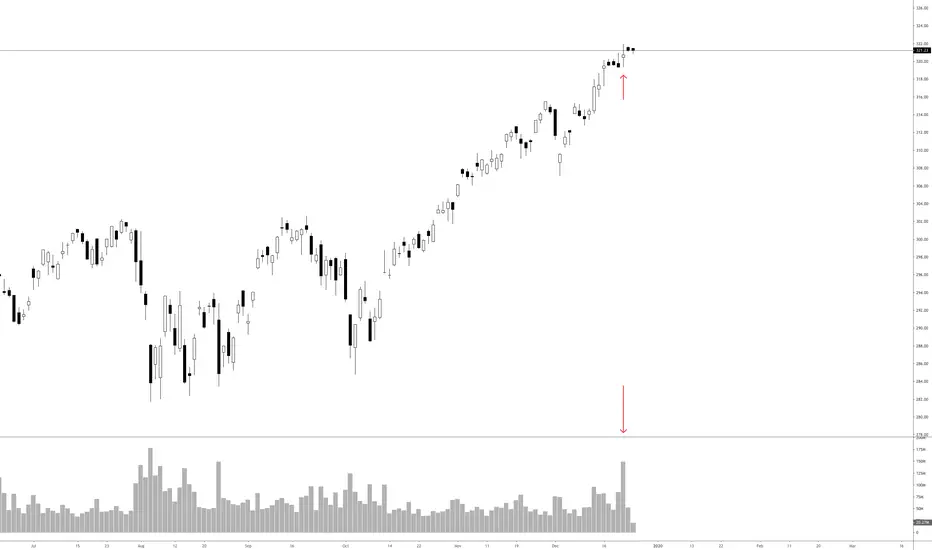
DIA Gaining position for Long Jump - DIA Gaining position for Long Jump - but past experiance is to book profit at 30 to 50% profit gain

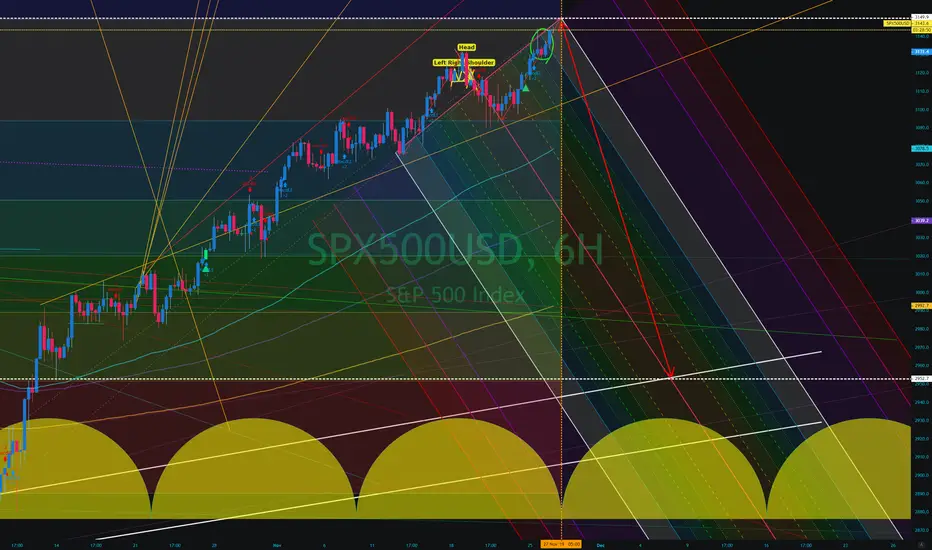
Almost there.. Do not short yet! US INDICIESEverything is on the chart. We will go to the white fib line in the pitchfork (1 FIB) at the very least. WHY?
Fed is injecting a record ~430B$ into this "NOT QE" repo market in January. I expect the first two weeks (at LEAST, maybe all of JAN) of January to rocket up as a final push and then a breakdown. Unless the Fed continues to inject more and more cash into the markets beyond january, this could be the end.
Devils advocate:
T has an election coming up in 2020 and the only solid thing he has to run on in my opinion is the market performance. So there is a good chance this REPO crap will continue all the way THROUGH november+ until there are some serious riots in the streets. He wont let a market tank on him before elections unless he is forced in a corner by others... Just my opinion.
Please thumbs up and comment what you think! Happy NEW YEARS!

Montréal, Qc, Canada UTC-05:00 4:48 PM Monday December 30,2019Hello
Only one day left before 2020.
This is just an update.
Thank you.

SP500 (SPY) Be careful.All description on the chart.
Please, don't forget to like and follow.
Thank you.
S&P Next Week Expected Move ($27.5)Melting up. Next week shaping up to be a fairly boring neutral holiday week.
Goodluck Next Week
- RH
Recent Charts Worth Watching:
Unemployment Rate:
Bitcoin:
EM relative strength:
Value > Growth:
SKEW:
Bonds:
REPO:
VIX + VVIX:
VIX vs. VIX3M:
Industrial Production:
tradingview.sweetlogin.com
Homebuilders:
Regional Banks:
China:
Emerging Markets:

Humpty Dumpty had a great fall.Its here.. Look at the chart. Its pretty self explanatory...
Please like and comment!

All major indices are bear flagging on the 4h chartBaring a false new.s or hope on trade with China, this is going down.
Just my opinion....

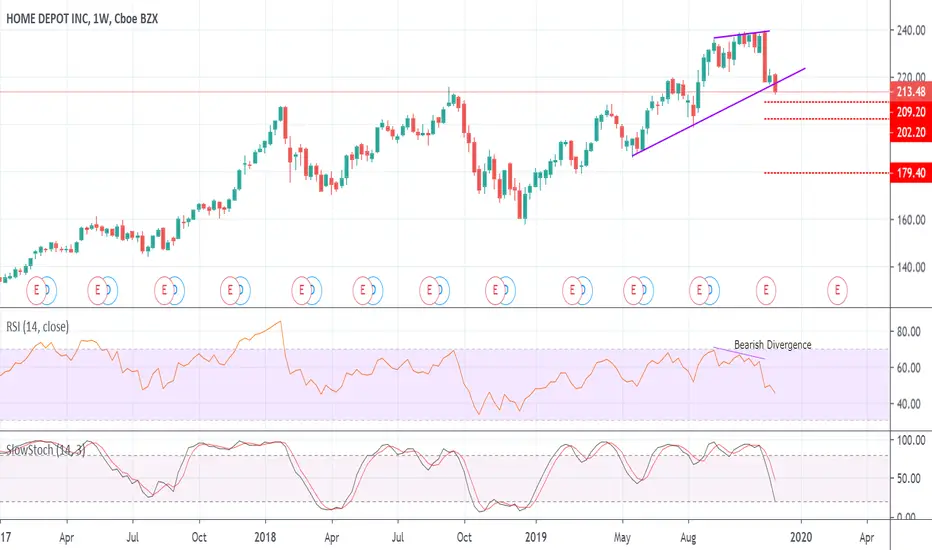
Home Depot Bearish Divergence Playing OutHD weekly chart had a bearish RSI divergence. The stock started breaking down on November 18th & has broken down through the support trendline this week as it nears the first potential pullback level.
There is a lot of call activity in this name today in the January 3, 2020, $230 calls.
SnP500/DIA/NDX idea - Happy Thanksgiving!I believe we are about to go down after this repo ends... Or really just because TA says it is likely in the chart ;)
Who knows! I just know this turkey is fat, and bears need food before hiding away for the winter! Red December makes a merry Christmas!
-Good luck - dont do this. Its probably wrong!
I am bullish on ZGold and Zbitcorn!
Are small caps telling us something?Disclaimer: The above is just an idea for your entertainment, not a trading advice!

US Markets - To the 1.618 Extention OR NOT? This is the QUESTIONWith everything going on, rates are what they are... And other things going on..
What do you think? Comment below and why!!!