DIA/USDT — Golden Pocket Battle: Accumulation or Breakdown?🔑 Key Highlights
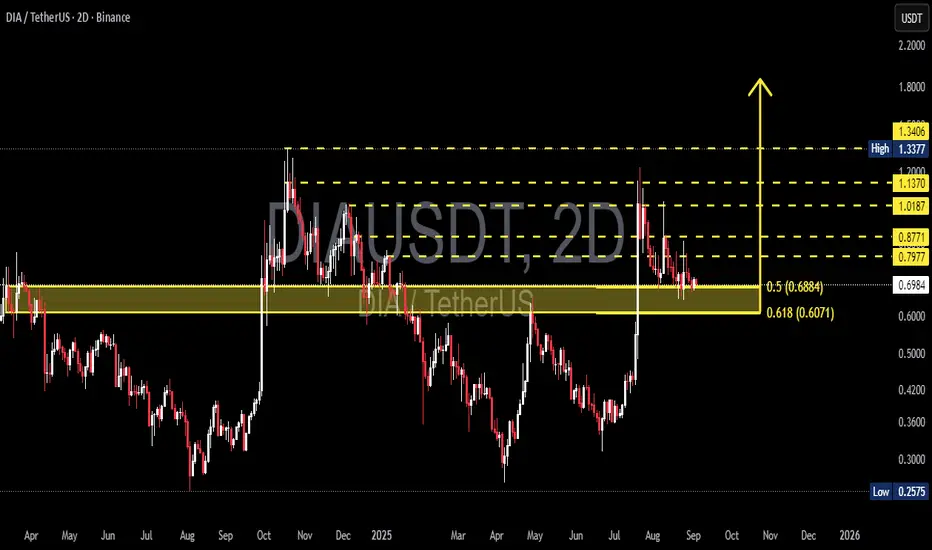
DIA price is currently testing the Fibonacci golden pocket (0.5–0.618) range around 0.6884 – 0.6071 USDT, a highly crucial zone that will decide whether the market resumes a bullish rally or extends the bearish trend.
This area also acts as a flip level (former resistance turned potential support). If buyers defend this level, a strong bounce may follow. But if it fails, the downside risk increases significantly.
---
📌 Structure & Technical Context
Major Support (Golden Pocket): 0.6884 – 0.6071.
Confluence of Fibonacci retracement and structural support.
Key Resistances: 0.7977 → 0.8771 → 1.0187 → 1.1370 → 1.3377 (recent high).
Candle Behavior: Multiple long wicks indicate liquidity grabs and indecision.
Trend Outlook: Medium-term remains sideways-to-bearish, but momentum can shift bullish if this golden pocket holds.
---
🚀 Bullish Scenario
Confirmation: 2D candle close above 0.70 with bullish reversal signals (hammer / engulfing) + increasing volume.
Upside Targets:
Target 1: 0.7977 (+14%).
Target 2: 1.0187 (+46%).
Target 3: 1.1370 – 1.3377 (+60–90%).
Plan:
Conservative entry near 0.68–0.70 with stop below 0.60. Use ladder take profits at each resistance level.
---
⚠️ Bearish Scenario
Confirmation: 2D close below 0.6071 (golden pocket breakdown).
Downside Targets:
First support: 0.42 (~40% drop).
Deeper support: 0.2575 (~63% drop).
Plan:
Short entry on confirmed breakdown + retest. Stop loss above 0.655, target 0.42 / 0.2575.
---
📈 Risk Management Notes
2D timeframe = swing trade context (weeks to months). Avoid reacting too much to small intraday candles.
Wait for candle + volume confirmation.
Take profits gradually and use trailing stops if resistance breaks.
Always size positions according to your personal risk tolerance.
---
DIA is testing the Fibonacci golden pocket (0.688–0.607), which also acts as a key flip level. This is a decisive battleground: will it turn into accumulation for a rally toward 0.7977 → 1.0187 → 1.1370, or will it break down toward 0.42 → 0.2575?
🔵 Bullish: needs a 2D close above 0.70 with strong reversal signals. Upside targets: 0.7977 → 1.0187 → 1.1370+.
🔴 Bearish: breakdown below 0.607 opens downside toward 0.42 → 0.2575.
This zone is where buyers and sellers will decide the next big move.
⛔️ Not financial advice. For educational purposes only.
#DIA #DIAUSDT #CryptoAnalysis #SwingTrade #Fibonacci #GoldenPocket #TechnicalAnalysis #PriceAction #Crypto
Diausdtperp
DIAUSDT Forming Descending ChannelDIAUSDT has recently broken out of a well-defined descending channel pattern on the weekly timeframe, signaling the start of a major bullish reversal. This breakout, accompanied by a strong surge in volume, suggests that buying momentum is entering the market decisively. The DIA token, which underpins the DIA data oracle platform, is starting to gain traction again as attention shifts toward real-world DeFi infrastructure and decentralized data solutions.
Technical indicators further support the bullish thesis. After consolidating within the descending channel for several months, the breakout candle has closed above resistance with conviction, pointing to a shift in sentiment. Projections based on technical targets suggest an upside potential ranging from 140% to 150%, with the possibility of price reaching as high as $2.50 in the coming months if momentum sustains. The long accumulation phase visible on the chart strengthens the case for this extended rally.
The market has also shown a renewed interest in fundamental oracles and trusted data feeds, which puts DIA back in the spotlight. As DeFi protocols evolve, the role of decentralized data becomes increasingly critical—positioning DIA to benefit from this narrative. With investor interest returning and the token breaking structure on the macro chart, DIA is now on many traders’ watchlists.
✅ Show your support by hitting the like button and
✅ Leaving a comment below! (What is You opinion about this Coin)
Your feedback and engagement keep me inspired to share more insightful market analysis with
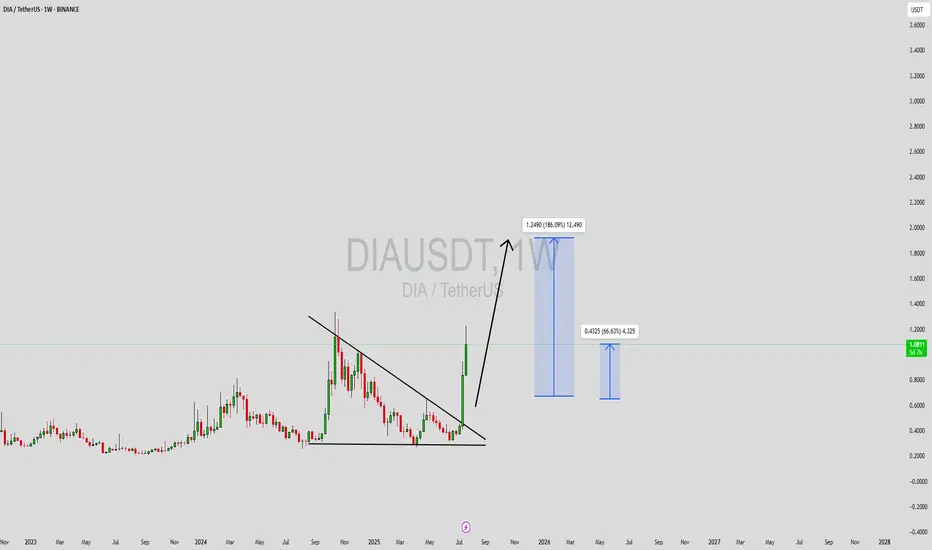
DIAUSDT Forming Powerful BreakoutDIAUSDT (DIA/USDT) has just completed a powerful breakout from a long-standing descending triangle pattern on the weekly timeframe. This move signals a potential shift from accumulation to expansion as bulls regain control. The breakout is accompanied by a significant surge in trading volume, suggesting that both retail and institutional investors are beginning to accumulate positions in anticipation of a broader rally. Technically, the pattern break targets a potential upside of 140% to 150%, supported by historical resistance levels shown on the chart.
DIA, a decentralized oracle platform, plays a vital role in bridging off-chain data to blockchain networks. As the DeFi space continues to expand, reliable data oracles like DIA are gaining increased relevance. This fundamental strength, combined with the bullish technical setup, makes DIA a solid candidate for medium- to long-term portfolio consideration. The recent price action could be the beginning of a major trend reversal, especially as on-chain metrics show growth in active wallet interaction.
The structure of the current breakout also reflects a clean technical progression—multiple higher lows leading into resistance, followed by a strong breakout candle with volume confirmation. If DIA can hold above its breakout level and establish support, the next leg higher could be rapid. The market sentiment is clearly shifting as more market participants recognize DIA's potential in the growing Web3 infrastructure.
✅ Show your support by hitting the like button and
✅ Leaving a comment below! (What is You opinion about this Coin)
Your feedback and engagement keep me inspired to share more insightful market analysis with you!

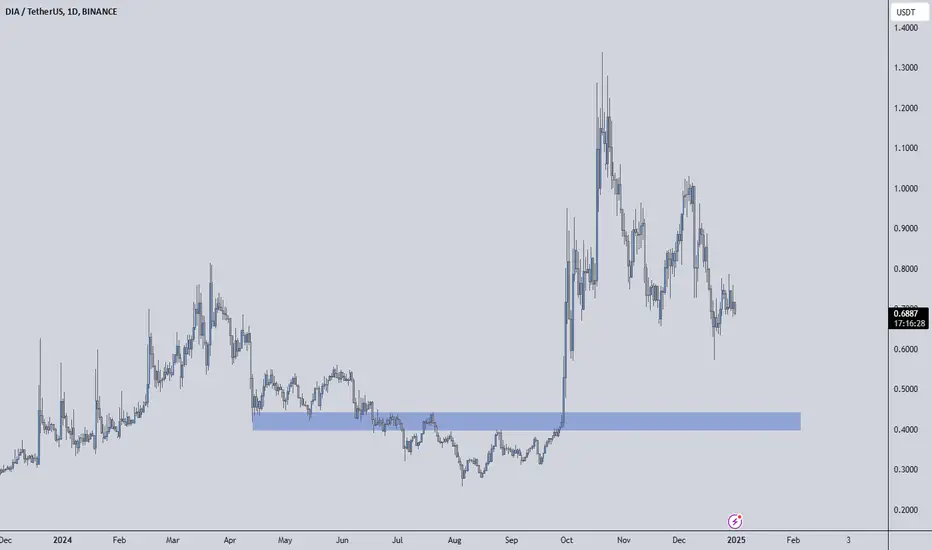
DIAUSDT Analysis: Volume Spike with a Strong Demand ZoneDIAUSDT Analysis: Volume Spike with a Strong Demand Zone
Daily Volume Increase: DIAUSDT shows a significant 96% spike in daily volume, indicating heightened interest.
Volume-to-Market Cap Ratio: The 60% ratio suggests active trading relative to its market cap.
Blue Box Entry Zone: The blue box is identified as a meaningful demand zone for potential entries.
Confirmation Checklist:
Before entering, I will look for confirmations using:
Cumulative Delta Volume (CDV)
Liquidity Heatmap
Volume Profile
Volume Footprint
Upward Market Structure Breaks on Lower Time Frames
Additional Insights:
DIAUSDT is showing strong signals, but risk management remains crucial, especially in volatile markets. Entries in the blue box should be approached with confirmation for the best risk-to-reward ratio.
Learn Advanced Techniques:
Want to master entries like this? DM me to learn how to utilize CDV, liquidity heatmaps, volume profiles, and volume footprints effectively.
Final Thoughts:
The blue box provides a great entry opportunity for DIAUSDT. Stay patient and precise. Good luck trading!
If you think this analysis helps you, please don't forget to boost and comment on this. These motivate me to share more insights with you!
I keep my charts clean and simple because I believe clarity leads to better decisions.
My approach is built on years of experience and a solid track record. I don’t claim to know it all, but I’m confident in my ability to spot high-probability setups.
If you would like to learn how to use the heatmap, cumulative volume delta and volume footprint techniques that I use below to determine very accurate demand regions, you can send me a private message. I help anyone who wants it completely free of charge.
My Previous Analysis (the list is long but I think it's kinda good : )
🎯 ZENUSDT.P: Patience & Profitability | %230 Reaction from the Sniper Entry
🐶 DOGEUSDT.P: Next Move
🎨 RENDERUSDT.P: Opportunity of the Month
💎 ETHUSDT.P: Where to Retrace
🟢 BNBUSDT.P: Potential Surge
📊 BTC Dominance: Reaction Zone
🌊 WAVESUSDT.P: Demand Zone Potential
🟣 UNIUSDT.P: Long-Term Trade
🔵 XRPUSDT.P: Entry Zones
🔗 LINKUSDT.P: Follow The River
📈 BTCUSDT.P: Two Key Demand Zones
🟩 POLUSDT: Bullish Momentum
🌟 PENDLEUSDT.P: Where Opportunity Meets Precision
🔥 BTCUSDT.P: Liquidation of Highly Leveraged Longs
🌊 SOLUSDT.P: SOL's Dip - Your Opportunity
🐸 1000PEPEUSDT.P: Prime Bounce Zone Unlocked
🚀 ETHUSDT.P: Set to Explode - Don't Miss This Game Changer
🤖 IQUSDT: Smart Plan
⚡️ PONDUSDT: A Trade Not Taken Is Better Than a Losing One
💼 STMXUSDT: 2 Buying Areas
🐢 TURBOUSDT: Buy Zones and Buyer Presence
🌍 ICPUSDT.P: Massive Upside Potential | Check the Trade Update For Seeing Results
🟠 IDEXUSDT: Spot Buy Area | %26 Profit if You Trade with MSB
📌 USUALUSDT: Buyers Are Active + %70 Profit in Total
🌟 FORTHUSDT: Sniper Entry +%26 Reaction
🐳 QKCUSDT: Sniper Entry +%57 Reaction
📊 BTC.D: Retest of Key Area Highly Likely
I stopped adding to the list because it's kinda tiring to add 5-10 charts in every move but you can check my profile and see that it goes on..
DIAUSDT 1WDIA ~ 1W
#DIA If you still have Conviction on this coin,. buy gradually inside this support block,. with a minimum target of 20%+
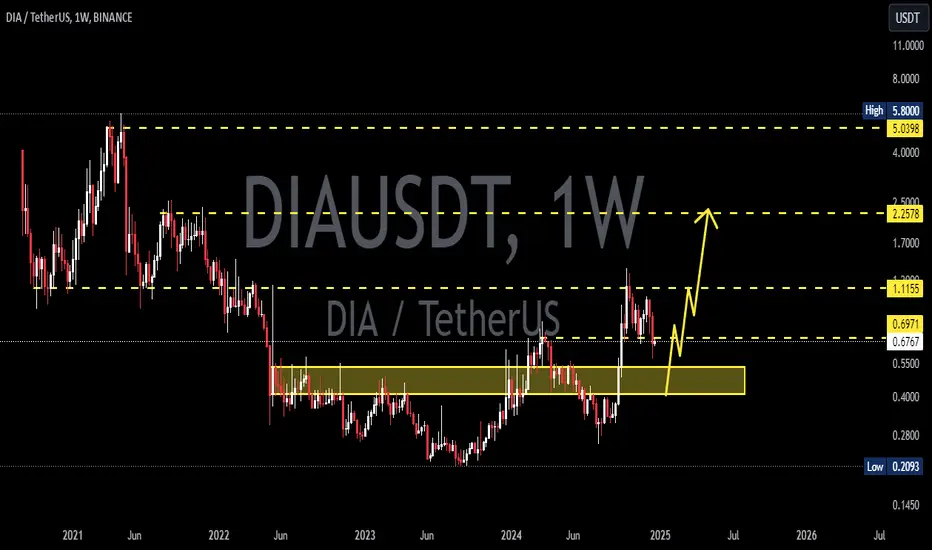
The #DIA has hit a low and is poised for a WEDGE breakout!
Hello, fellow crypto enthusiasts! I'm CryptoMojo, the name you can trust when it comes to trading views. As the captain of one of the most vibrant and rapidly growing crypto communities, I invite you to join me for the latest updates and expert long and short calls across a wide range of exchanges. I've got your trading needs covered with setups for the short-, mid-, and long-term. Let's dive into the charts together!
I've dedicated my time and effort to crafting this chart, but remember, what you see here is crypto insight, not financial advice. 🚀💰 #CryptoMojo #CryptoTrading
🚀 Brace yourselves for the exciting #DIA update! 📈 The mighty DIA is currently flexing its muscles, striving to shatter the confines of its falling wedge pattern. And guess what? If this breakout unfolds as we anticipate, we're looking at the potential for a jaw-dropping +200–240% bullish rally in the midterm.
Picture the thrill of riding this crypto rollercoaster to newfound heights!
Our charts are buzzing with anticipation, and it's a thrilling journey we'd love for you to join. Keep a close eye on DIA, because this could be the trade that makes your crypto dreams come true. 🚀💰 #CryptoGains #BullishDIA
This chart is likely to help you make better trade decisions if it does consider upvoting it.
I would also love to know your charts and views in the comment section.
Thank you
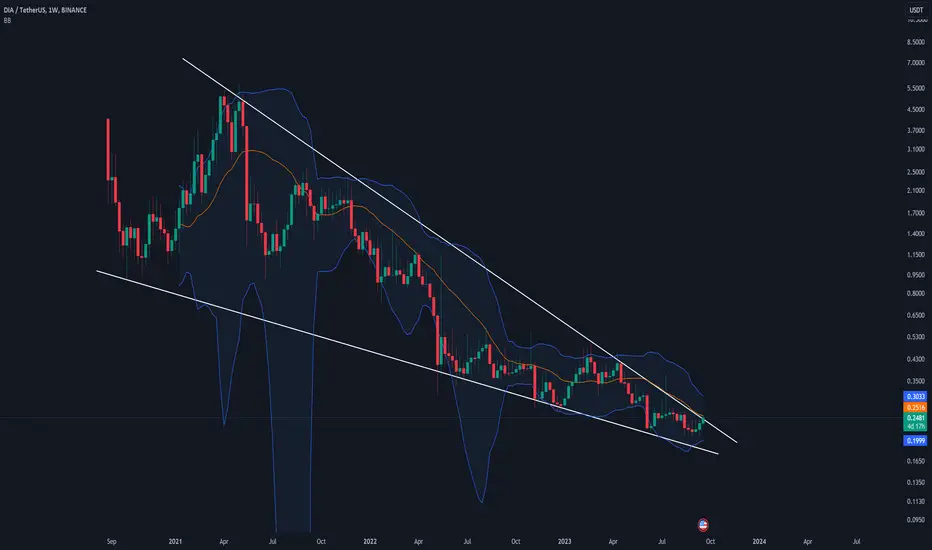
🔮DIA- didn't make it last round, will it fly now?I thought I'd just re-post this as a reminder, because everything from the last months publication is still valid. BINANCE:DIAUSDT didn't make it last time. The price left the formation in a sideways movement, which at this point has turned into 2months+ of consolidation on key level/200EMA. It is safe to assume that another breakout attempt will come soon. And if it won't- well, then DIA will be of the biggest disappointments this season 🤣🤣 But it's ok, it's part of the game we're playing.
Previous post:
--------------------------
About DIA:
DIA (Decentralised Information Asset) is an open-source oracle platform that enables market actors to source, supply and share trustable data. DIA aims to be an ecosystem for open financial data in a financial smart contract ecosystem, to bring together data analysts, data providers and data users. In general, DIA provides a reliable and verifiable bridge between off-chain data from various sources and on-chain smart contracts that can be used to build a variety of financial DApps.
DIA is the governance token of the platform. It is currently based on ERC-20 Ethereum protocol.
The project was founded in 2018, while the token supply was made available to the public during the bonding curve sale from Aug. 3 through Aug. 17, 2020, where 10.2 million tokens were sold.
Source: coinmarketcap
