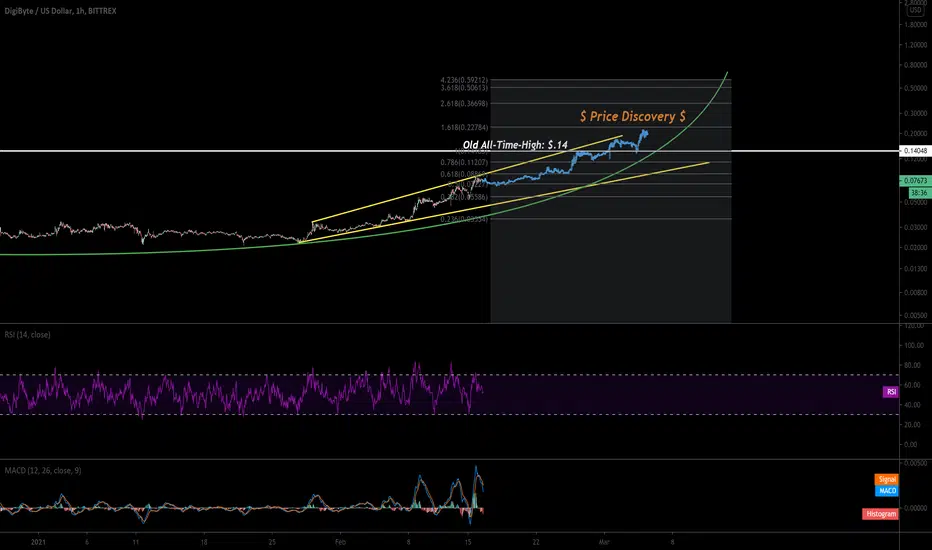
Digibyte: New All-Time-Highs Soon?If BTC keeps steadily moving up, this is roughly what we can expect out of Digibyte.
Obviously, btc has a mind of its own, so if this parabola breaks - it's likely due to a btc correction.
I was not expecting to see DGB reach all-time-highs this quickly, but it looks like the time has come.
After almost 4 years of sideways consolidation, Digibyte is ready to run.
(not financial advice ;)-<
Digibyte
Digibyte can reach 380 sats (3rd wave)Past DGB movements:
First wave: 110 to 175 sats ✅
Second wave (correction): 175 to 147sats - Perfect fibo 0.382 retraction ✅
Now, it's time to the third wave.
The 3rd wave is always bigger than the 1st wave (2x / 3x bigger).
If Digibyte breaks 175 sats, the 3rd wave is confirmed.
Target 1: 250 sats (1.618 fibo)
Target 2: 310 sats (2.618 fibo)
Target 3: 380 sats (3.618 fibo)
We are waiting the breakout!

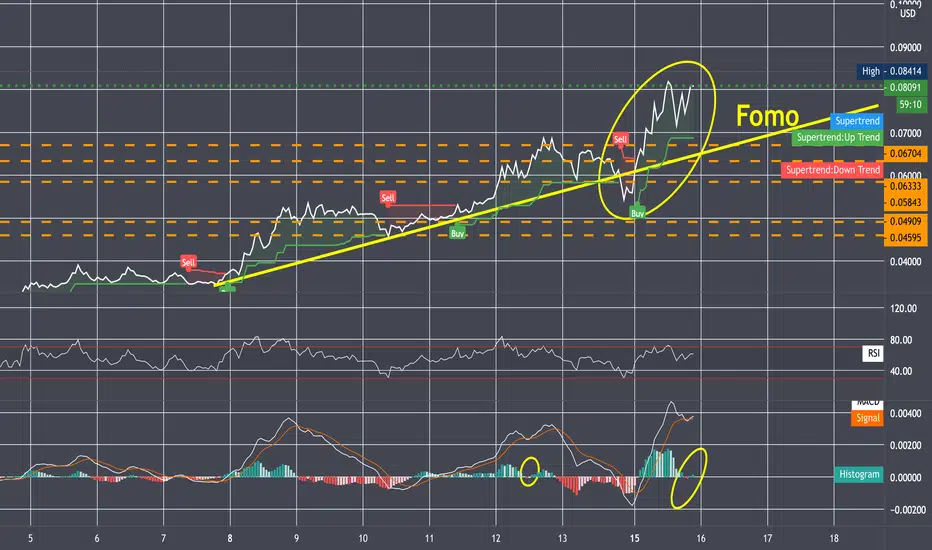
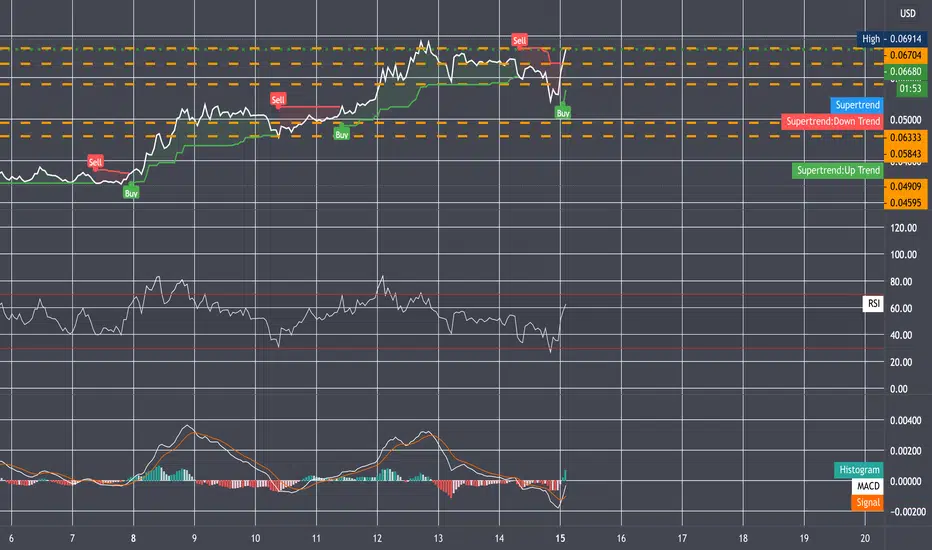
DGB FOMOI would have liked to see this fomo much later in the bull run, and perhaps there will be another moment where fomo impacts the DGB charts.
The switch on the MACD line (right after a buy signal went up) has only happened once since this run up began.
Typically, it's 3-days up, 1-day down.
I think the reason for this is Fomo. DGB popped hard last night around 3am. When people woke up this morning and saw that DGB was up 20%, they jumped in and drove the price up substantially – to the point where we saw DGB in the number #1 spot (up 34%) on Coinbase today. This was not the way DGB was rising — slow and steady.
We want slow and steady, not pump & dumps.
Having said that, I think tonights MACD crossover into red candles are an outlier (correction from the FOMO buys this morning), and not in alignment with the trend we've seen recently.
In my opinion, DGB continues to rise over the next three days, until we get a sell signal. :)
I am not a financial advisor. These charts and posts are for my own personal documentation purposes only. Do your own research before investing into crypto.
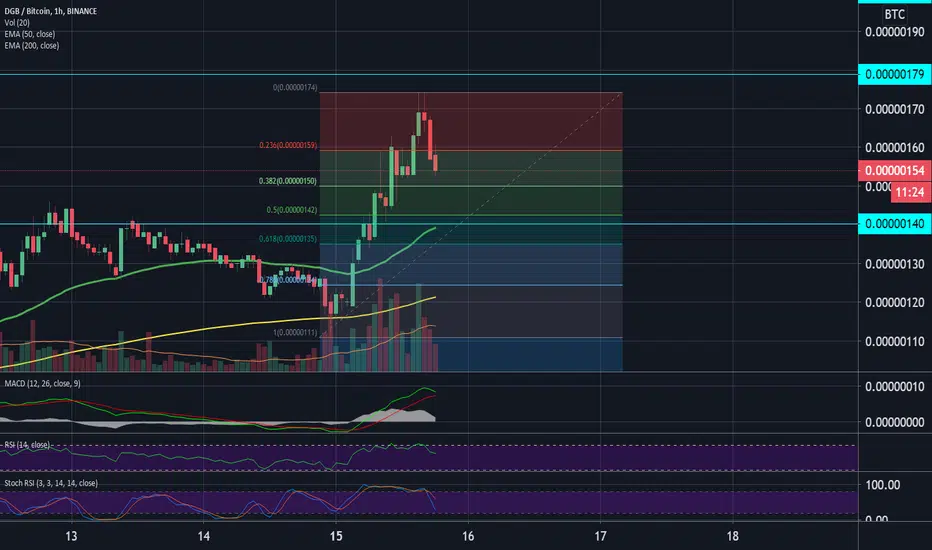
Healthy CorrectionIt's time to healthy correction (bullish continuation pattern).
BUY ZONE:
I expect a good support at 150 sats (0.382 fibo), before trend continue the long run (first entry).
But, we could see 140~150sats range (second entry).
Don't miss the Digibyte long run!
Digibyte: Get Ready for All-Time-HighsVolume traders know what's coming for Digibyte.
Digibyte hasn't seen (increasing) levels of volume like this since it was over 10 cents. Over $200 million 24hr volume for DGB, which is a lot .
New all-time-highs are coming soon for Digibyte, sooner than most might expect. This parabolic run isn't over yet.
Keep your eye on rsi for signs of imminent price action to the upside.
(as usual, not financial advice;)-<

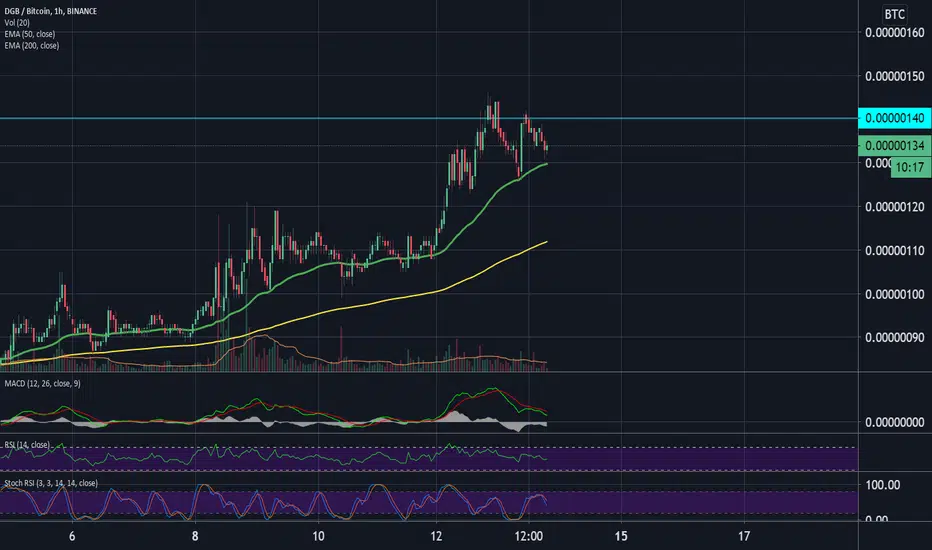
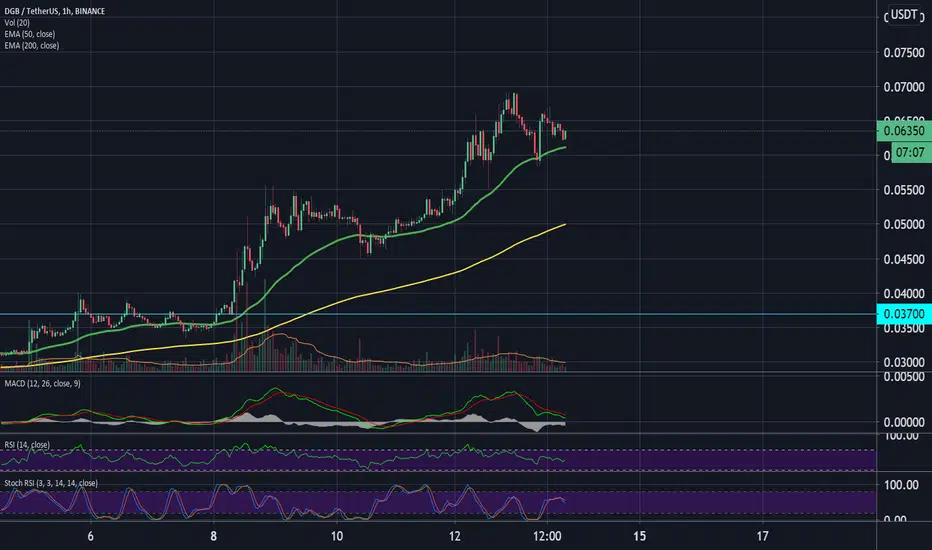
Digibyte 1h Buy OpportunityDigibyte is holding 9 days above EMA 50 (green line).
What is mean? Every EMA 50 touch is one buy opportunity.
The price is holding strong and DGB is getting a boost to reach higher levels.
The next target is around 200 sats.
Big movement VERY SOON!
Cheers
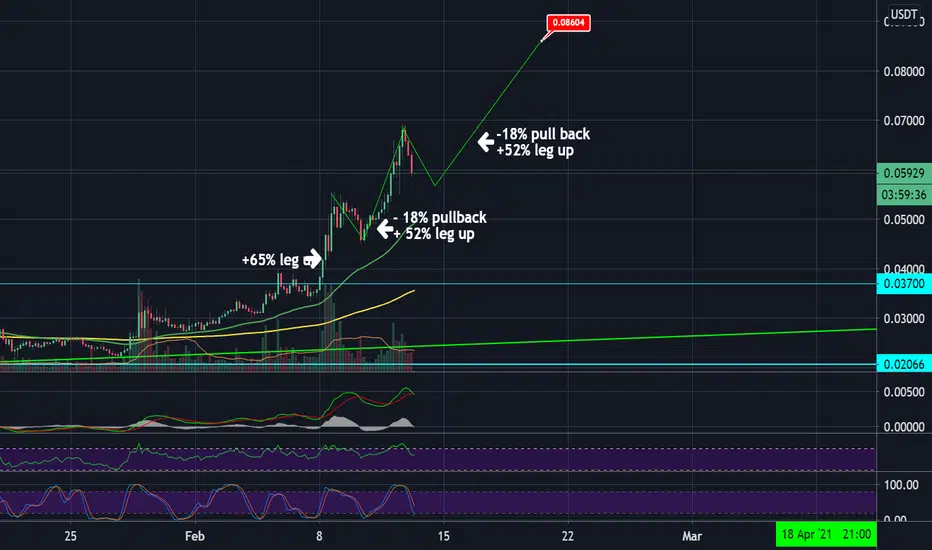
Panic sell timeThis is why I'll HOLD Digibyte.
Pullbacks are being much smaller than leg ups, which means only a small correction (continuation pattern).
Smart guys will gain money, buying the dip.
The alt season has not finished.
Long term players will win the battle.
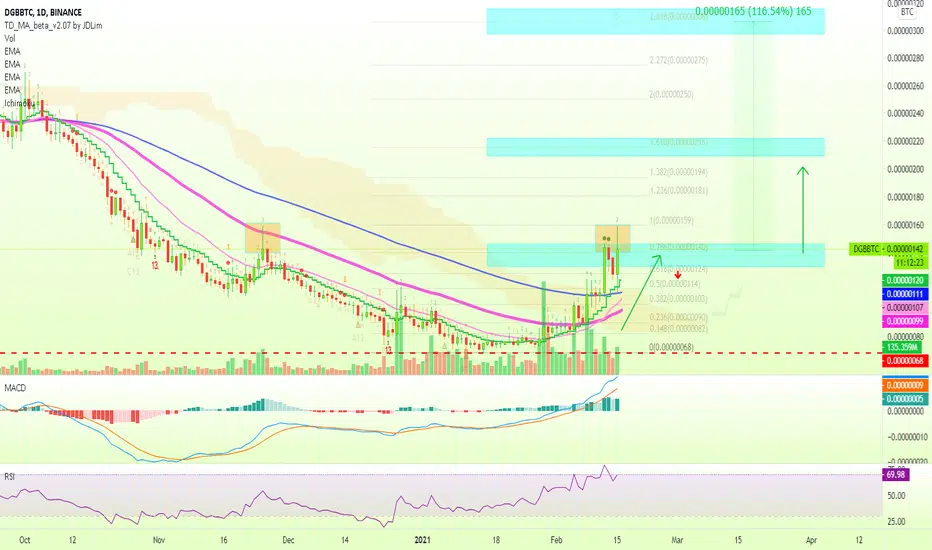
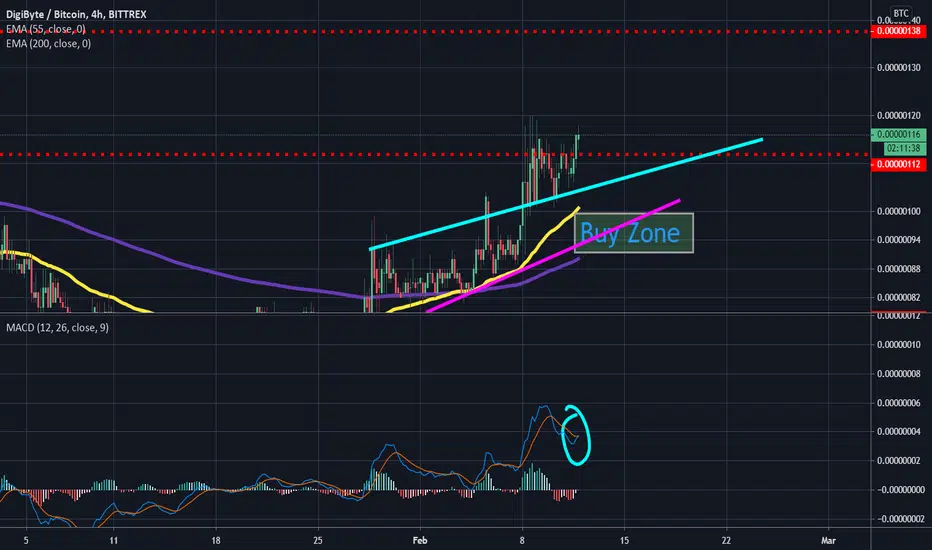
DigiByte (DGB) Hits New High (115%+ Target)DigiByte (DGBBTC) just hit its highest price since November 2020, with the signals and indicators pointing to even higher prices.
We are about to enter a 'Boom' phase for many altcoins.
What I am seeing is many pairs growing slowly, consolidating while bullish, and preparing for massive growth.
Look at DGBBTC, now that prices are trading above EMA100 (EMA50/21/10), we can easily see additional growth.
The targets are marked on the chart.
Namaste.
DGB Could Be A Good Buy Right NowI am not. a financial advisor. I make these charts for my own personal development. Do your own research to decide when to invest into Crypto.
Based on what I'm seeing. There has been a 3-day rise, then 1-day drop. We just entered a new three day rise... based on the signals I'm seeing.
Could this be the .09 cent target we've been looking for?
More to come.
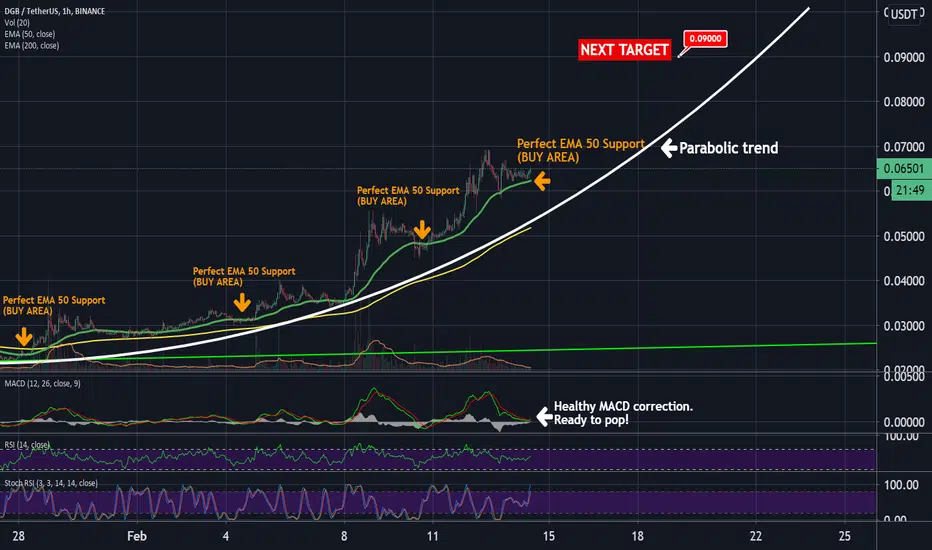
Digibyte PARABOLIC trend!The most wanted signal appeared: The Parabolic Line!!!
EMA 50 = Perfect buy zones.
MACD ready to pop.
Next Target: U$0,09
Digibyte is waiting a little to push up because Bitcoin is rising. When BTC stop a little, we will see Digibyte leg up.
I believe that DGB will hit the target in the next 7 days.
Digibyte 1h Buy OpportunityDigibyte is holding 9 days above EMA 50 (green line).
What is mean? Every EMA 50 touch is one buy opportunity.
The price is holding strong and DGB is getting a boost to reach higher levels.
The next target is around U$0,09.
Big movement VERY SOON!
Cheers
Bull Flag Pattern (bullish trend continuation)1) Neutral MACD, ready to leg up;
2) Price holding above EMA 50/ EMA 200;
3) $DGB need break the flag to confirm the movement;
4) Holders will be rewarded in this journey.
First target: 0,055
Second target: 0,07
180 days breakout (bullish reversal)1) 180 days downtrend breakout;
2) Price increasing fast above EMA 50;
3) RSI holding above 5;
4) MACD going up;
EXTREME BULLISH CHART!
First small resistance: +- 145 sats
Strong resistance: 200 sats

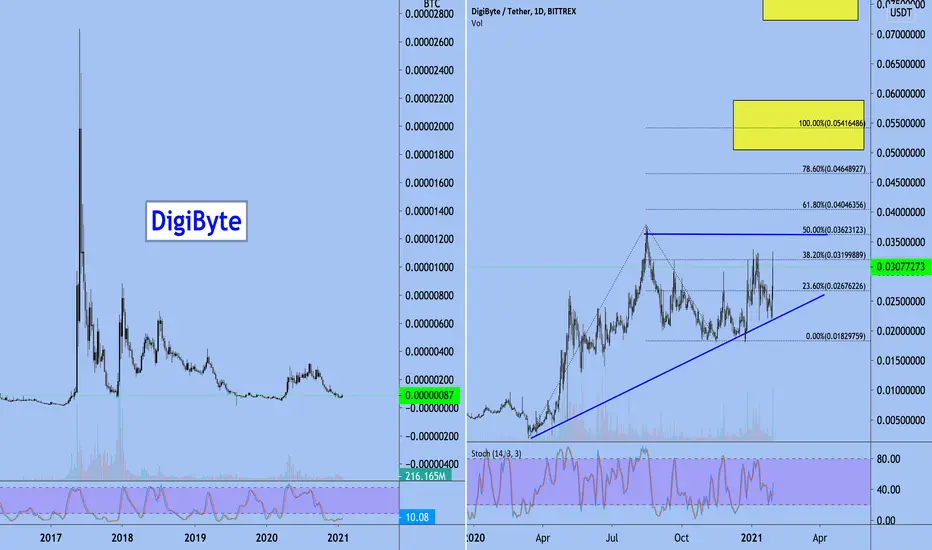
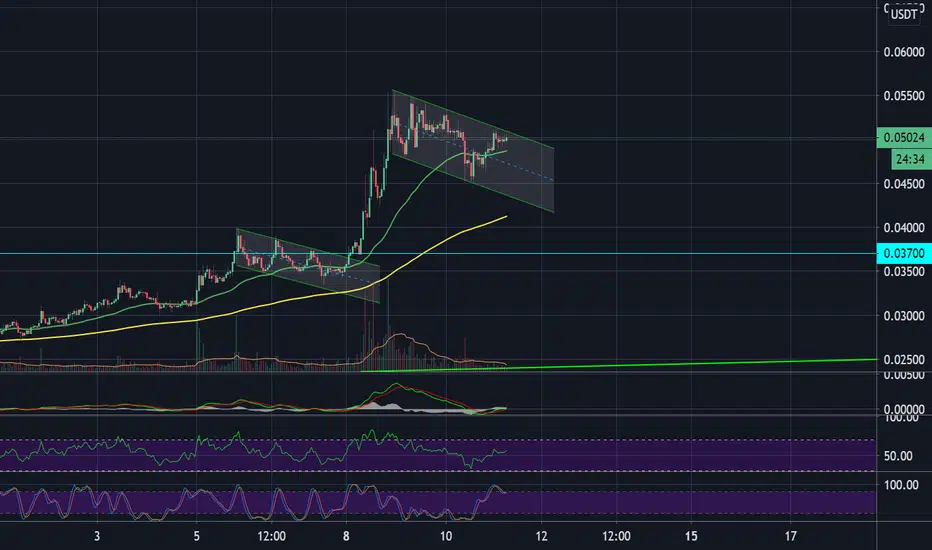
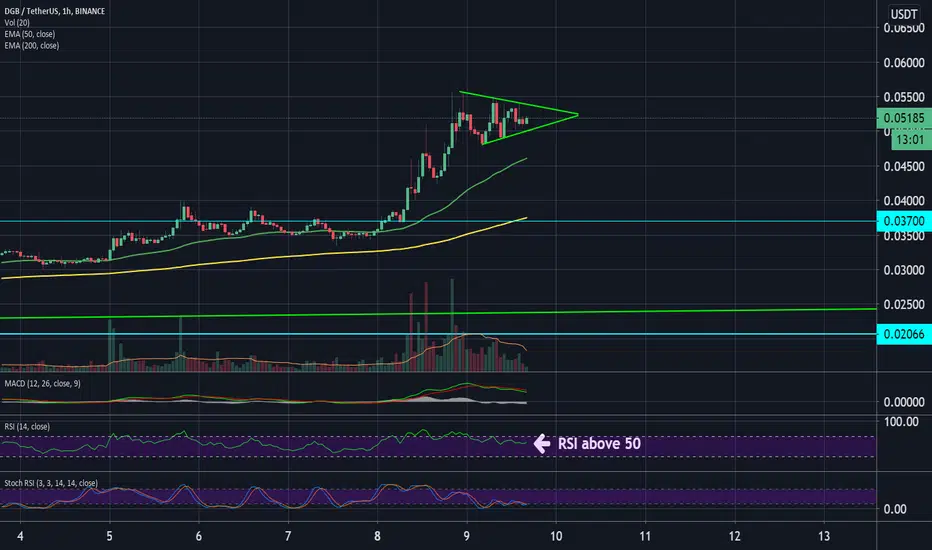
Beautiful Pennant Detected1) Beautiful pennant;
2) RSI is holding above 50, bullish signal.
3) Price is holding well at this level, without selling pressure;
4) If $DGB break above U$0,054 , the target is U$0,06;
5) Breakout very soon.
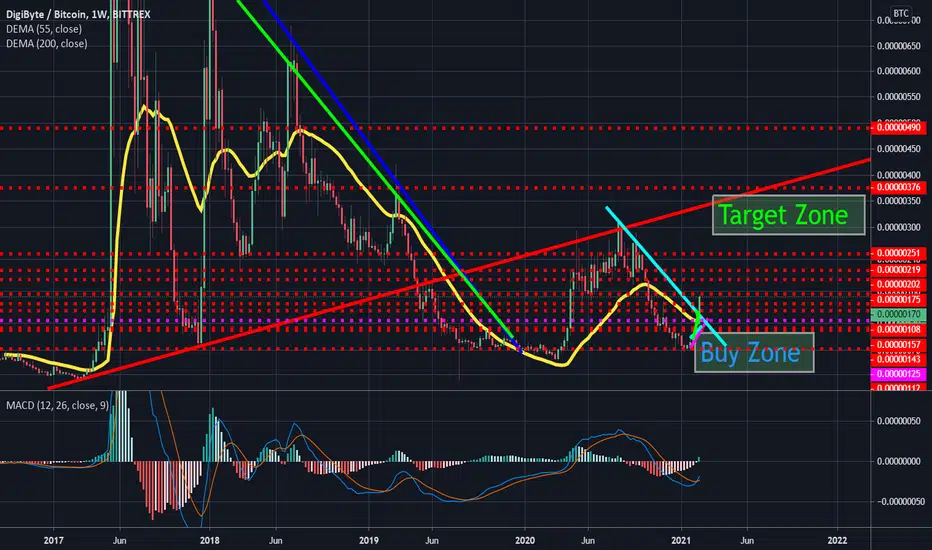
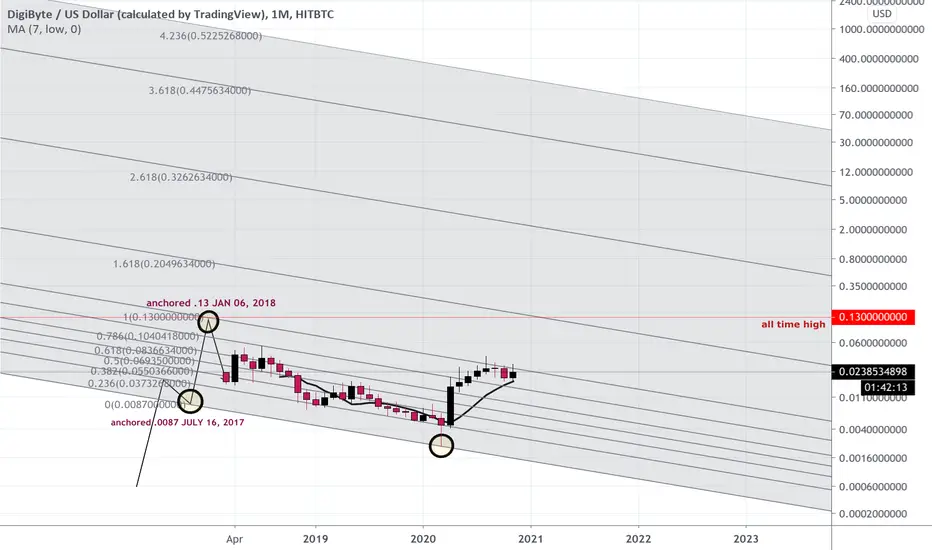
DGB FIB CHANNELsince there is a large piece of DGB chart history missing, I took the time to research the date and price for the fib channel anchor points that occurred in the 2017/2018 bull run
targets are pretty attractive after the high of .13 gets taken out
currently sitting on the 200 dma (7 month ma in black)
this is not financial advice
just a look at the possible fib targets that digibyte has available to it
Digiybyte may complete the Gartley move for upto 226% rallyHi dear friends, hope you are well, and welcome to the new update on DGB .
On a daily time period chart, the priceline of Digibyte with BTC pair can complete the bullish Gartley pattern, and soon it will be entered the potential reversal zone. On breaking down the exponential moving average 10 the move will be confirmed. The EMA 21 is at the potential reversal zone.
This trade has a huge profit possibility up to 226%, and the loss possibility is 39%.
Note: Above idea is for educational purpose only. It is advised to diversify and strictly follow the stop loss, and don't get stuck with trade.

Big potential on DGB🚀Miss me, wolves?🔥
One more altcoin wants to give money today.
DigiByte is a modification of Bitcoin which aims to diversify security, speed and capacity possibilities.
Its first incarnation was as an open source blockchain and associated cryptocurrency, DGB. The network has five separate algorithms which help to maintain security and help prevent ASIC miners from commandeering too much power.
Interesting, right?
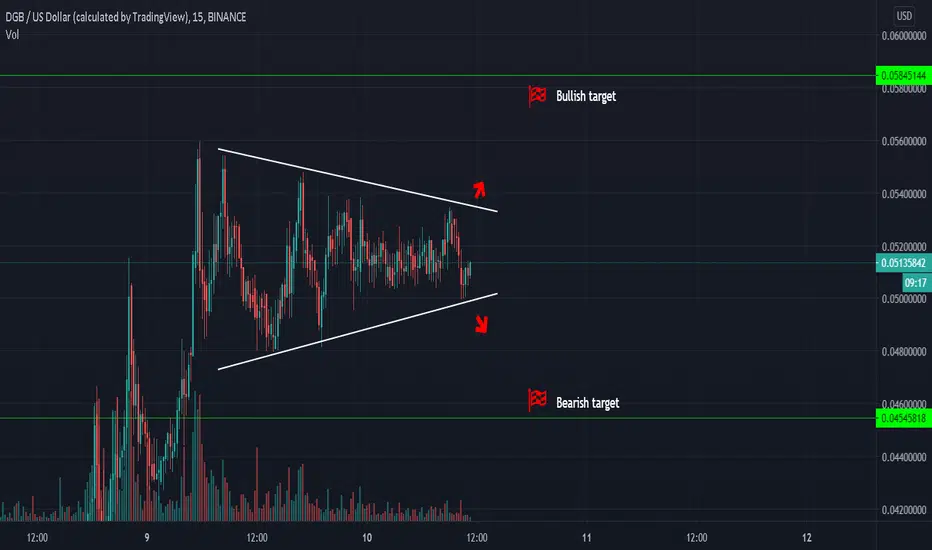
Symmetrical triangle on DGB/USD with strong bullish sentiment before. Small frame means instant result in your track records. That's why lets follow the chart and look for the breakout point carefully.
If you enjoy my FREE Technical Analysis , support the idea with a big LIKE👍 and don't forget to SUBSCRIBE my channel, you won't miss anything!
Feel free to leave comments✉️
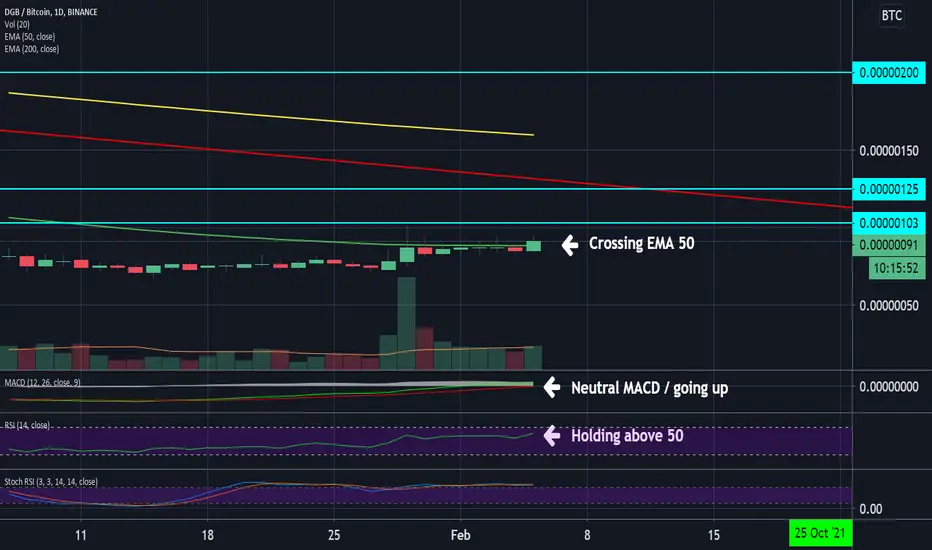
Digibyte above EMA 501) After 120 days closing below EMA 50, Digibyte is turning to bullish, above EMA 50.
2) Neutral MACD, going up.
3) RSI holding at 50+.
1st target: 100 sats
2nd target: 125 sats
No. You are not late to join.
It's still VERY EARLY!
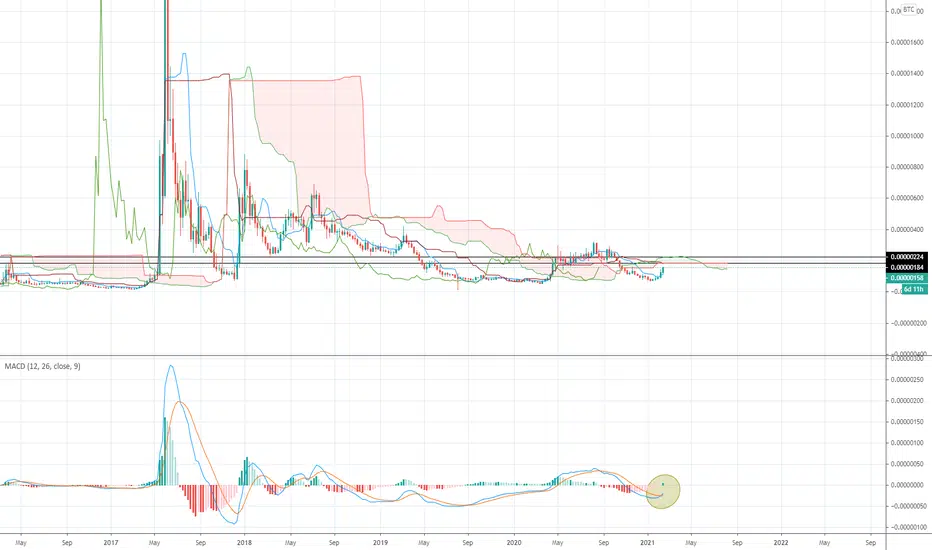
Digibyte Reversal1) After 120 days, EMA 50 / EMA 200 crossed, turning DGB to bullish;
2) Neutral MACD, going up;
3) RSI holding at 50+;
4) Beautiful ARC almost done.
1st target: 100 sats
2nd target: 125 sats
