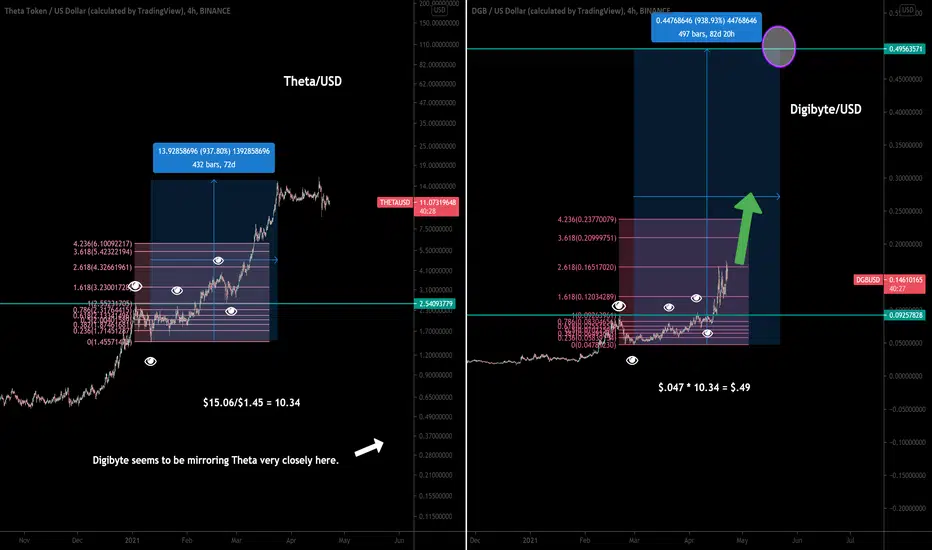
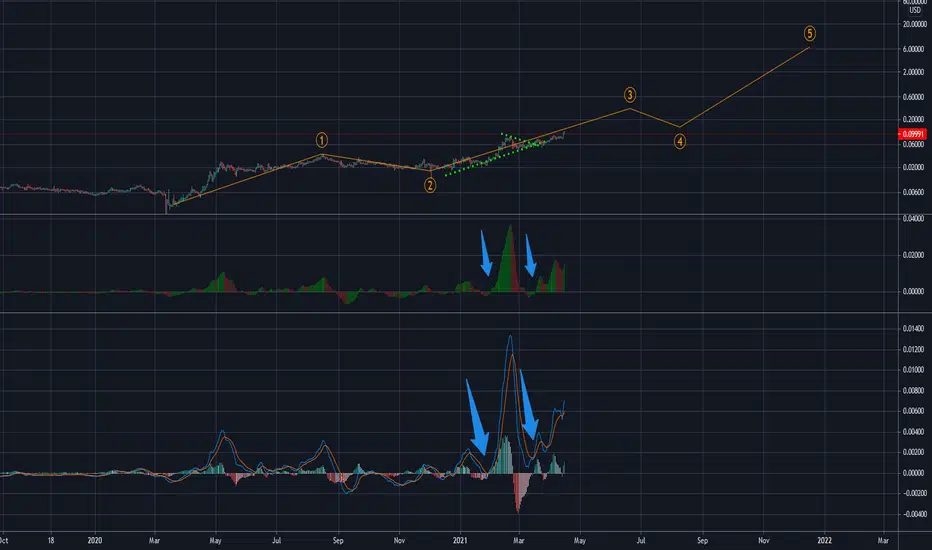
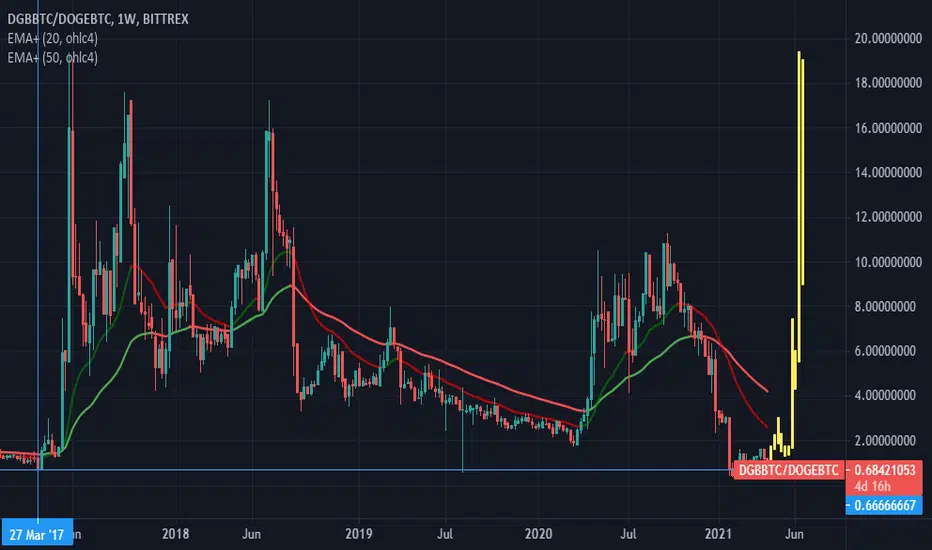
Digibyte is about to 3x (theta-like run eminent)After following theta's mega-run over the past few months, I decided to take a glance at the chart. Lo and behold, there appears to be some stunning similarities when compared to Digibyte.
This little fractal may be indicating that Digibyte is about to follow theta's moves and do a theta-like run up to around 50 cents.
Yes, 50 cents.
Additionally, Digibyte is so undervalued that its market cap 50 cents would still be well under $10 billion. In other words there is a lot of room to grow. I expect Digibyte to be trading for up to $2-$3 at some point during this market cycle.
Stay tuned.
Keep an eye on trading volume as well. The 24 hour trading volume on Digibyte is currently sitting close to 50% of its total market cap...Something to think about...
(not financial advice ;)
Digibyte
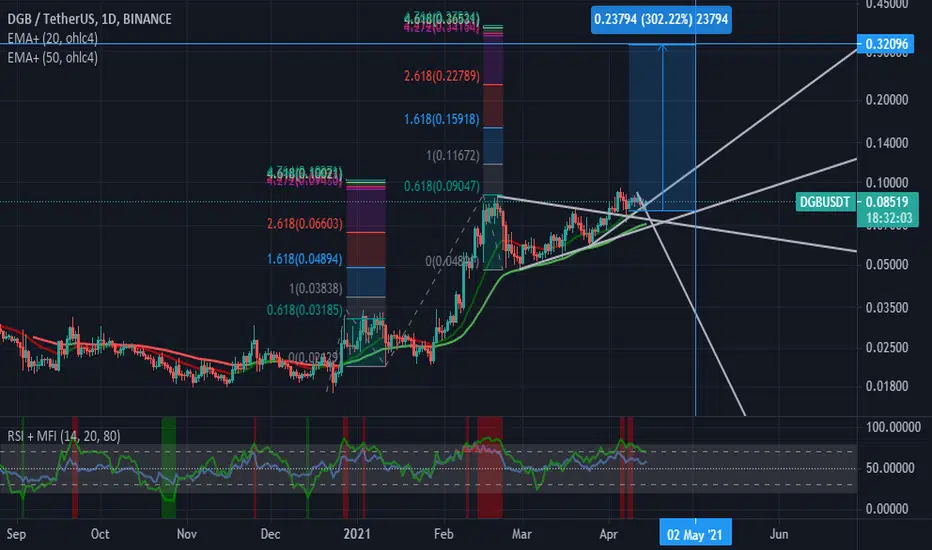
DigiByte (DGB) - April 21Hello?
Dear traders, nice to meet you.
By "following" you can always get new information quickly.
Please also click "Like".
Have a good day.
----------------------------------
(DGBUSD 1W chart)
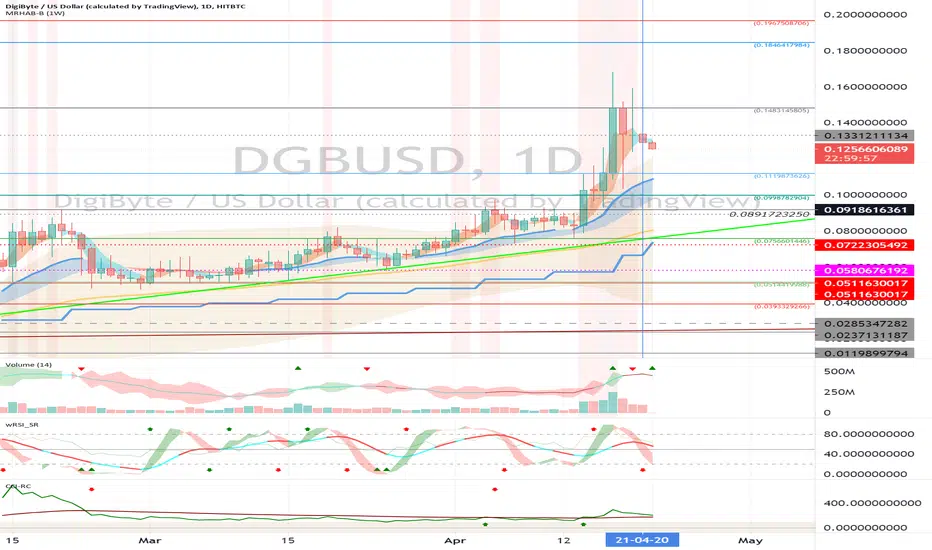
(1D chart)
You should watch for any movement that deviates from the 0.1119873626-0.1483145805 section.
If it falls at 0.0756601446, you need a Stop Loss to preserve profit or loss.
If the CCI line falls below the EMA line in the CCI-RC indicator, volatility may occur, so careful trading is necessary.
-------------------------------------
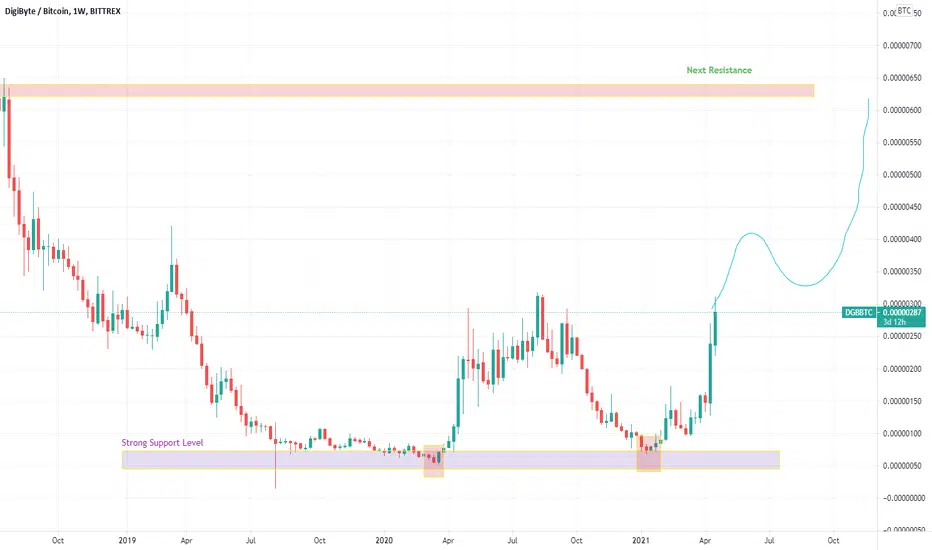
(DGBBTC 1D chart)
It remains to be seen if it can rise along the uptrend line even with support at the 221 Satoshi point.
-------------------------------------------------- -------------------------------------------
** All indicators are lagging indicators.
So, it's important to be aware that the indicator moves accordingly with the movement of price and volume.
Just for the sake of convenience, we are talking upside down for interpretation of the indicators.
** The wRSI_SR indicator is an indicator created by adding settings and options from the existing Stochastic RSI indicator.
Therefore, the interpretation is the same as the conventional stochastic RSI indicator. (K, D line -> R, S line)
** The OBV indicator was re-created by applying a formula to the DepthHouse Trading indicator, an indicator that oh92 disclosed. (Thank you for this.)
** Check support, resistance, and abbreviation points.
** Support or resistance is based on the closing price of the 1D chart.
** All explanations are for reference only and do not guarantee profit or loss on investment.
Explanation of abbreviations displayed on the chart
R: A point or section of resistance that requires a response to preserve profits
S-L: Stop Loss point or section
S: A point or segment that can be bought for profit generation as a support point or segment
(Short-term Stop Loss can be said to be a point where profits and losses can be preserved or additionally entered through installment transactions. It is a short-term investment perspective.)
GAP refers to the difference in prices that occurred when the stock market, CME, and BAKKT exchanges were closed because they do not trade 24 hours a day.
G1: Closing price when closed
G2: Cigar at the time of opening
(Example) Gap (G1-G2)
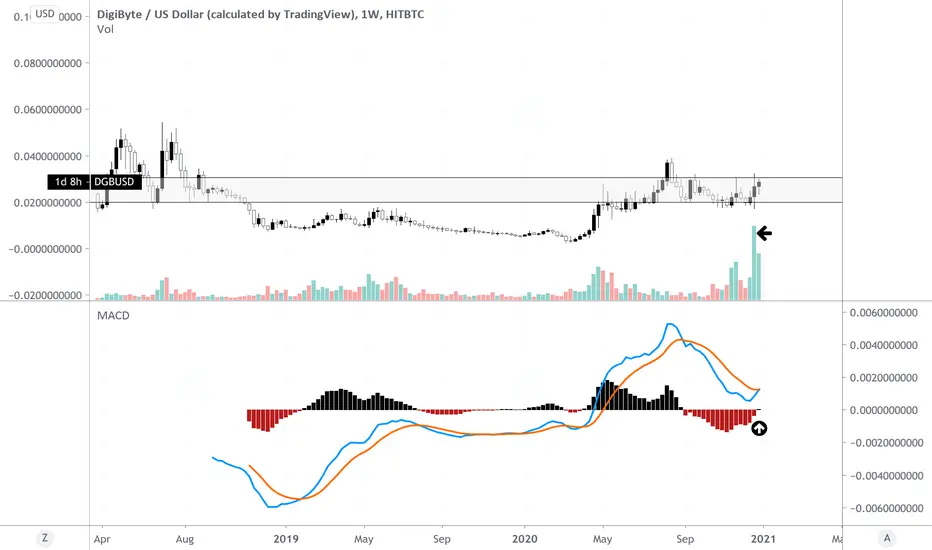
DGB BREAKOUT PENDINGon the weekly chart
from the bottom of the demand zone to the top on record volume
macd histogram going positive
signal line crossing
.03 is the breakout level
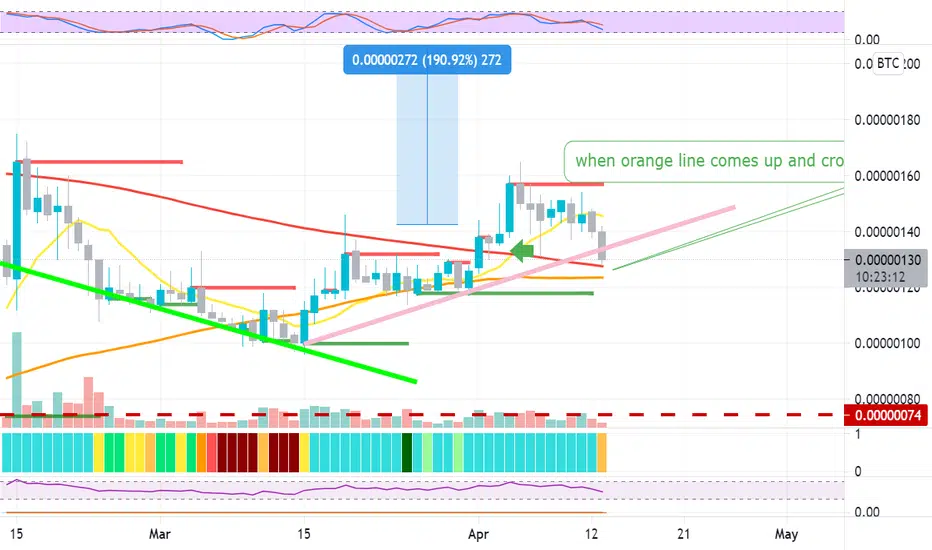
DigiByte Drops? Nothing Big Just Testing Support, Up We Go!DigiByte (DGBBTC) dropped after my last analysis, but everything remains within the strong bullish trend that is now building up.
The drop took out the EMAs as strong as EMA100 and EMA50 but only for a few days and we are now seeing strong momentum as prices move back up.
The green volume is strong.
The indicators are also looking good.
Bitcoin is starting to bounce as well.
The Altcoins continue to Boom!
Each and every day I see more evidence/data pointing to continued and sustained bullish growth...
Let's hope we are right... and sure we are...
The altcoins market has been growing for months.
Namaste.

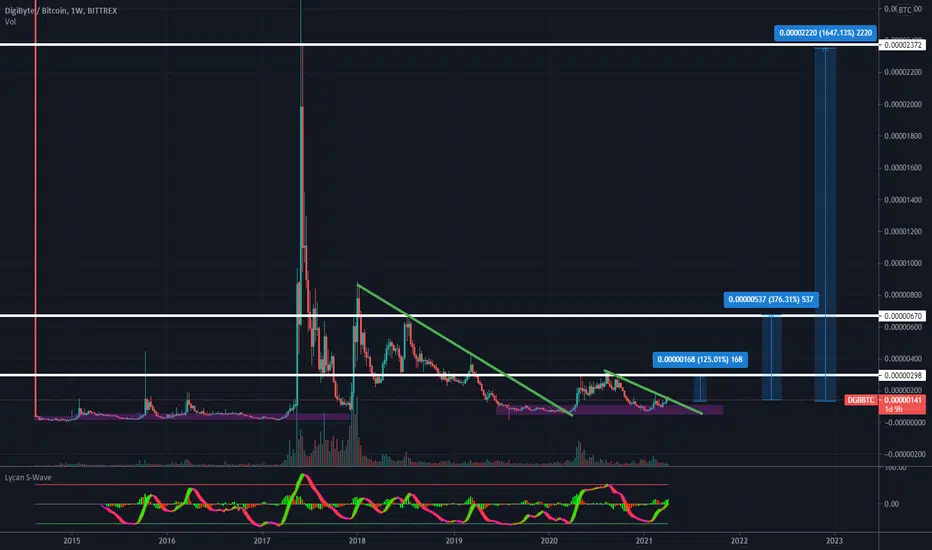
DGB has not exploded yet. Buy DigiByte and wait for pump!🚀DGB has not exploded yet, if you are searching for coin which didn`t jump yet it may be good option for you. In USDT chart look very bullish but in BTC pair we are still at the bottom. We believe that DGB will give us huge profit during this bullrun. Buy and wait for pump!
🚀 This coin is on our golden long-term altcoins list. It may be very good project for long term investment.
❎ No TP for long-term investments. We can`t predict exact altcoins targets in long term, but thanks to our experience and glassnode we are able to predict exact bitcoin targets. Our long-term strategy is just to hold these altcoins until glassnode indicators will say us that we are close to end of bullrun. And then we will sell everything in 15% parts.
✅ Bullrun is easy. Just accumulate coins from our golden list (long) and play with our signals (short). Diversification is the key to success.
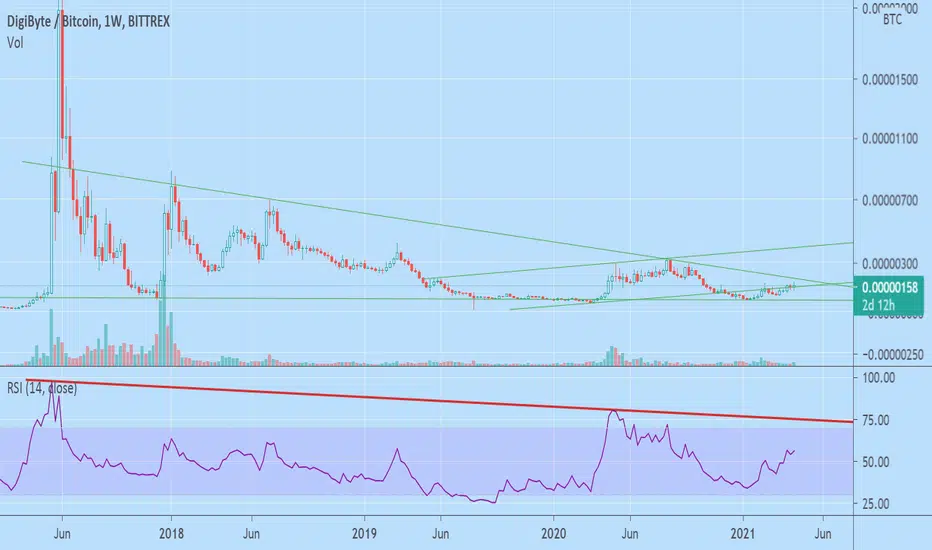
Digibyte time has come.Digibyte in my opinion is sleeping giant and will mint millionaires this year. I wouldn't sleep on this coin. A move above the RSI downtrend is a very bullish move. It has in the last year also been more easily available for people to trade and buy than in previous years. Digibyte also has some of the best tech in crypto and in my opinion will have a bright future in the crypto sphere. Expect volatility in the coming weeks.
Patience and strong hands will be rewarded.
Im not a financial advisor, this is not financial advice.
A huge Run for DGB is expectedeverything is clear, passing the 0.618 Fib level will push the price to the end of the wave 3 of 3
STILL VALID, BUT WE HAVE A FEW DAYS MAYBE WAITING ON LAUNCH AFTER THE 50 SMA CROSSES THE 200 SMA ( ORANGE AND RED LINES)
DGB has not exploded yet. Buy DigiByte and wait for pump!🚀DGB has not exploded yet, if you are searching for coin which didn`t jump yet it may be good option for you. In USDT chart look very bullish but in BTC pair we are still at the bottom. We believe that DGB will give us huge profit during this bullrun. Buy and wait for pump!
🚀 This coin is on our golden long-term altcoins list. It may be very good project for long term investment.
❎ No TP for long-term investments. We can`t predict exact altcoins targets in long term, but thanks to our experience and glassnode we are able to predict exact bitcoin targets. Our long-term strategy is just to hold these altcoins until glassnode indicators will say us that we are close to end of bullrun. And then we will sell everything in 15% parts.
✅ Bullrun is easy. Just accumulate coins from our golden list (long) and play with our signals (short). Diversification is the key to success.

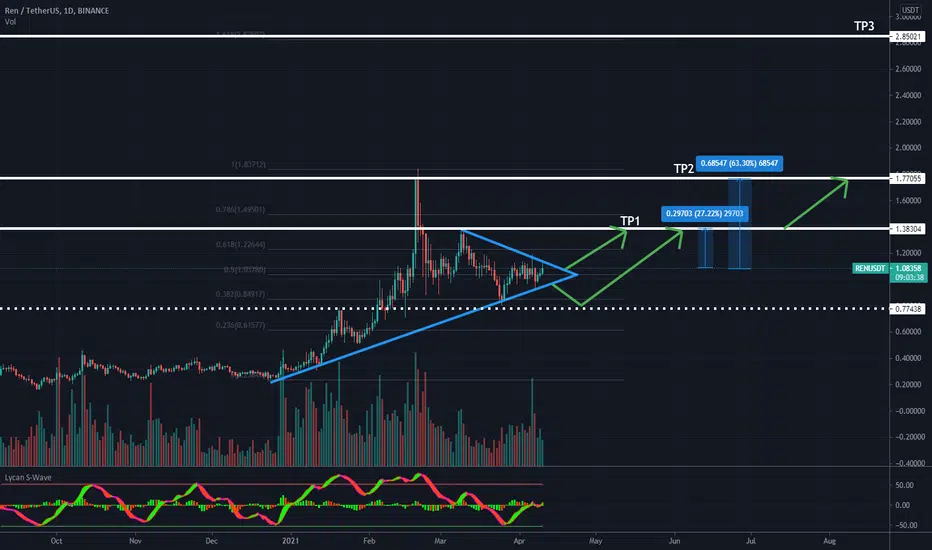
$REN - Ready for the next leg up.Looks like REN is ready to finish its correction of the impulse from 0.2 to 1.8.
TP1 short-term, TP2 mid-term, TP3 long-term.
Big player with huge potential.
Yesterday partnered with DigiByte & 1INCH.
Considering its nature, the project will continue to announce partnerships.
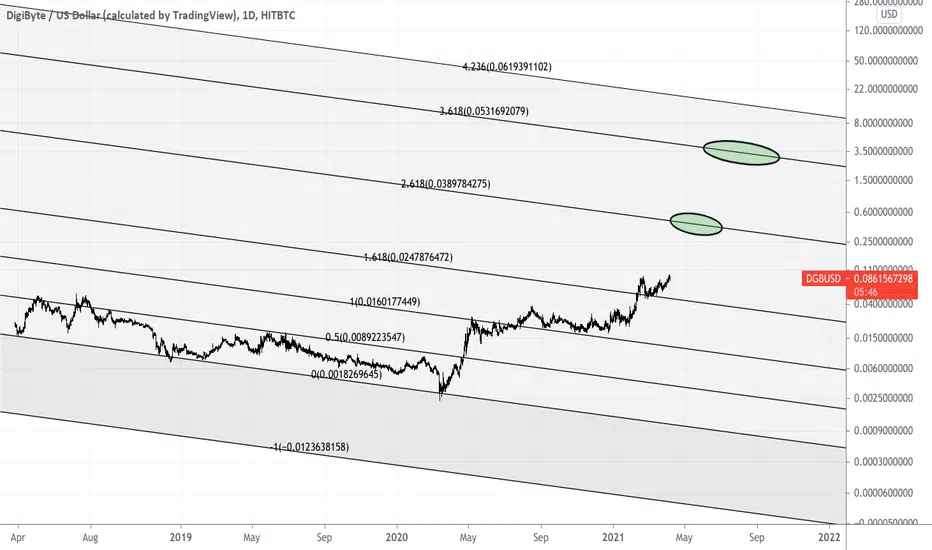
DGB LEVELING UPlooks like .40 is on the table
price action seems to be heading towards next fib channel level
good luck hodlers!
the ride looks like it is about to start!

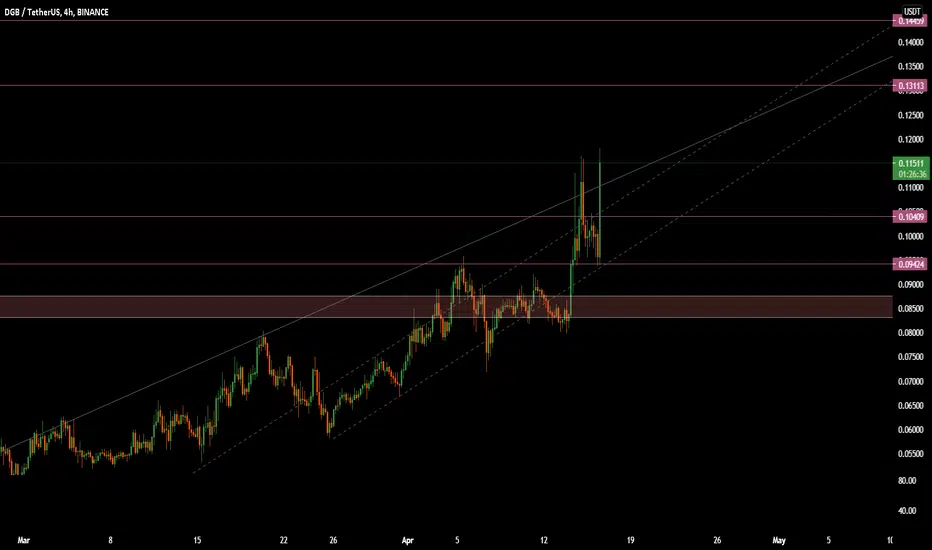
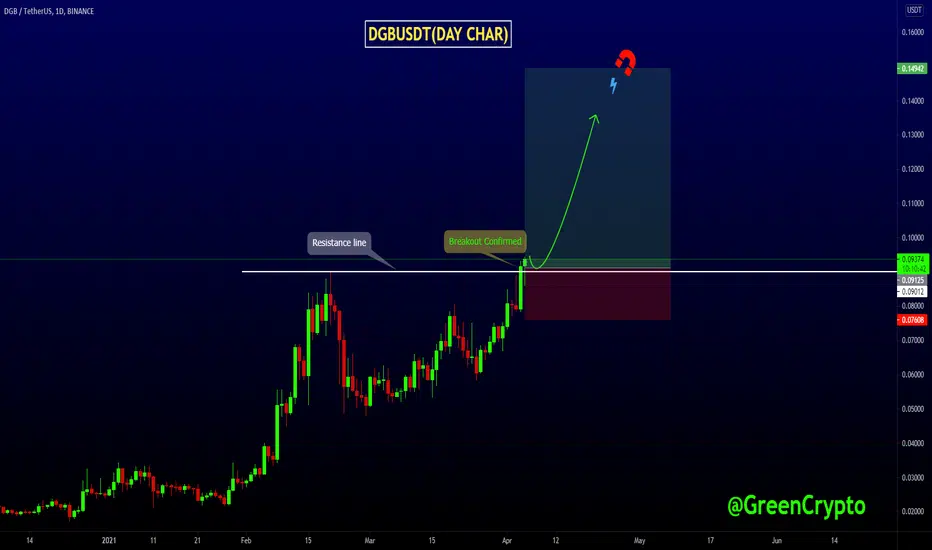
DGBUSDT Breakout Confirmed!! DGBUSDT (Day CHART) Technical Analysis Update
Resistance Breakout in day chart
DGB/USDT currently trading at $0.093
Buy-level: $0.090 -$0.094
Stop loss: Below $0.075
Target 1: $0.110
Target 2: $0.125
Target 3: $0.135
Target 4: $0.150
Max Leverage: 2X
ALWAYS KEEP STOP LOSS...
Follow Our Tradingview Account for More Technical Analysis Updates, | Like, Share and Comment Your thoughts.

DIGIBYTE taking a nibble out of a resistance level at 8 centsDigibyte is rubbing up against an old friend, MR. 8 cents. He's nibbling away at it, having broken through his symmetrical triangle, but he seems to lack momentum and volume to push on through. Remember FORCE = Mass X Acceleration... It seems Digibyte needs a little more acceleration to drive through to a new high. I believe will stall and then push on through.

DGB/BTC BreakoutDaily Chart - Triangle Breakout,
We are not registered or licensed in any jurisdiction whatsoever to provide investing advice or anything of an advisory or consultancy nature.
and are therefore are unqualified to give investment recommendations.
Always do your own research and consult with a licensed investment professional before investing.
This communication is never to be used as the basis of making investment decisions, and it is for entertainment purposes only.

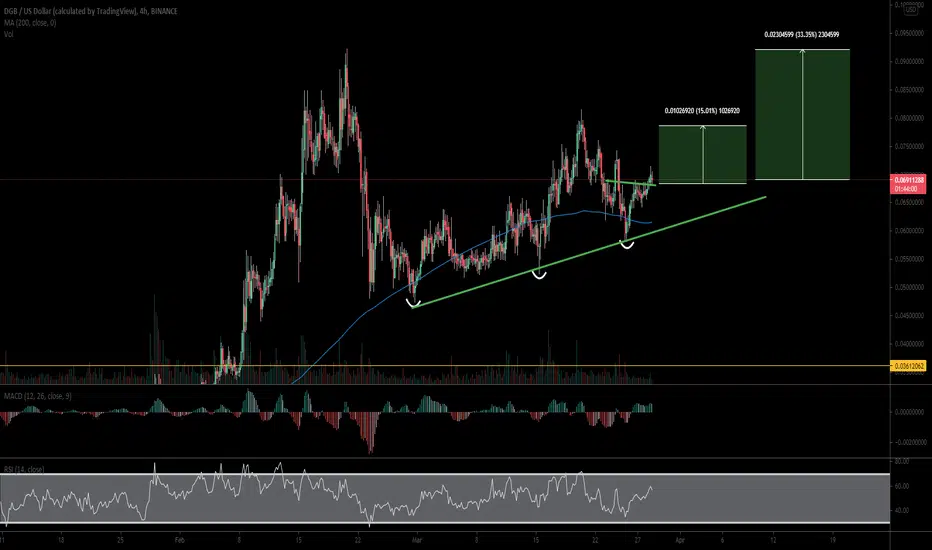
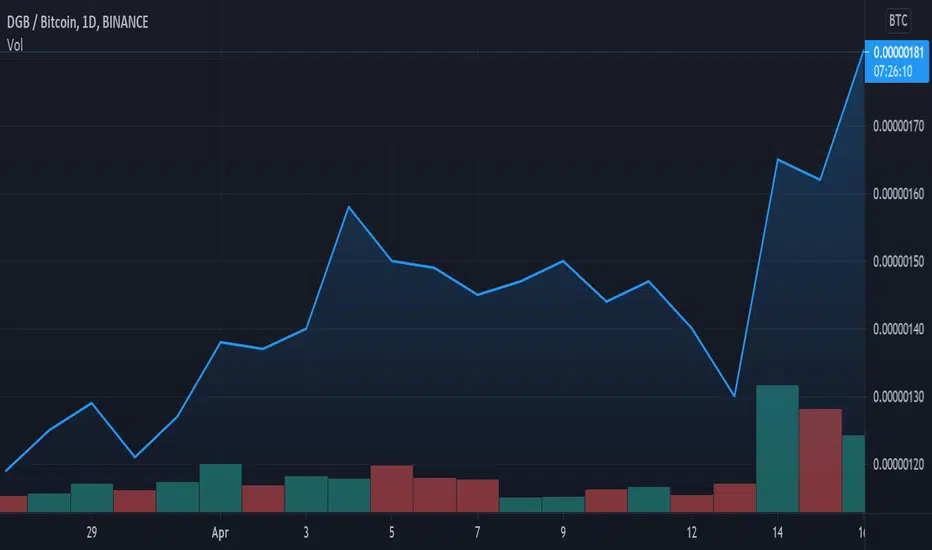
Is Digibyte getting ready for a breakout?Is Digibyte getting ready for another breakout? There's a few things on the chart that makes me think it will. All of 2021 it has been in a uptrend. DGB did get a little a head of itself and tried breaking the 200ma. It got rejected we never got a close above it. Since then we've touched the 200ma two other times and swiftly got rejected. We have however formed two higher lows and the last few days the 50ma has been holding very nicely acting as support. We are setting up for a MA cross with the 50 and 200 day which I consider bullish. We've also been holding up in a area where we've seen the buying since pre December.
What I what I want to see to know this trade is intact is a close above the 200ma and it hold for a day or so. I do think we may get rejected at it one more time and form another higher low. If I see a lower low formed below 115 I may possibly consider that the trend has reversed and close the trade.
Best of luck on your trades!
