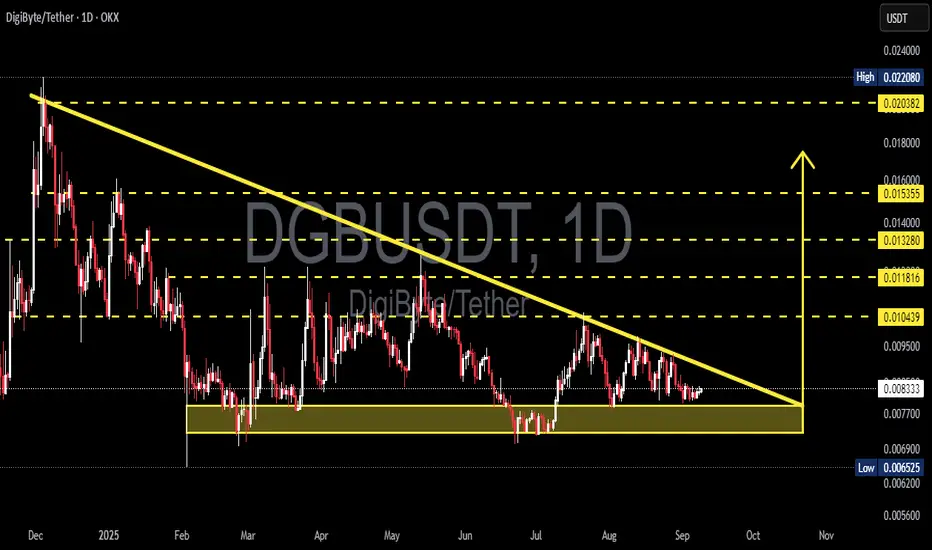
DGB/USDT — Descending Triangle at a Critical Demand Zone🔎 Technical Overview
On the daily chart, DGB/USDT is forming a descending triangle, with a clear downward sloping trendline acting as dynamic resistance and a horizontal demand zone around 0.0065 – 0.0077 USDT providing strong support.
This setup reflects a phase of accumulation or distribution, where the market is preparing for a decisive move: either a bullish breakout above the descending trendline or a bearish breakdown below the demand zone.
---
📊 Key Technical Levels
Current price: 0.008295
Demand zone (support): 0.0065 – 0.0077 (yellow box)
Upside resistance levels:
0.010439 → first breakout confirmation
0.011816 → secondary resistance
0.013280 → mid-term target
0.015355 → extended target
0.020382 & 0.022080 → major upside levels if momentum accelerates
---
🟢 Bullish Scenarios
1. Confirmed Breakout (conservative):
If the price manages to close a daily candle above the descending trendline and reclaim 0.010439, bullish momentum is likely to strengthen.
Targets: 0.0118 → 0.0132 → 0.0153
Key signals: rising volume, RSI recovery, strong daily green candle.
2. Bounce from Demand (aggressive):
If price retests the 0.0065–0.0077 zone and bounces, this area may serve as a strong accumulation point.
Stop loss: below 0.0063–0.0065.
Initial target: 0.0104, with extensions to higher resistances.
Risk-to-reward ratio could be highly favorable if the bounce holds.
---
🔴 Bearish Scenario
A daily close below 0.0065 would confirm the descending triangle breakdown.
This breakdown could trigger further downside with a target toward 0.0056 or lower.
After the breakdown, the 0.0065–0.0077 zone would flip into a supply zone (resistance).
---
📌 Pattern & Sentiment
Descending Triangle: traditionally considered a bearish continuation pattern, but in crypto markets, upside breakouts are also possible.
Historical Demand Zone: the highlighted yellow box has been tested multiple times since March 2025, making it a key psychological support.
Market Sentiment: the reaction around this zone and the ability to break the trendline will dictate the medium-term direction.
---
⚖️ Conclusion & Strategy
Bullish play: wait for a breakout above 0.0104 with strong volume (safer) or accumulate cautiously in the demand zone with a tight SL (riskier).
Bearish play: a daily close below 0.0065 signals breakdown and opens the door for deeper declines.
Risk management: always use stop loss and limit exposure to 1–2% risk per trade.
DGB is currently at a make-or-break point. Whether buyers can defend the demand zone or sellers push through support will define the next big move.
---
#DGBUSDT #DGB #DigiByte #CryptoAnalysis #TechnicalAnalysis #DescendingTriangle #CryptoTrading #SupportAndResistance #Altcoins
Digybte
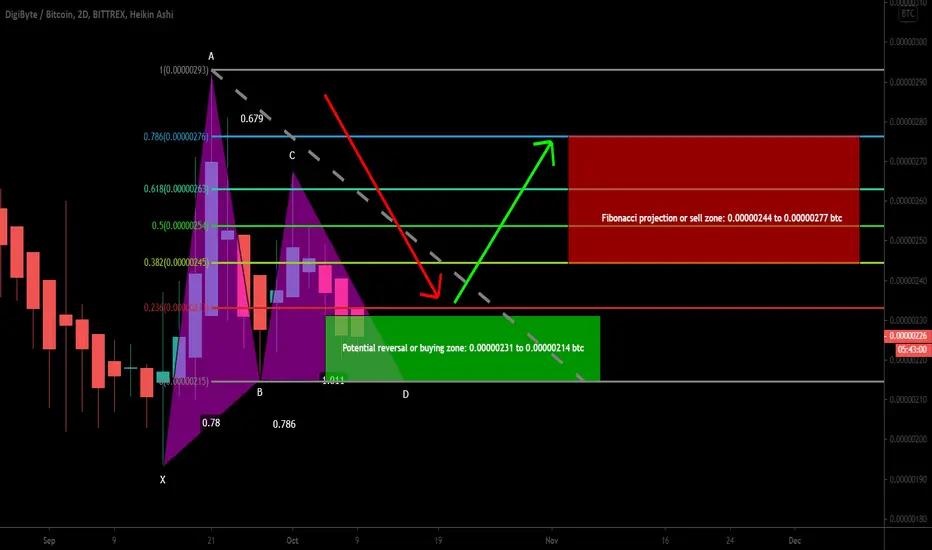
DGBBTC formed bullish Gartley | Upto 29% move expectedThe priceline of Digibyte (DGB) has formed bullish Gartley on the 2 day chart, the targets as per Fibonacci sequence of Gartley are:
Potential reversal or buying zone: 0.00000231 to 0.00000214 btc
Fibonacci projection or sell zone: 0.00000244 to 0.00000277 btc
Regards,
Atif Akbar (moon333)
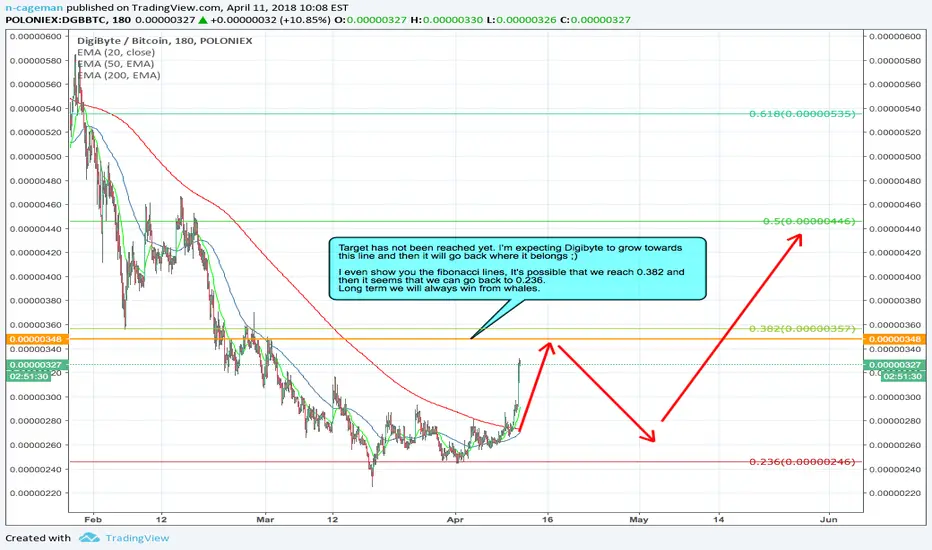
Digibytes break out confirmed? Not yet.
Digibyte has been pumped by some whales who gave a sign and the sheeps followed their signs.
Due to their sign there was a massive buy by the followers of these groups and they will massively dump when Digibyte reach 349 satoshi.
Be aware of these kind of 'traders'. I expect Digibyte to reach the fibonacci level when it's not dumped to much and after it will correct towards a lower fibonacci level. If it does not decrease lower than where we started we will see the third wave of Elliot and we will have a bullish trend confirmed.
Peace out.