DIS

$DIS Watch what it does if it retraces to $130 level$DIS Watch what it does if it retraces to $130 level


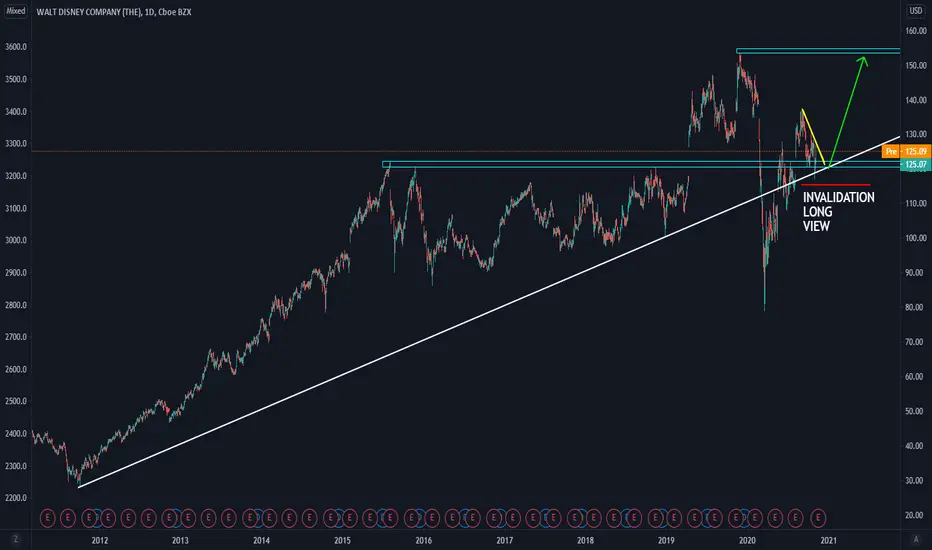
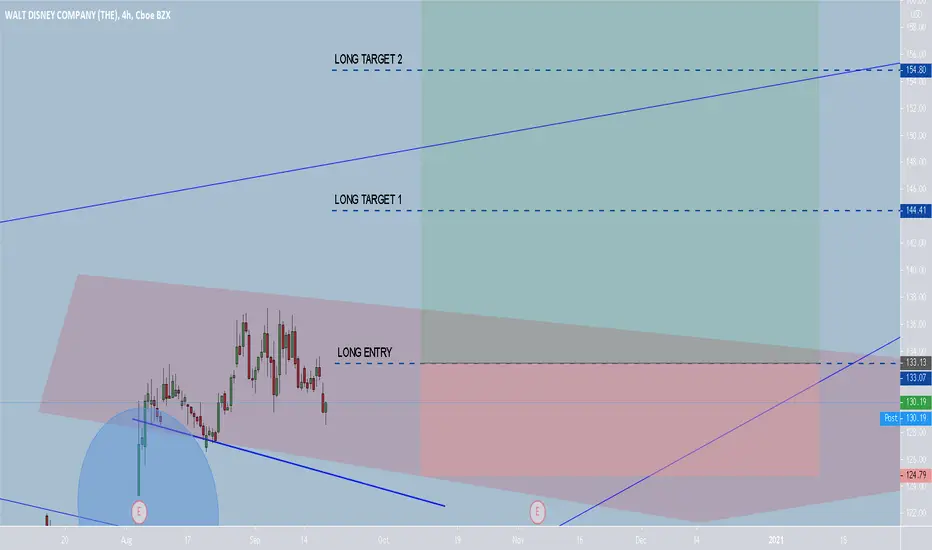
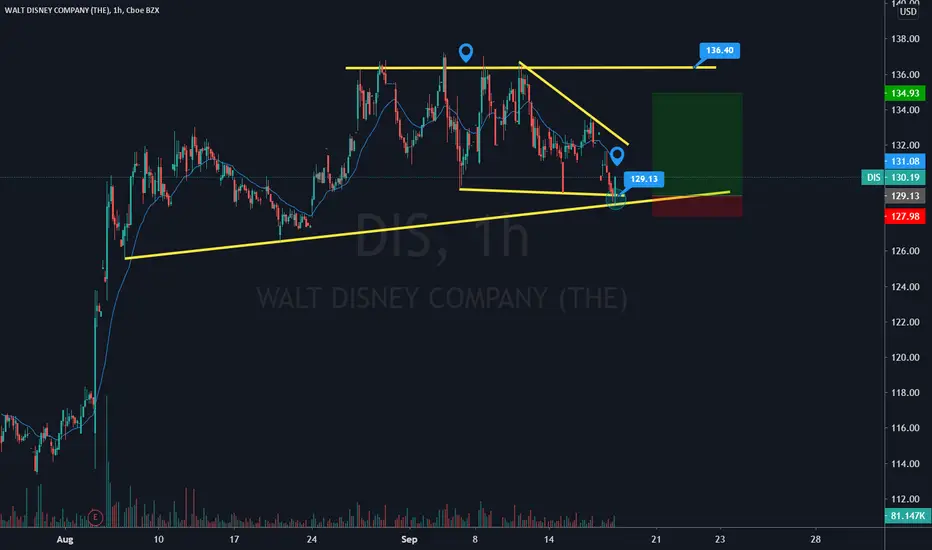
Clear bullish potential for The Walt Disney Company Today we will explain the reasons we see a clear path for DIS towards the All-time highs zone.
a) We can see an ascending trendline that has been respected
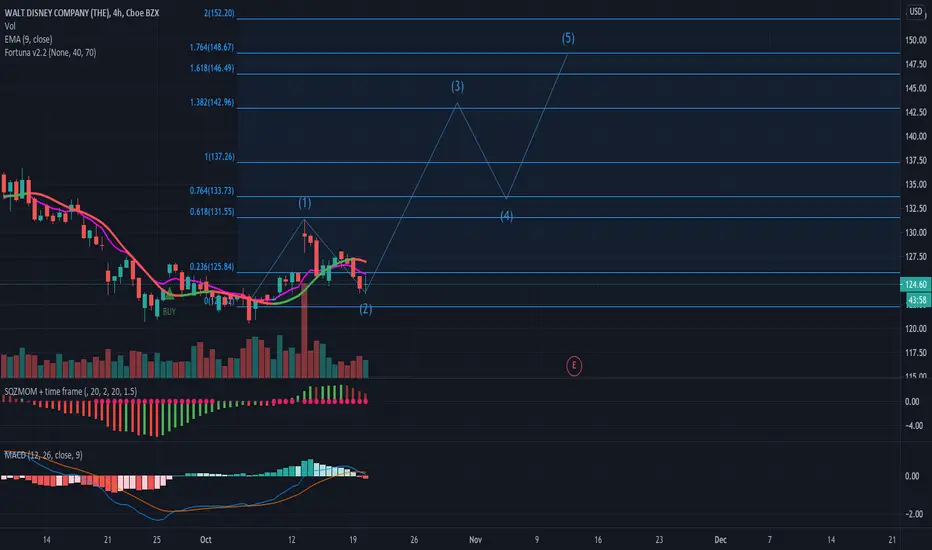
b) Currently, we see a corrective structure (sideways movement composed by an ABC)
c) Remember that corrective structures are a continuation pattern when being preceded by an impulse
d) If we have a breakout of the corrective structure (yellow line) we expect a continuation movement towards the all-time highs zone
e) Also we know that any forecast can go wrong and we have an invalidation level (red line). If the price reaches that zone we will assume that we were wrong and we will cancel any pending setup
f) Remember: Protect your capital, and trade safe!
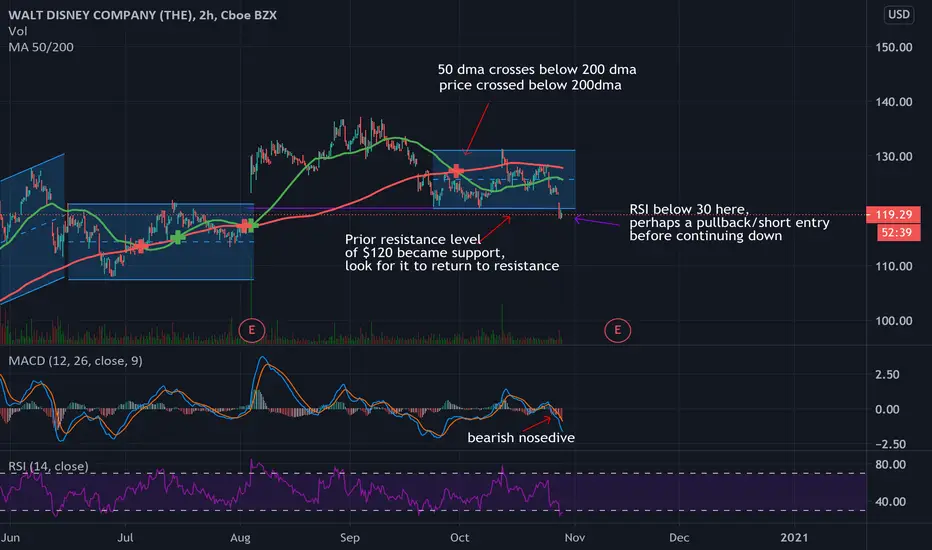
Previous level of resistance returning for DISDIS has crossed below a previous level of support at $120 that existed for about a month (Sept 24 to Oct 26). That level acted as resistance for a month and a half June 16-August 5 2020. MACD is below indicator line and below midline. RSI is below 30%, so we're probably looking at a pullback to the upside as I write this. Whether this will be a rebound or a pause before continued decline remains to be seen, but based on the MACD and the price action, I'm anticipating the latter.
****This information is presented for discussion only and does not represent advice to buy or sell a security.*****
DIS going for LongAfter the decleration that the company having re-organization, with the emphasis on the TV content, the stock jump 5% up, then had a correction and now closed to uptrend line.
Looks like a good time to take it for long:
Take profit @ 135$
Stop loss @ 119.5$

DIS double bottom within wedge. Big breakout possible.Looking at a double bottom about to go up. If it goes through, it could also pass through a big descending wedge.
With SPY also currently breaking out of a channel and heading for a flag breakout itself (see last post) its a good sign DIS will do well today.

DIS - SWING ANALYSISDIS - As per the daily chart it's about to break the support zone and expected to fall further.
Key levels ;
Sell at the current price 124.23
Maintain stop loss around 131
Potential downside target 114.80
Follow the levels as mentioned.
Hit the like button & write in the comment section. Thanks

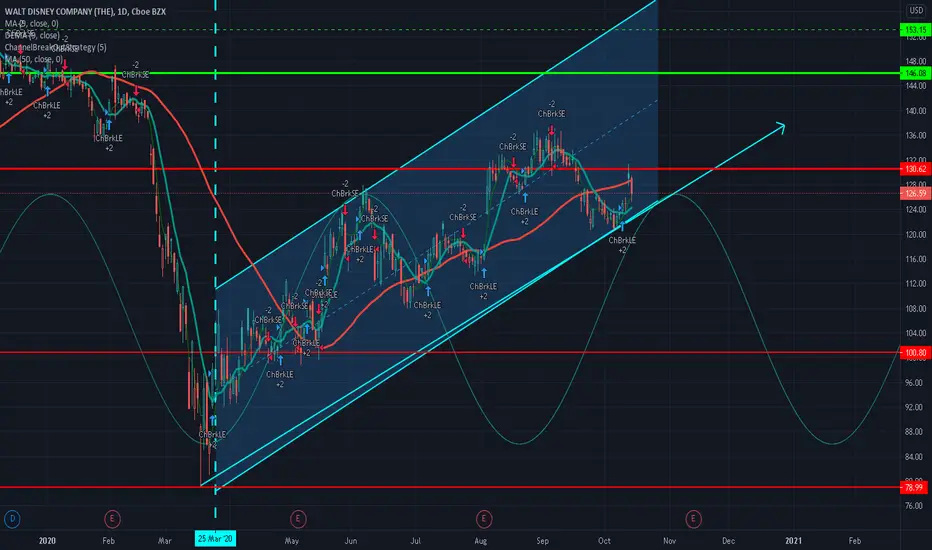
$DIS looking for break up channelLooking for price to break the read area ( long term down trend resistance.
Ideally the longer blue line support up trend. Mullti weeks targets, looking for new support areas in the coming months over $170.
When Disney take over the world, buy and hold
DIS - SWING ANALYSISDIS - On daily chart & daily candles momentum is good in positive bias, Good potential breakout is there.
Good buy here at current price 125
Proper stop loss around 118
Target should be around 137 - 150
Hit the like button & follow for more such analysis.

DIS Double BottomDIS is now showing an indication that it will form Double Bottom pattern. Since the candle was going outside the bearish channel, and it tends to follow the bullish trendline, then there is a strong possibility that it will form the Double Bottom pattern. Don't forget to set your stop loss.
If you like my idea, then please click Like, Follow, and Comment.
Cheers.

WALT DISNEY COMPANY SHORT📉 NYSE:DIS SHORT H4
🛒SELL BELOW = 120.70
🎯Target1 = 116.45
🎯Target2 = 113.80
🎯Target3 = 109.60
🛑Stop loss or cancel trade = 127.60
🙈Recommended risk = (2%-3%)
#DIS #DISSHORT #SELLDIS

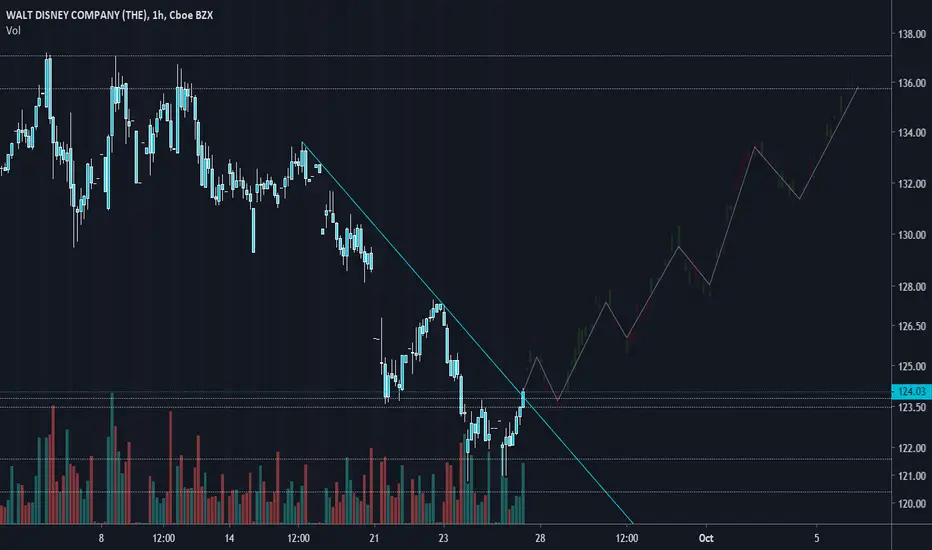
DISKey level held on daily time frame. 1H down trend broken. Expecting retest of 1H S/R level before reversing into uptrend back to daily S/R level at $136.
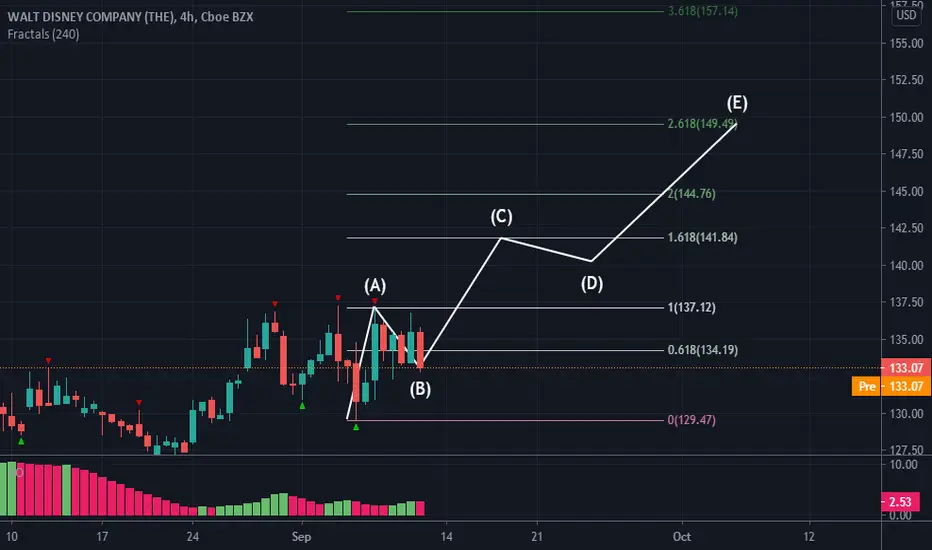
WALT DISNEY COMPANY LONG📈 NYSE:DIS LONG H4
🛒BUY above = 137.15
🎯Target1 = 141.80
🎯Target2 = 144.70
🎯Target3 = 149.50
🛑Stop loss or cancel trade = 121.30
🙈Recommended risk = (1%-2%)
#DIS #DISLONG #BUYDIS #LONGDIS #DISBUY
$DIS Bulls 3-Press In To Support$DIS had a bit of a stumble dipping down but, to unsuspecting bears (so far), buyers were waiting for the right time to strike. The massive one-two punch of a 3-Press Low Pattern dipping in to rising support was good enough but if anyone doubted them, the bull bar closed out super strong. Either the buyers rip this higher or this is a final stand and we get a strong break down.
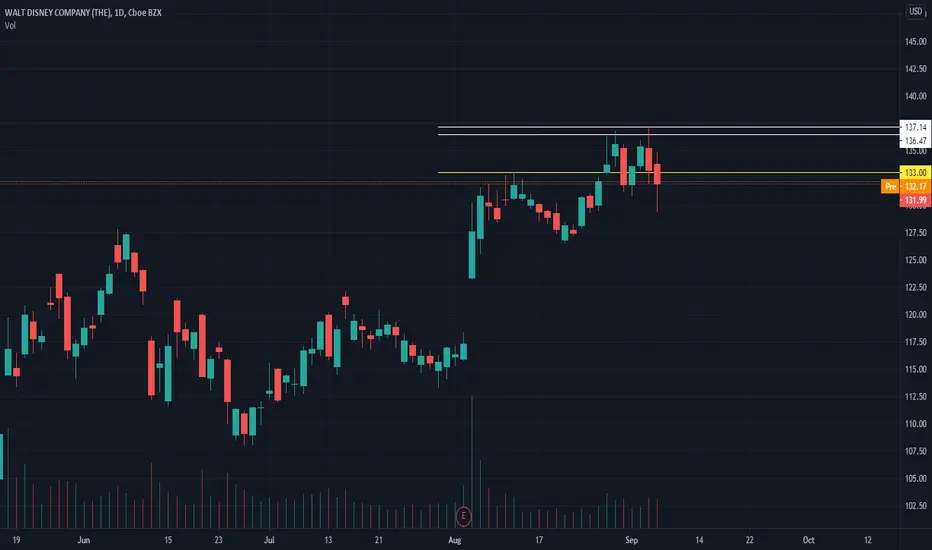
Disney starting to trade in a channel Disney over the last week or two seems to have formed multiple tops and bottoms at about 137 and 131 respectively. At least in the short term I'm expecting that to continue. I dont think I need to state the obvious on when to go long/short, but watch the RSI/volume and should this trend be broken, consider either of these points could flip to be a resistance/support.

DIS*DEUTSCHE BANK UPGRADES DIS FROM HOLD TO BUY*
DIS LOOKS STRONG PREMARKET. I WOULD CONSIDER GOING LONG OVER 133. LEVELS ABOVE ARE 136, 137.
DIS long or short ideaDIS has some gaps to fill on the way down but Also gaps to to the away up. I am looking for a long position on DIS. VIX is high right now so I want to practice caution on trades right now. The DOA sniper incidator that the 4hr trend is still a short basis. NYSE:DIS

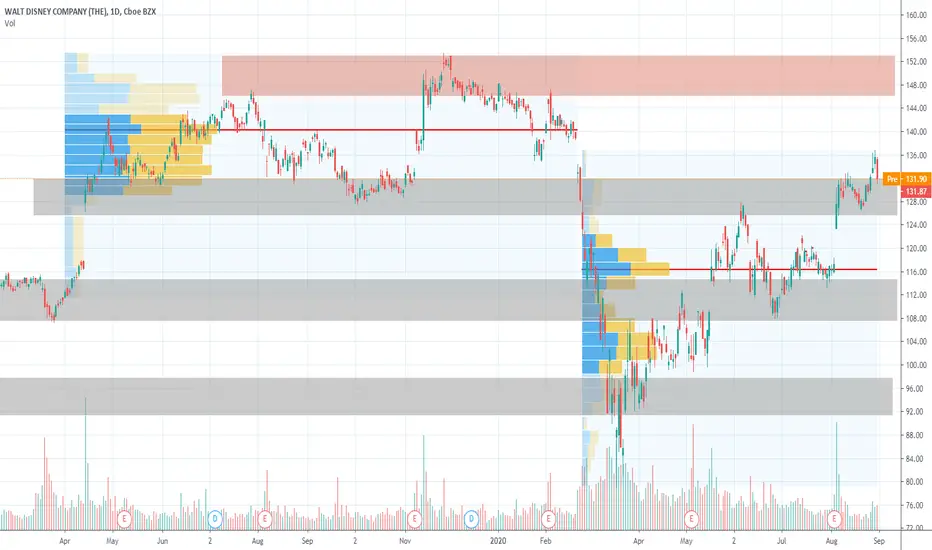
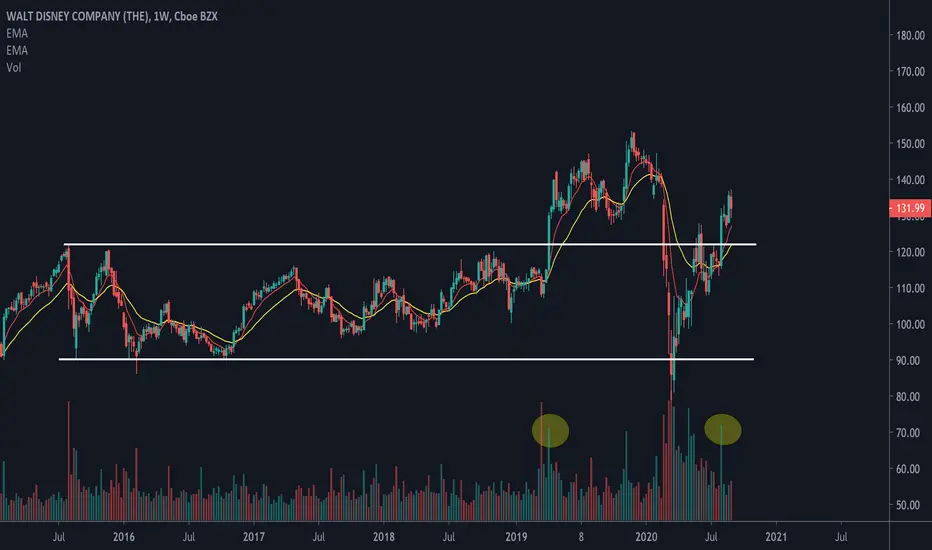
$DIS holding up well (potential value play)This is the weekly chart for $DIS.
In April '19, a huge volume spike propelled the stock out of its multi year trading range. It went on to trade as high as $153 a few months later, before falling back to its range.
Early last month, we see a similarly huge volume spike out of its trading range. Prices held, just like what it did back then; more importantly, the recent sell off in tech did not hit other industries as hard -- this is possibly a sign of sector rotation towards value stocks.
I have a small position in $DIS and am looking at a target of around $150
DIS - Walt Disney buy support zonesHello traders,
Description of the analysis:
Walt Disney Company ( DIS ) support zones ideal for timing long positions (gray). Trade what you understand, trade carefully and sparingly according to the business plan.
About me:
Hi, my name is Jacob Kovarik and I´m trading on stock exchange since 2008. I started with a capital of 3000 USD. My first strategy was based on OTM options. (American stock index and their ETF ). I´ve learnt on my path that professional trading is based on two main fundaments which have to complement each other, to make a bussiness attitude profitable. I´ve tried a lot of techniques and many manners how to analyze the market. From basic technical analysis to fundamental analysis of single title. My analytics gradually changed into professional attitude. I work with logical advantages of stock exchange (return of value back to average, volume , expected volatility , advantage of high stop-loss, the breakdown of time in options, statistics and cosistent thorough control of risk). At the moment, my main target is ITM on SPM index. Biggest part of my current bussiness activity comes from e mini futures (NQ, ES). I´m trader of positions. I´m from Czech republic and I take care of a private fund (over $4.000.000 USD). During my career I´ve earned a lot of valuable experience, such as functionality of strategies and what is more important, control of emotions. Professional trading is, in my opinion, certain kind of mental training and if we are able to control our emotions, accomplishment will show up. I will share with you my analysis and trades on my profile. I wish to all of you successul trades.
Jacob