DIS Call Option Loading – $117 Breakout Imminent?## 🎯 DIS Weekly Call Setup – 117C by Friday? Institutions Are Betting Big! 💥
**🧠 Summary of Smart Model Consensus (2025-08-06)**
> ⚖️ *Mixed Momentum, But Bullish Flow Stands Out*
---
### 🔍 5 AI Models – Here's What They're Seeing:
**📈 Grok/xAI:**
✅ *Bullish Weekly Flow* (Call/Put ratio: 2.54)
✅ *Institutional Accumulation* on high volume
⚠️ *Daily RSI still bearish*
⚠️ *High Gamma Risk* – short expiry window
**🔻 Gemini/Google:**
🔻 *Bearish RSI across daily/weekly timeframes*
📉 *Heavy Sell Volume* = Distribution
💬 *Bullish flow might be retail noise*
**🔄 Claude/Anthropic:**
✅ *Oversold RSI* = Possible Relief Rally
✅ *High Call Flow & Favorable Volatility*
⚠️ *Momentum Weak* – proceed cautiously
**📊 LLaMA/Meta:**
⚖️ *Mixed Signals* – leaning Bullish
⚠️ *Gamma Risk* critical with only 2 DTE
📈 *Support/Resistance Levels Must Guide Entry*
**🔻 DeepSeek:**
🔻 *Weak momentum, institutional selling*
⚠️ *Contrarian Bearish Position*
🎯 Targets breakdown support
---
### 🧠 Model Consensus:
💡 *Mixed Signals* → **Cautious Bullish Bias**
✅ *Institutional Flow + Oversold RSI*
⚠️ *Gamma + RSI Risk = Manage Entry & Exit Tightly*
---
## 📈 Recommended Trade Setup:
| 🔧 | DETAILS |
| ---------------- | --------------------------- |
| 🎯 Instrument | `DIS` |
| 🎯 Direction | **CALL (LONG)** |
| 💰 Entry Price | **\$0.72** |
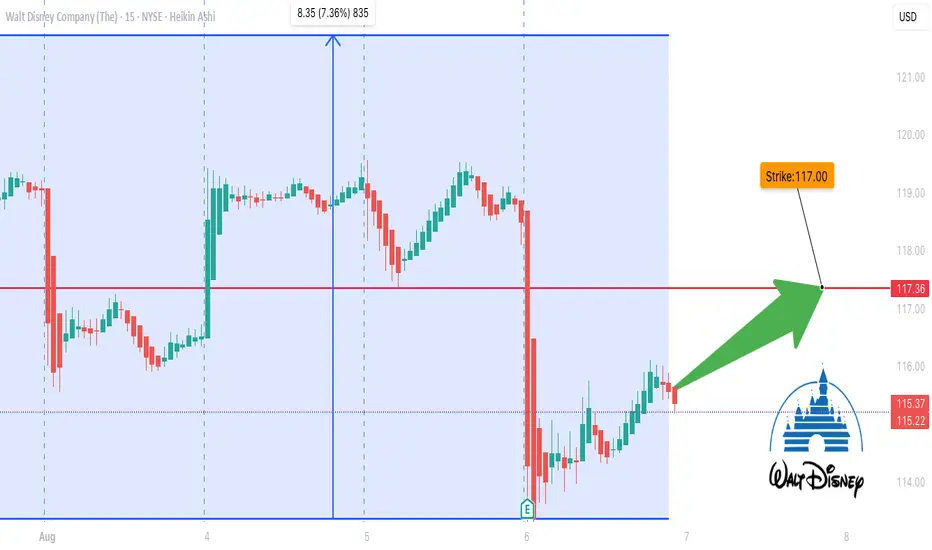
| 📌 Strike | **\$117.00** |
| 📅 Expiry | **Aug 8, 2025 (2 DTE)** |
| 🎯 Profit Target | \$1.25 – \$1.80 *(75–150%)* |
| 🛑 Stop Loss | \$0.36 *(50% premium)* |
| 📈 Confidence | **65%** |
| ⏰ Entry | **At Market Open** |
---
### ⚠️ Key Risks:
* 🧨 **Gamma Risk:** Volatility can cause price to explode or implode quickly
* 📉 **Bearish RSI trend** still in play – this is a **speculative short-term trade**
* 🎢 Only **2 Days to Expiry** — manage actively
---
### 🧠 Final Thoughts:
This is a **tactical high-upside, short-dated bet** on a potential bounce in \$DIS. Institutions are positioning early — retail might be late to this move. Risk tightly, but reward could be explosive.
---
**📌 TradingView Hashtags:**
`#DIS #OptionsAlert #WeeklyOptions #CallOptions #GammaSqueeze #UnusualOptionsActivity #TradingStrategy #SmartMoney #TechnicalAnalysis #SwingTrade #HighRiskHighReward #BullishFlow`
Disneytrade
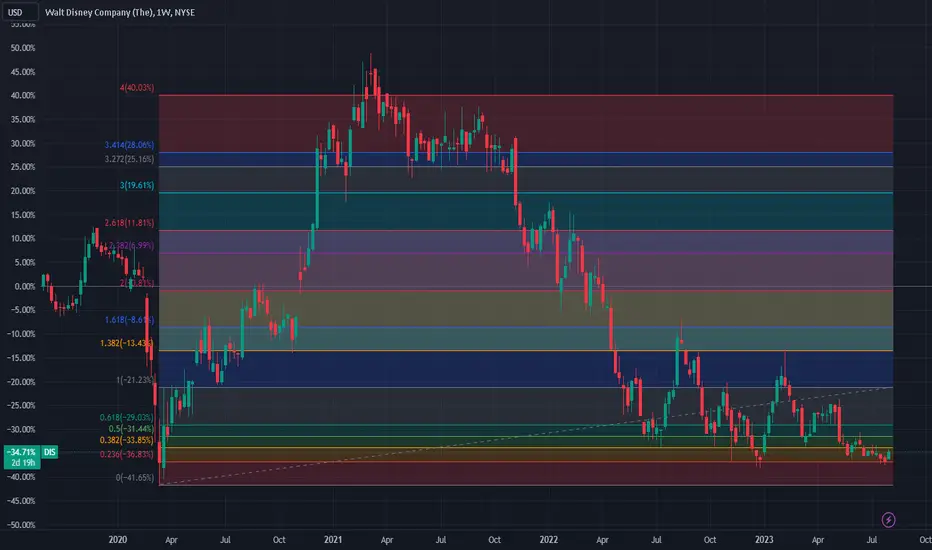
Disney stock has maintained strong support in the past 10 weeksDisney's stock has maintained strong support levels in the past 10 weeks
This chart shows the weekly candle chart of Disney stocks from the end of 2019 to the present. The graph overlays the bottom to top golden section at the beginning of 2020. As shown in the figure, Disney's stock has maintained strong support levels in the past 10 weeks, with inter district fluctuations above the golden section's 0.236 level! Once Disney stocks close below this strong support level for three consecutive trading days, the downside space opens up and it is likely to fall below the low point of early 2020!
Disney Short positionOn the chart we can see that the price broke down of the rising channel. It looks like the upsloping support has already failed, therefore we expect that the price go lower.
You can enter the short position now as the support failed.
Target is shown on the chart.
Invalidation of this thesis would be if the price comes back above upsloping support line.
