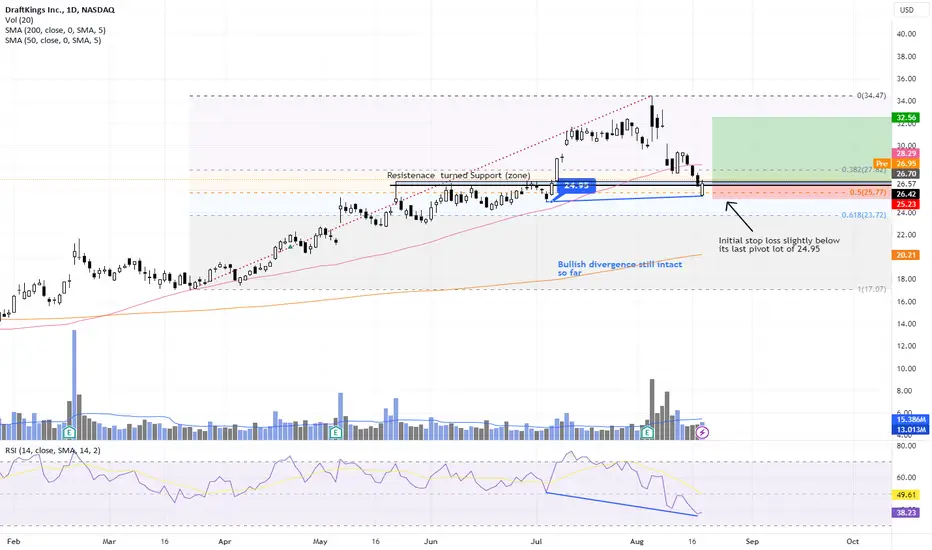
DKNG - potential entry above 26.90DKNG has corrected back to a possible near term resistence-turned-support @ 26.50 - 26.80.
Currently the bullish divergence between it's price and RSI is still intact (will be negated if price dips below its last pivot of 24.95).
I would consider to test a long entry for DKNS if it starts to go above the last candle high of 26.89 with an initial SL just slightly below its last pivot low of 24.95.
As swing trader, I will be trailing my stops on the way up should the trade works out.
Disclaimer: Just my 2 cents and not a trade advice. Kindly do your own due diligence and trade according to your own risk tolerance and don't forget that money management is important! Take care and Good Luck!
Divergence
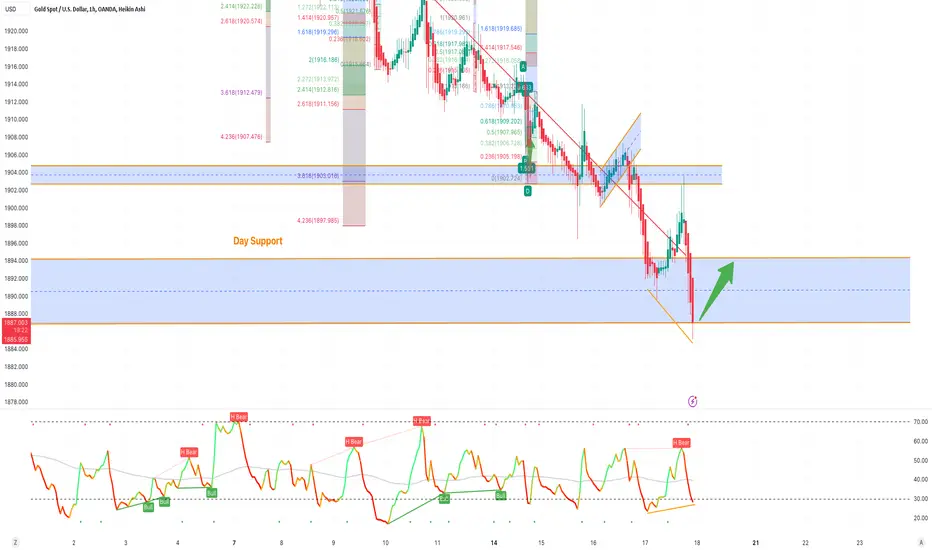
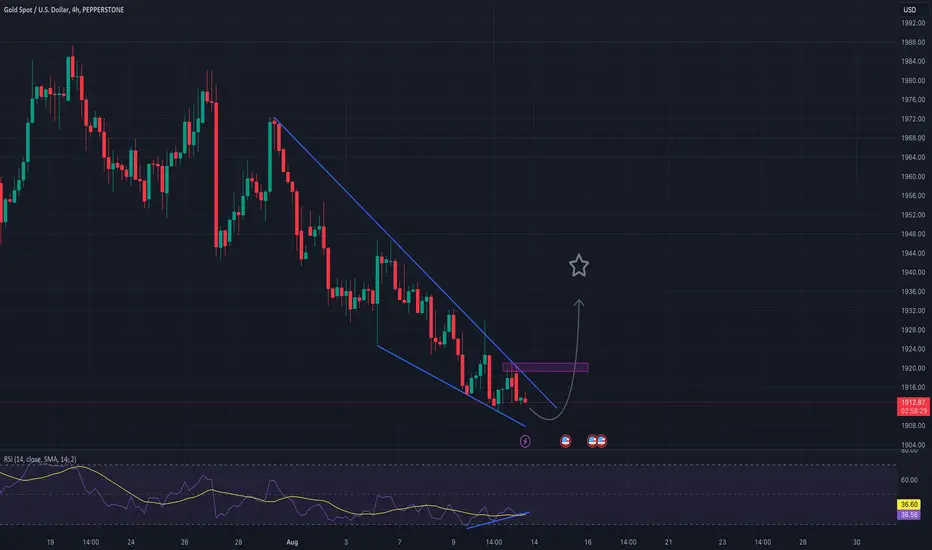
XAUUSD Bullish DivergenceXAUUSD having bullish divergence on1hr time frame and also beearidh divergence on DXY.
Manage your risk Accordingly!
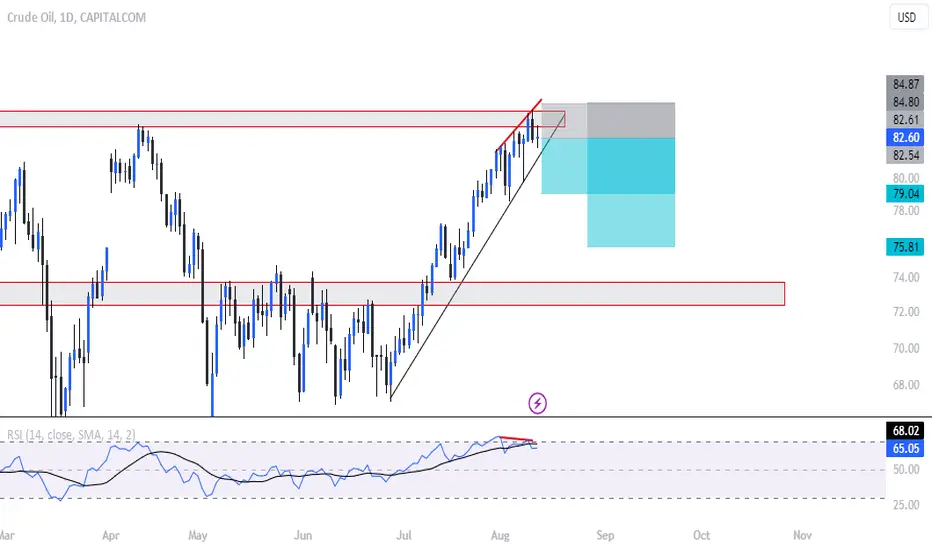
OIL - SHORT DIVERGENCEThe price reached a resistance level and the price is creating a divergence to thee RSI. The price is going up for more than a month and I expect a pullback. TP1 79.00 TP2 75.80
A brutal movement in the price action of FORD
During my thorough analysis of FORD's 4-hour price action, an intriguing revelation emerged: a hidden bullish divergence, a distinct pattern that warrants attention. This intriguing phenomenon is characterized by the following indicator values:
- A price of $11.29 accompanied by a Relative Strength Index (RSI) of 38.96.
- Another price point at $11.99 coupled with an RSI reading of 18.84.
The RSI was more oversold at 11.99 $ then it was at 11.29 $ indicating that this was an overall uptrend and we now that if something is oversold, it should continue up and there you have your confirmation for your uptrend continuation making this a good place to enter.
Also please note that I would usually use the RSI on a 1H time frame to find these divergences, but here we have been able to detect them on a higher time frame such as the 4H which means that this is a more higher and accurate signal compared to the other regular one which makes these a more confident trade!

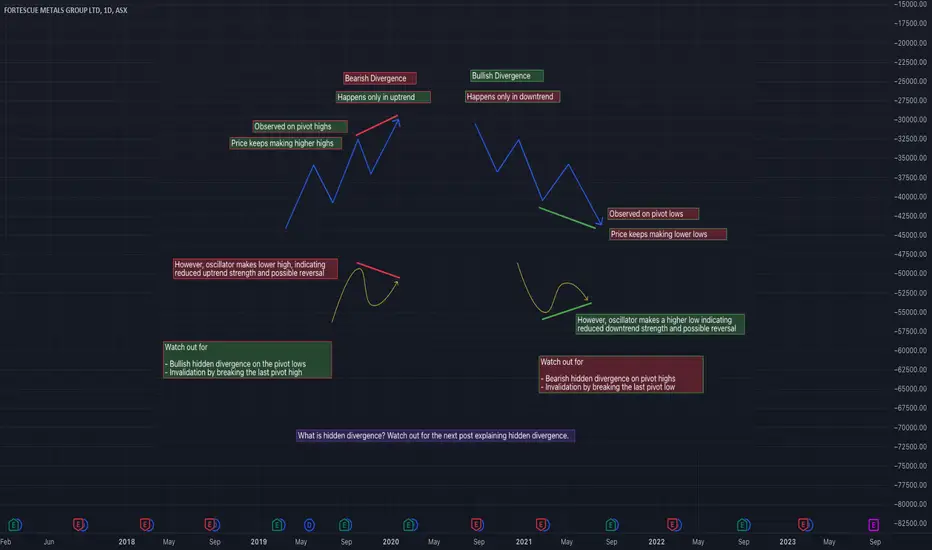
Quick Look - Bullish Divergence vs Bearish DivergenceHere is a graphical representation of the simple concept of bullish and bearish divergences.
Rules are pretty clear
Bearish Divergence
Happens only in uptrend
Observed on pivot Highs
Price makes higher high whereas oscillator makes lower high, indicating weakness and possible reversal
Bullish Divergence
Happens only in downtrend
Observed on pivot Lows
Price makes lower low whereas oscillator makes higher low, indicating weakness and possible reversal
Watch out for hidden divergences on the opposite pivots and breakouts in the direction of trend.
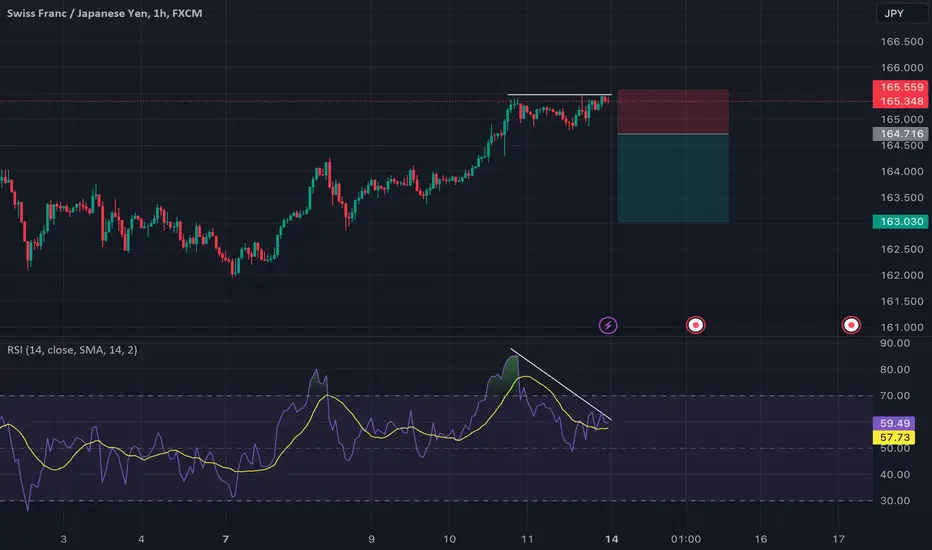
CHFJPY could go downThe CHFJPY has hit an all-time high, however, a divergence has been identified at 1 day and there is a possibility it may occur at 4 hours, with a double top emerging at 1 hour. Technical analysis indicates that a reversal of the trend is expected.
U - Bullish DivergenceU had been building a base since Last Sept (10 months in the making now) and had remained above its 200-day moving average since 6th June this year. We also saw a Golden Cross on 28th June. Hence the longer-term picture of U remains potentially bullish except that it has been very volatile since its first attempt to break above its basing neckline @ 42-43 on 16 June.
U has now broken up its neckline for the 3rd time (since 16th June) and once again, experienced another steep pullback (for the past 5 days). The pullback now appears to be stalling at the neckline and a bullish divergence is between its price and RSI is also emerging.
Could this bullish divergence be a clue to its earnings announcement (expected on 2nd Aug)?
However, bear in mind there is always an inherent risk to trade during earnings.
Should the stock be able to stay above its neckline in the coming days, then the odds have increased that it's uptrend could gain more stability (just hopefully though!). Meanwhile, buying the dips is still a safer way to approach this stock.
Disclaimer: Just my 2 cents and not a trade advice. Kindly do your own due diligence and trade according to your own risk tolerance and don't forget that money management is (probably the most) important! Take care and Good Luck!

NQ - Bearish Divergence (short term pullback imminent?)A bearish divergence can be seen on both the SPX and Nasdaq (with similar divergences also seen on most of the FAANGT stocks), coupled with the fact the indices are now in the overbought territory, a pullback in the near future could be likely.
We saw both NFLX and TSLA sold off after hours despite strong earnings announcements. The market has been running into earning season and a correction would not be too surprising even if earnings are good ("buy" on expectations and sell on "news").
That said, divergences on the daily chart usually predicts a short term reversal (lasting several candles on the average) and not a predictor of a bigger trend change (unless seen on larger time frames like the weekly, if not monthly).
The market remains in uptrend with good support around 15100 - 15300 region. This is an area comprising:
1. a horizontal resistence turned support
2. the 50% to 61.8% fibonacci retracement of the recent AB swing
3. gap fills @ 15300 and also 15120
However, be wary should it break the support @ 15100. So let's see what happens.
Disclaimer: Just my 2 cents and not a trade advice. Kindly do your own due diligence and trade according to your own risk tolerance and don't forget that money management is (probably the most) important! Take care and Good Luck!

Trading RSI Divergence: Unveiling Potential Opportunities In the world of technical analysis, the Relative Strength Index (RSI) serves as a valuable tool for traders seeking to identify potential trend shifts and entry points. RSI divergence, a divergence between the RSI indicator and the price movement, is a powerful signal that can offer insights into upcoming price reversals. This article provides an in-depth exploration of how to identify RSI divergences and the different types that traders encounter.
Understanding RSI Divergence:
RSI divergence occurs when the movement of the RSI indicator diverges from the movement of the price chart. It can signal a change in momentum and a possible upcoming trend reversal. There are two main types of RSI divergence: bullish and bearish.
Bullish Divergence:
Bullish divergence happens when the price forms lower lows while the RSI forms higher lows. This suggests that although the price is trending downward, the RSI is showing potential upward momentum. Bullish divergence can indicate that a downtrend might be losing steam and a bullish reversal could be imminent.
Example of Bullish Divergence :
Bearish Divergence:
Bearish divergence occurs when the price forms higher highs while the RSI forms lower highs. In this scenario, the price is moving upward while the RSI indicates a potential loss of upward momentum. Bearish divergence can signal that an uptrend might be weakening and a bearish reversal could be on the horizon.
Example of Bearish Divergence :
Identifying RSI Divergence:
To spot RSI divergence, follow these steps:
Analyze Price and RSI Trends: Examine the price chart and the RSI indicator. Pay attention to the highs and lows on both the price chart and the RSI line.
Look for Discrepancies: In bullish divergence, when the price forms lower lows, check if the RSI forms higher lows. In bearish divergence, when the price forms higher highs, check if the RSI forms lower highs.
Confirm with Other Indicators: Utilize other technical indicators or chart patterns to confirm the divergence signal. These indicators can strengthen the validity of your divergence findings.
Consider the Trend: Evaluate the prevailing trend on higher timeframes. Divergence signals are more significant when they align with the broader trend direction.
Be Mindful of Timeframes: RSI divergence signals can occur on various timeframes. Consider using multiple timeframes to validate and refine your divergence analysis.
Conclusion:
RSI divergence is a potent tool that traders can use to identify potential trend reversals and entry points. By understanding the different types of RSI divergence and following a systematic approach to identification, traders can gain valuable insights into the underlying momentum of an asset's price movement. Remember that while RSI divergence can provide powerful signals, it's essential to use it in conjunction with other technical analysis tools for a comprehensive trading strategy. 🚀🔍

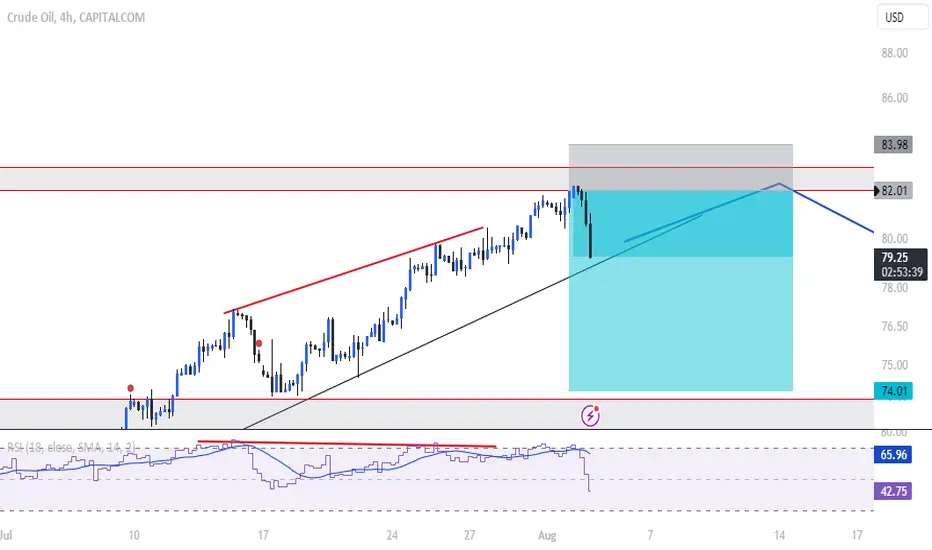
OIL - DIVERGENCE at resistance level! As we see, the oil is very close to resistance level of 82,0 until 83,50. A divergence has formed which is a sign of weakness.
As soon as we see that the price bounces back from the resistance we can place a short order with SL the highs of the structure and TP 74,0.
We are looking at 1:5 RR which is very good risk to reward.
In case we brake the resistance level we look for a different scenario.
Your comments and support are more than welcome!

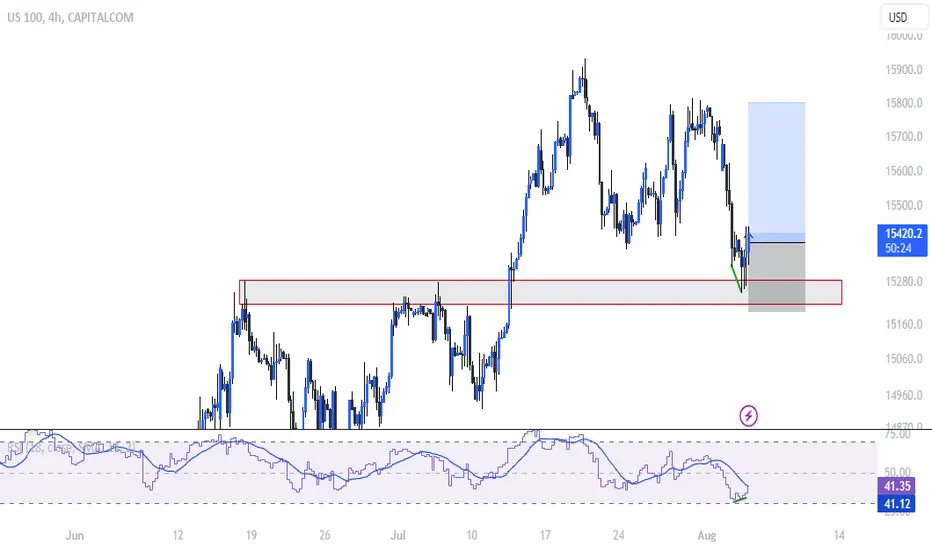
US100 - Long - DivergenceThe price reached a strong support zone, creating a divergence. I believe the price would reach 15.800 and maybe 16.000. I will trade a 1:2 RR.
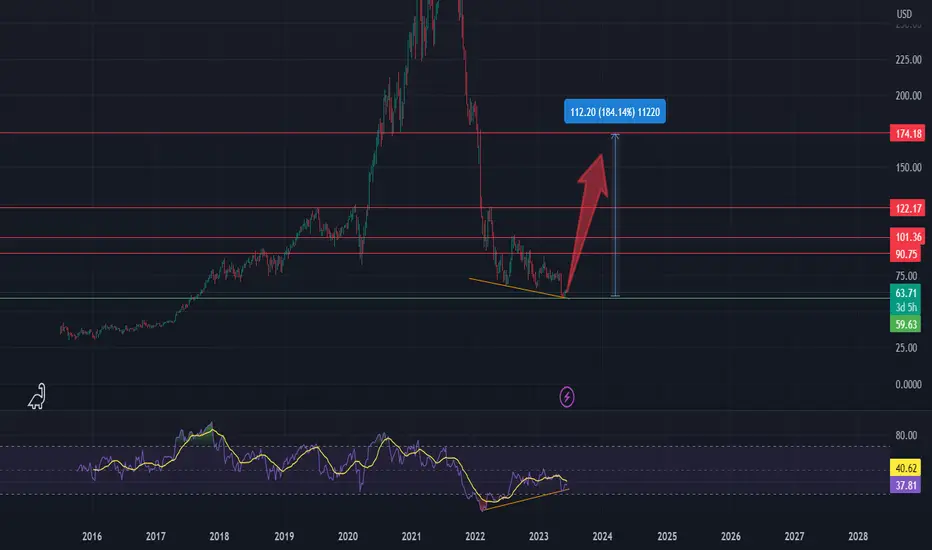
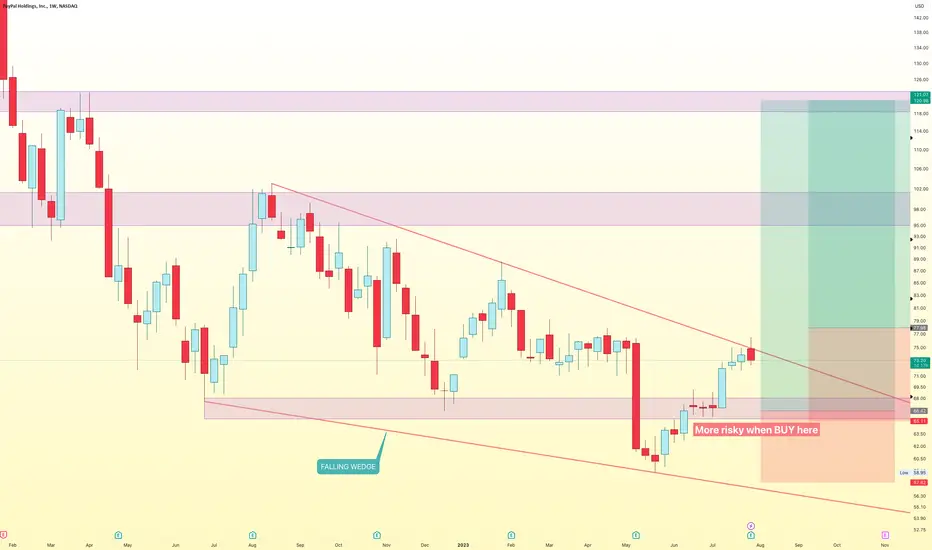
Paypal bullish divergencePaypal isn't performing well. Previously PYPL was downtrending, but the Relative Strenght Index (RSI) is showing regular bullish divergences forming. Long term we expect the price to rise 185 %.
FInal target would be 174 USD.
Time divergence trainingPlease note that the price was able to move from the ceiling during the time period specified in the box, but in the same time box, it could not return that way and it was filled within time. What it means in the market is that the power of buyers is more and there is a positive time divergence.

Divergence in Monthly TimeframeDouble Top
RSI first top = 75 - 80%, overbought;
led to
a
pullback
then
another
secondary
rally
to a
lower
high
where RSI second top = 61%.
DYYDD
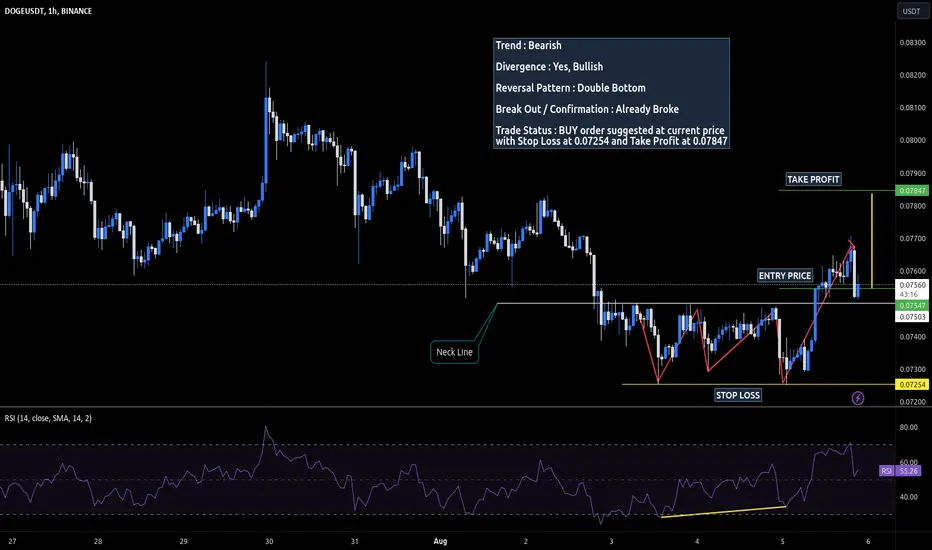
DOGEUSDT Technical Analysis Update📈 #DOGEUSDT Technical Analysis Update 📈
🐻 Trend: Bearish
🐮 Divergence: Bullish
⏳ Reversal Pattern: Double Bottom
🚀 Breakout Confirmed: YES
📊 Trade Idea:
📌 Buy Entry: Market order at current price
🛑 Stop Loss: 0.07254
🎯 Take Profit: 0.07847
#TechnicalAnalysis #Cryptocurrency #TradingOpportunity
📈 Trade with caution and do your own research.
💼 This is not financial advice, it's for educational purposes only.
🙏 Always use appropriate risk management and set stop losses.
💰 Invest only what you can afford to lose.
Happy trading! 🚀📊 #TradingView #CryptoTrading #InvestmentAdvice
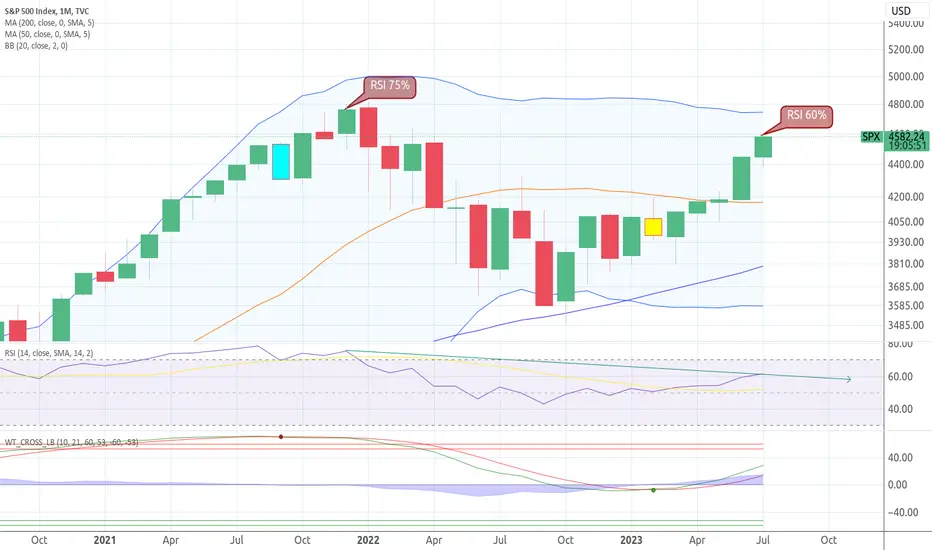
DivergentGet ready for a big dump. Loading bear shares on every gap up.
Capping 4600 at top of Bolly band... exhausted. Cup & Handle played out nicely.
Guns of August will be blazing imo.

Bearish Divergence Bearish Divergence on the monthly time frame indicating a big bearish morvment is about to happen.
RSI also showing market exhaustion where the bears are taking control
Stochastic showing the market is over bought.
and the candles on the chart is showing chop and wick to the top side.. indicating bulls loosing momentum and a reversal is imminent.

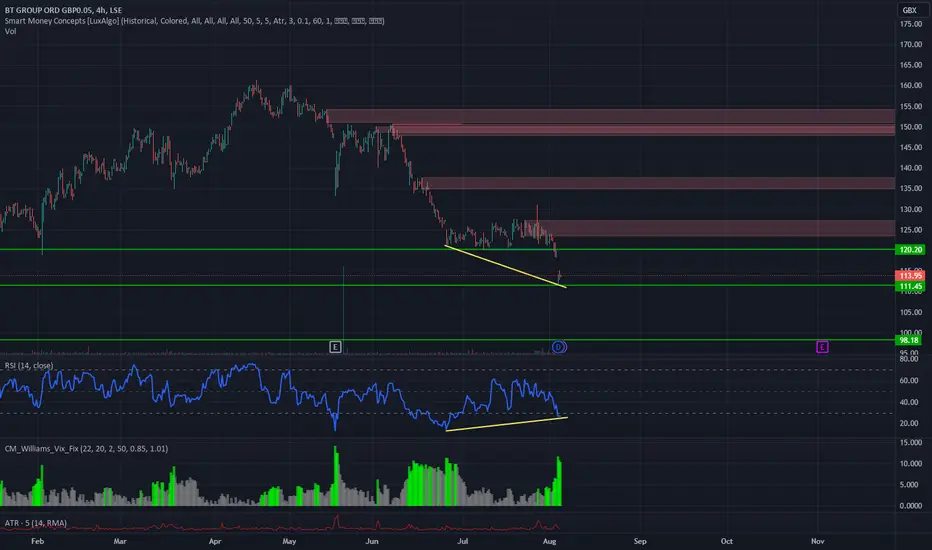
BT.A - BT GROUP PLC - LONGThis is an analysis of BT GROUP PLC - a British telecom company, the following is strictly my own personal opinion and does not constitute financial advice.
Key numbers:
Dividend yield TTM - 6.47%
P/B - 0.81
P/E - 5.56 (currently)
Market cap 11 817 MGBP (11.8BGBP)
Analyst estimates:
Analyst estimate average for BT.A is 188.5 GBX which is equivalent to a 65.42% increase from todays price.
Key information:
CEO has been replaced with Telias ex-CEO Alison Kirkby, she claims to have the same vision for the company as previous CEO Phillip Jansen. Telia stock has been following a similar trend as BT.A, and as news was released today both shares dropped. However, analysts believe BT.A is overweight, and the consensus among analysts is that BT.A is a buy/strong buy.
Technical analysis:
BT.A made a bullish divergence on recent support level at 120GBX 11th of July, likely due to uncertainty around the next CEO of the company, the stock consolidated until today. As news came out regarding the change of CEO, shares dropped in price, dropping down to previous support on 110-112GBX - still within the lines of a bullish divergence.
Strategy:
I am currently in possession of BT.A shares with a GAV of 123GBX which I am looking to hold. The lowest sell side analyst target is at 100GBX, and if price continues to drop to support at 95-100GBX and the divergence between relative strength and price continues, I will be looking to increase my position in the stock as long as no unforeseen news arise.
If the price holds above support on the 110GBX level I will not add to my position, and I will follow my original strategy to wait for price to get closer to AVG analyst estimate, or take profit around 160GBX at the stocks previous high. Taking profit at 160GBX will net roughly 34-35% gain when factoring in dividends paid out 13th of September.
Should price drop below the 95-100GBX support level, I will re-evaluate my position and look to liquidate the shares if there is any indication that the fundamental situation of the company has changed for the worse, or if the bullish divergence becomes invalid.
Falling Wedge for Reversal | $110Weekly Chart
PAYPAL NASDAQ:PYPL is in the Falling Wedge and can break in this month. Just follow it
We have good signals
- Divergence RSI
- Failling Wedge
So wait and see next move
GBPCAD → I believe a downward movement
hello guys...
if you check indicators like MACD or RSI you find out a divergence...
if you look wider and zoom out you see a three-drive pattern,
in my point of view, in this case, I assume an R:R 1:1 short position...
but for you, just wait until the price break out of the trendline and get a short position after retrace!
target 1: 1.6711
target 2: 1.66.06
target 3: 1.6414
target 4: 1.6315
_______________________________
always do your research.
If you have any questions, you can write them in the comments below, and I will answer them.
And please don't forget to support this idea with your likes and comment

Oil - DIVERGENCE - Short position as expectedAs I said on my previous idea (check the link below) the price was forming divergence, showing that the upward move was almost ending. Also there was a major resistance area between 82.00 and 83.50. A expected, the price reached the resistance level and immediately dropped.
By the time i write, the position is already ITM with RR 1.40.
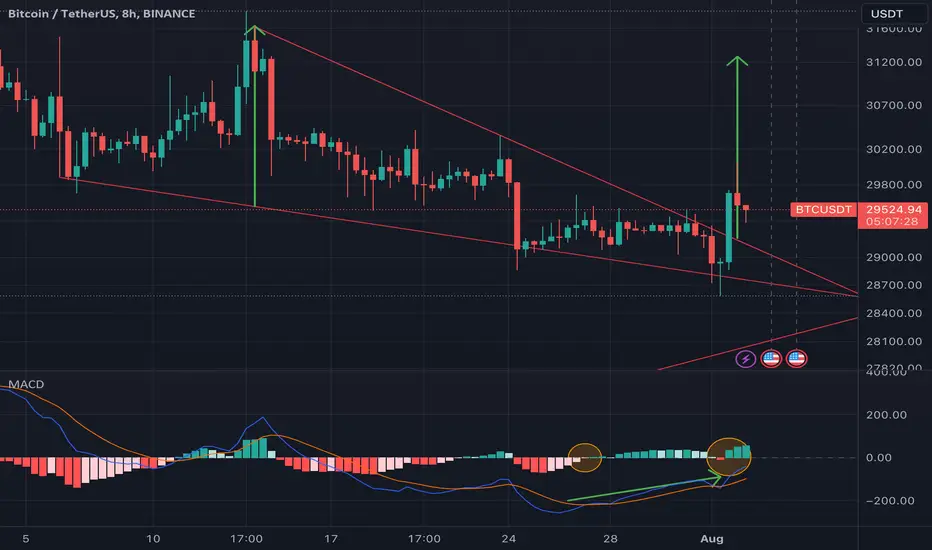
MACD Divergence: Enhancing BTCUSDT's Breakout PotentialBitcoin's (BTC) recent movement against USDT has captured attention as it breaks free from a falling wedge pattern. Despite modest volume, the breakout holds promise. Notably, a divergence in the MACD indicator on the 8-hour chart adds further intrigue, suggesting a potential bullish momentum shift. While these signs are positive, cautious analysis and market awareness remain crucial in navigating the dynamic cryptocurrency landscape.