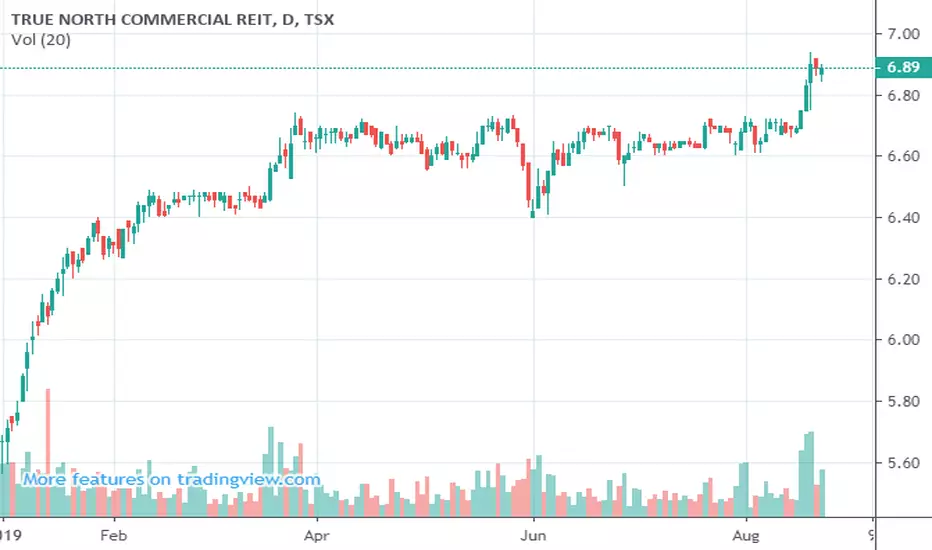
i'm thinking of parking some money herereal estate stocks are my favorite when it comes to real estate investing, no carrying cost and you can apply dollar cost averaging. And this has a monthly dividend also, perfection.
Dividend
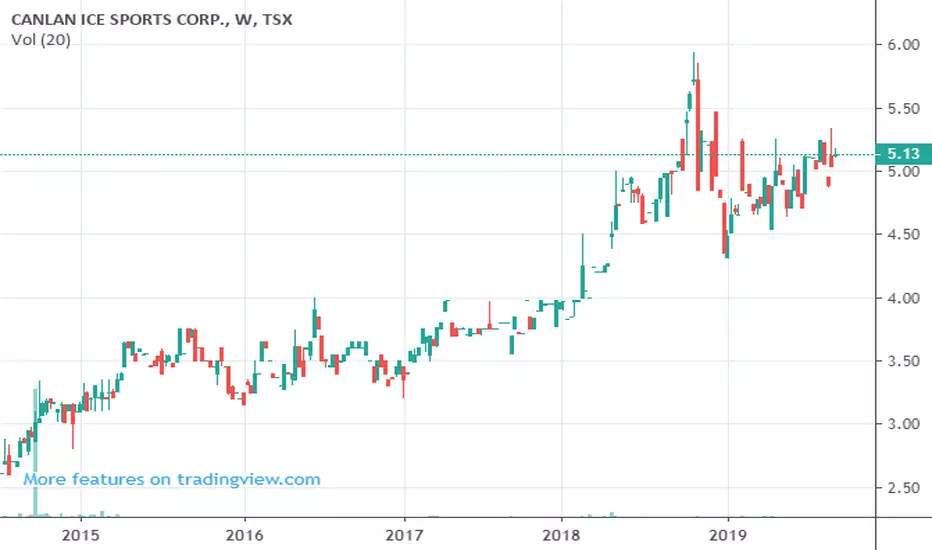
remember this gem from march 28, 2018my followers and subscribers got put onto this gem in 2018 at $4.20 and a dividend increase is coming in october. Now this is what you call an investment. sold my shares a while back at $5.20
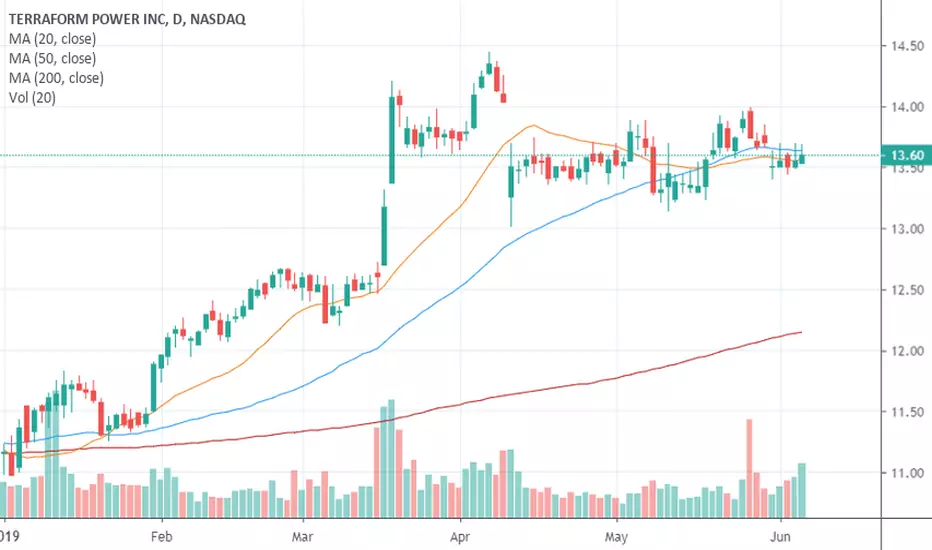
TERRAFORM POWER INC. - NASDAQ: $TERP FlaggingAfter breaking-out in early Spring (March), TerraForm Power Inc. NASDAQ: TERP has found itself digesting/consolidating in a Flag pattern as we can observe from the Daily chart above.
While the action has been fairly benign with-out much fanfare, TERP continues to display solid technical characteristics and remains in decent shape despite trading slightly below both its 20 and 50 DMA's, yet comfortably above its rising 200 DMA.
In addition, when one extends out to both the Weekly and Monthly duration, TERP finds itself in a healthy technical posture as well. Thus, we have a stock trading in a favorable technical posture across multiple time-frames, which bodes well.
Moving forward, 'When and If' TERP is capable of going top-side of the $14.25 and perhaps more importantly the $14.50 levels, such development, should it occur, would like trigger its next advance into greener pastures.
In the meantime, TERP yields nearly 6% via dividend and for those seeking a bit of income while waiting for its next move, you're being handsomely paid to wait.
Nonetheless, both investors/traders may want to continue to monitor the action closely for a potential break into higher ground.
ALTY DIP BUY OPPPORTUNITYI would wait for confirmation of retun to the upside and enter a position. Good long term hold since they give a good dividends payout.

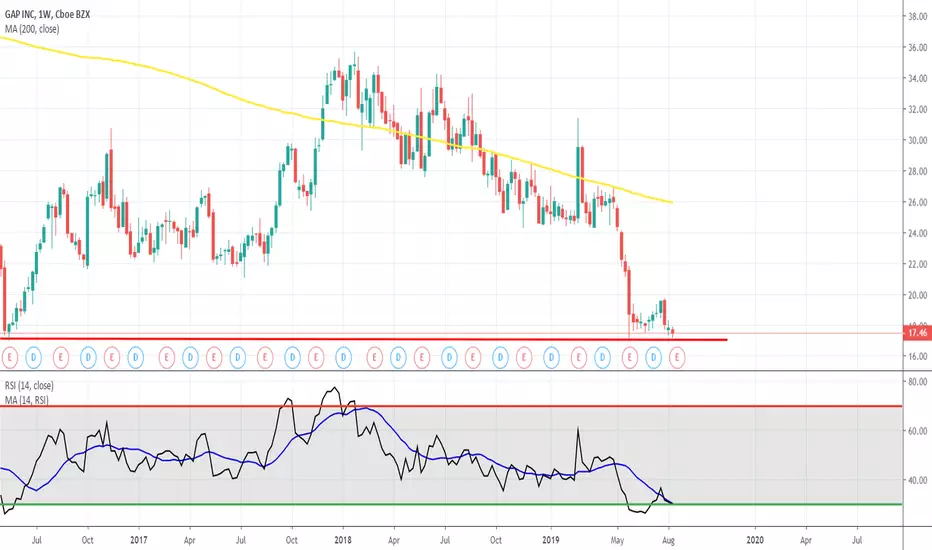
GPS bottomGPS is at 3y low and just an 80c near 8y low, with an average price target at $20.50 price range. Don't forget for their dividend which is 5.56%!!!

EDUCATION: EMULATING YIELD VIA SHORT PUTOver time, my basic approach to my IRA has been to acquire shares at substantial discounts over time and to take advantage of "the three legs": (1) short call premium; (2) dividends; and (3) growth, with the eventual goal to be able to solely or predominantly rely on dividends post-retirement, since "growth" can periodically be elusive and short call premium collection on covered calls can vary widely, depending on movement of the underlying, implied volatility, and one's degree of "aggression."*
Typically, this has involved selling puts as an "acquire lower" strategy, followed by share assignment, and then covering. However, as we all know, getting into stock at a particular price results in a less than agile setup. After all -- and regardless of whether you buy stocks outright or are assigned them -- once you're in stock, you're in at the price you bought or were assigned, and there's no amount of magic wand waving that will change the price at which you acquired, even if you shed tears and get buyer's remorse later.
In comparison, staying in options as long as possible affords you greater flexibility as to potential acquisition price since you can roll for credit and therefore cost basis reduction before your getting full on into the shares. Relatedly, you can essentially "manipulate" the potential share price at which you're assigned by rolling the short puts down and out if you become unhappy with the strike at which you sold originally.
All that having been said, what if I want to emulate dividend yield in the shares while I wait to get assigned at a discount? Well, there's a way to do that -- with short puts.
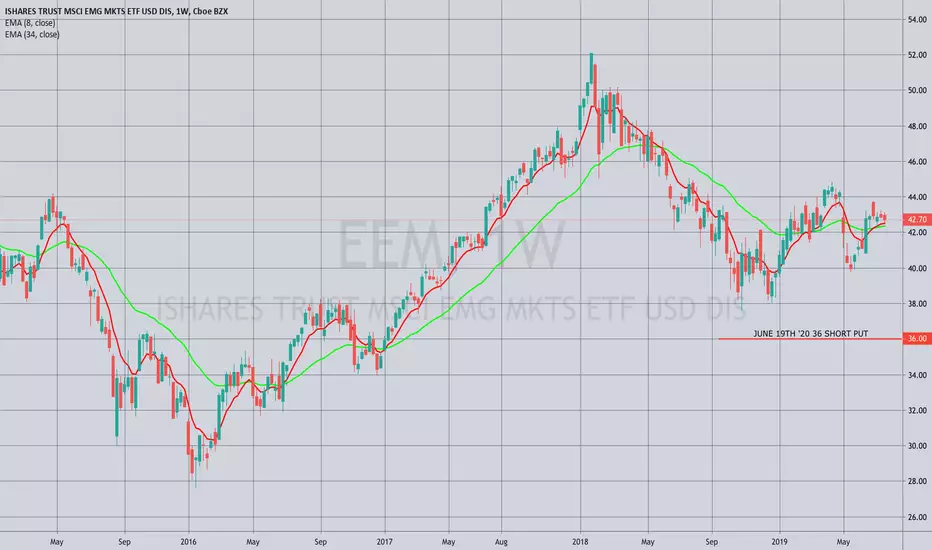
Pictured here is an EEM June 19th '20 36 short put, paying .97 at the mid, with delta/theta metrics of 18/.36. 328 days out in time, it's the expiry nearest 365 days 'til expiry, and the delta'd strike (~18) that will pay something approximating the annualized dividend of $90.** In other words, this isn't the actual trade you'd put on to emulate dividend yield (although absolutely nothing prevents you from doing that), but rather a guide to tell you what delta and/or theta you'd need to sell in shorter duration to emulate the amount of annualized dividend.
In this particular case, selling the September 20th 40 short put*** would potentially fit that bill. Paying a .30 credit, it has delta/theta metrics of 17.29/.69 with a theta burn nearly twice that of the longer-dated 36, with the downside being that the strike is obviously much closer to current price than the 18 delta sold out in time. However, the theta metric makes it conceivable that you could collect what amounts to the annual premium of .90 in three to four expiry cycles as compared to 12, assuming that the underlying goes sideways, up, or even down to a certain degree during your credit collection/divvy generation emulation process.
Post fill, look to roll at extrinsic approaching worthless from the ~18 delta to an ~18 delta strike in an expiry that will pay a credit, aiming to collect at least .25 with any given roll. If you're not able to get at least .25 on a roll to a similarly delta'd strike without going out an absurd amount of time, consider rolling down and out more incrementally.
Naturally, this begs the question of whether and under what circumstances it's worth being in stock versus short puts since you can emulate not only dividends, but also growth with short puts ... . But I'll leave that discussion for another day.
* -- By "aggression," I mean what delta you're willing to sell as cover (i.e., 20 versus 30 versus 40 versus at-the-monied or even monied).
** -- The annual yield in EEM isn't great -- 2.08%, so I'm primarily using it as an example due to its excellent liquidity and market tightness in the off hours.
*** -- Naturally, this is best done on weakness or in a higher implied volatility environment. EEM's at 7/16 here, so you're consequently not getting a ton of juice out of the 18 delta.
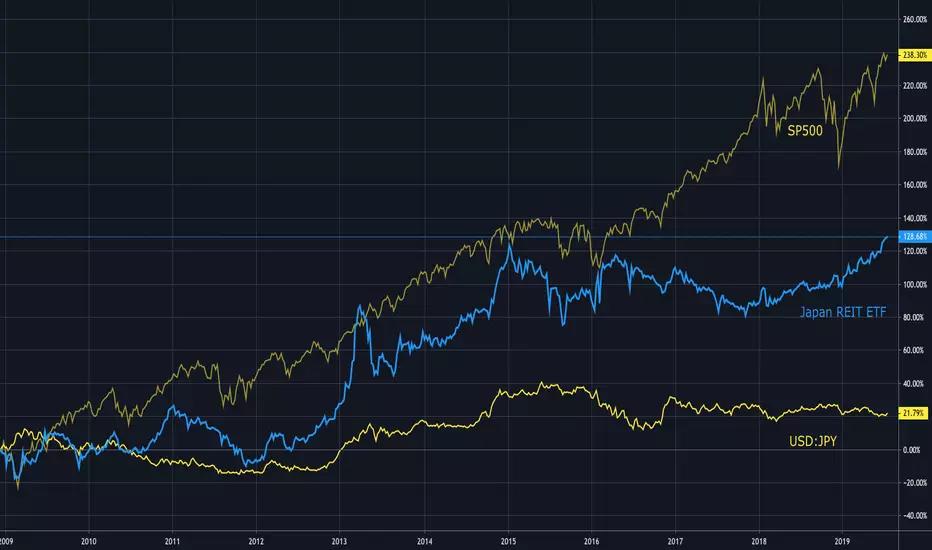
Japan REITs: Hidden Gem to Diversify Your PortfolioJapan has long lost its charm to the international trading community. It has been a boring place to trade in for the past two decades, pretty much. In a mature market like Japan, you can't expect explosive growth like you can find in China.
However, this market offers a great source of diversification and income potential, if you know where you are looking.
The answer lies in Japan REITs. Properties in Japan, be it commercial, industrial, retail, hospitality, or residential, are coveted by mom-and-pop as well as institutional investors from the country and across the APAC region for their stable and (slowly) growing rental income.
The chart shows the largest REIT ETF listed in Japan (blue line) versus JPY and SP500 trendlines. You can clearly see the low correlation between JREIT and SPX.
In times of volatility in the US, and for those with international brokerage capabilities, why not consider this diversifier across the Ocean?
Disclaimers:
GMAS is long a few select names within the captioned ETF.
Investment carries risk.
Investment in foreign dividend stocks is subject to withholding tax. You may be able to claim better withholding tax rate based on your country's double taxation treaty status.
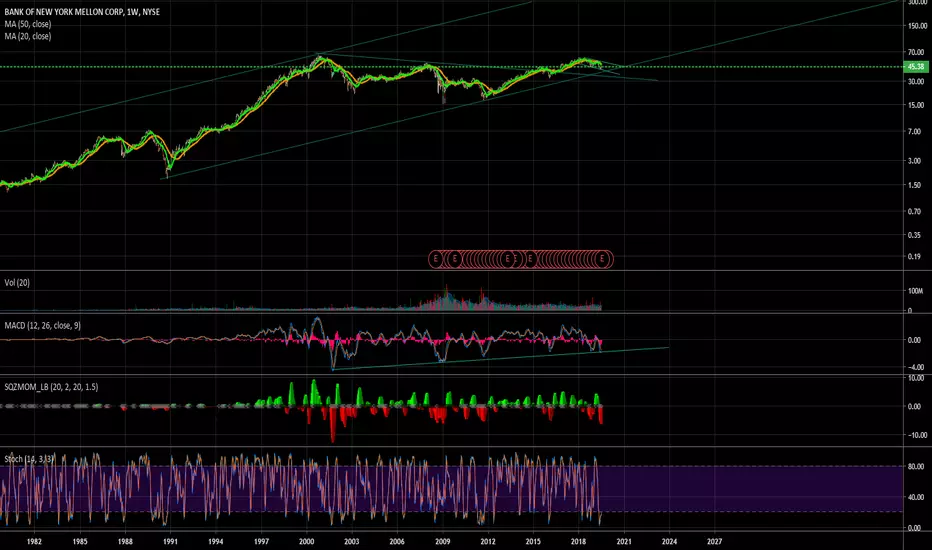
Buying OpportunityUndervalued by 38% using Div Yield Theory, 25% <5 yr PE
-BRK's most undervalued bank holding
-Nearing 30 year demand uptrend line
- 8 years consecutive dividend increases
Buying on SupportUndervalued using Divi Yield Theory by 38%. Currently 5 Star stock from M*.
Buying on support for a long lasting dividend stock, it is not a high dividend bu it has increased for 19 consecutive years and 6.42% growth rate last 5.
Still in downtrend but has already bounced off demand line once. Perfect time to start accumulation.
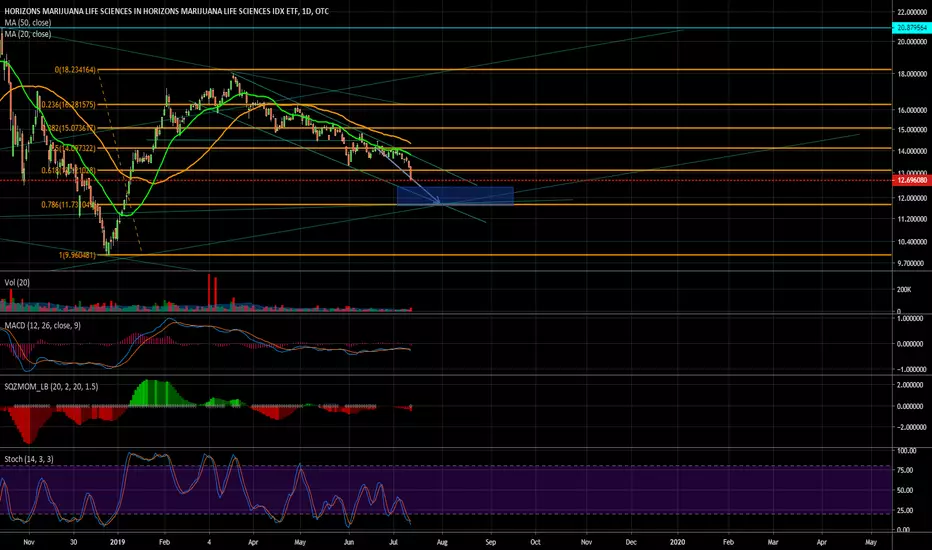
Buying opportunityHMLSF has been in intermediate downtrend since Oct 2018 and is nearing very strong support zone. This Marijuana ETF boasts a 4.6% div yield w/ $800M AUM.
This might just be one of your best bets for playing the industry "Safely" if you're looking for exposure to the industry.
Symmetrical Triangleexpect ≈5% pullback prior to breaking out in either direction; while pattern has been confirmed as symmetrical triangle, it shouldn't breakout at this point. If it does; wait for vol confirmation.
Fat divi, but PE is ≈2x Historical which means it may be overpriced.
If fed does not lower interest rates next Qtr don't be surprised to see REITs pullback.

Mastering the dividend cycleECA Marcellus Trust is an example of an extremely high-dividend stock. Because of its high dividend that comes every three months, the stock moves in predictable cycles. The stock gets bought by dividend miners during the lead-up to a dividend, and then it sells off afterward.
There are about 61 trading days between ex-dividends. The low typically comes sometime between day 21 and day 41 after the ex-dividend date, and the high comes on day 60.
This cycle offers an excellent opportunity to make a fairly predictable profit. Even this last, relatively small upswing was worth nearly 35% if you bought at the halfway point between dividend dates and sold the day before ex-dividend.
It's usually a good idea not to actually take the dividend, because the stock will lose more share price overnight than the dividend is worth. (To take the dividend, you have to own the stock at the start of pre-market trading on the ex-dividend date.)
It's worth pointing out that ECA Marcellus Trust is a risky stock. Its dividend distributions vary depending on the price of natural gas and the output of the wells. The output of the wells declines about 8% per year, and the Trust itself expires in July 2021, at which point the stock becomes worthless. So you can expect the swings to get smaller over time, and the stock's average share price to decline at an accelerating rate.
Still, there's an opportunity here for a well-timed play, and its predictability makes it pretty attractive.

More upside for Rio Tinto pre-earnings?Recognia is flashing am Elliott Wave 3 extension for Rio Tinto, with a price target of $73.86. I'm skeptical that we'll get that high, because it's outside the current trend channel, which I expect to break after RIO reports earnings on August 1. However, I do think it's likely that there's upside ahead as we approach the half-year earnings date. RIO has a low P/E for the industry and a high rating from all the analysts. In addition to the upcoming earnings date, RIO goes ex-dividend August 8. With a 6.33% dividend, the approaching dividend is a significant upside catalyst for the stock.
However, there's risk of a trend channel breach on June 16, when RIO publishes its quarterly operations review. Last year, RIO broke downward out of its trend channel on June 15, for reasons I don't fully understand.

$TWO - REIT getting slammed with Rate Hikes / Bearish Bearish below $15
Looking to short it if it breaks support zone.
Good Dividends but unsure if it's worth buying at support level.
Swing Idea:
1. Short below $15 / Cover over $15.50
OR
2. Buy at support level and write a cover call when it gets to resistance level
I think it will fall more as the fed rate hikes will impact all the REIT.
I will monitor next week to see watch the daily chart. Only issue I have with TWO is they had a reverse split and have not been doing well. If it continues to fall in price, I think another reverse split will happen. Which is why I am bearish.
If you're an expert with REITS - please comment and advise with your thoughts on it. Thanks!

Time to buy BMW? Day before ex-dividend dateBMW entered a bullish trend back in 13 May 2016, when it paid the dividend of 2016. Yesterday was at minimums of 2013 if we do not take into account Brexit effect on 2016. Today is the day before the ex-dividend date of 2019 and it offers a dividend yield of 5.12%. Nonetheless, it's worth reminding that BMW's 2018 Earnings where -16.9% YoY so in case you happen to buy shares today, do not hold them for long. A positive point for the auto sector is that Trump will delay tariffs on autos 6 months from now. Therefore, we might expierence some volatility with BMW stock and it could have a trend reversal right from today up to levels of 74-75€. So the final conclusion would be: Buy today, seize the dividend this month and sell in 5-6 months time depending on market news.

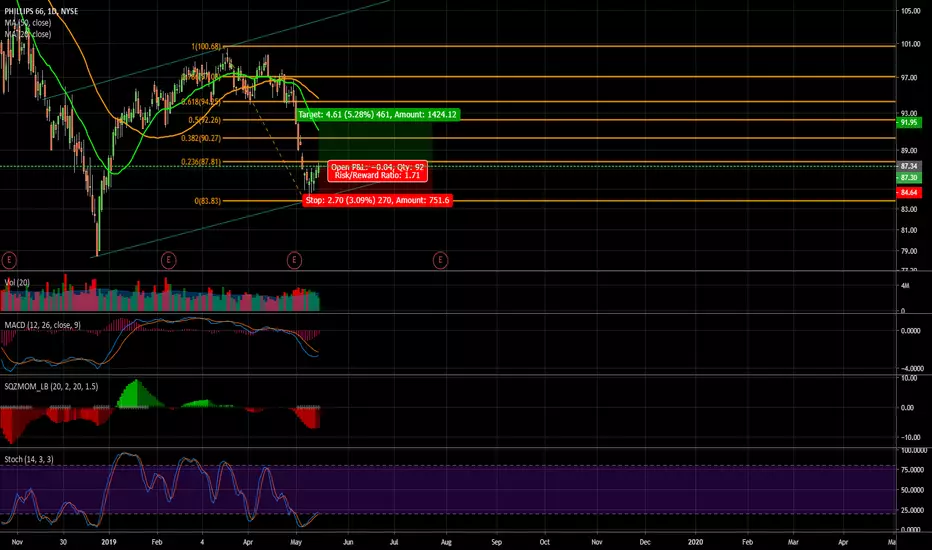
hammer dailyGoes Ex-div on 17th, w/ .9 divi
Good probability of hitting 50-61.8% retrace off of daily hammer on support. Target profit of 6.37-7.5% w/in 2 weeks.
Just raised divi from .8 to .9
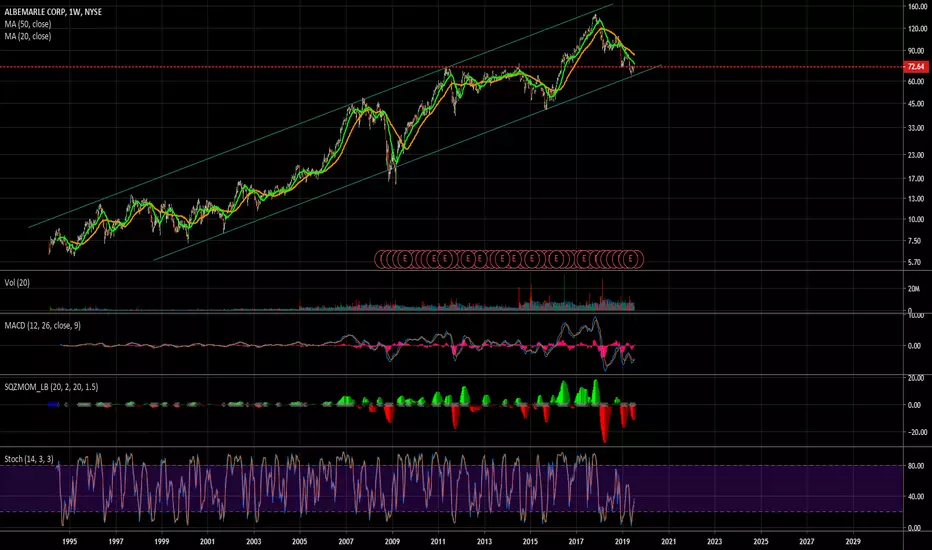
K Dividend Medium hold.Kellogg confirmed bounce off 17 year trend line.
Low beta Dividend KING with 56 years of YoY increases or level dividends.
Currently at a great entry for medium(Late 2019) and long term(5+year) holds.
Targets :
Medium $66
Long $90
At current levels a 15 year hold would be at approximately $38 cost basis using uncompounded dividends.
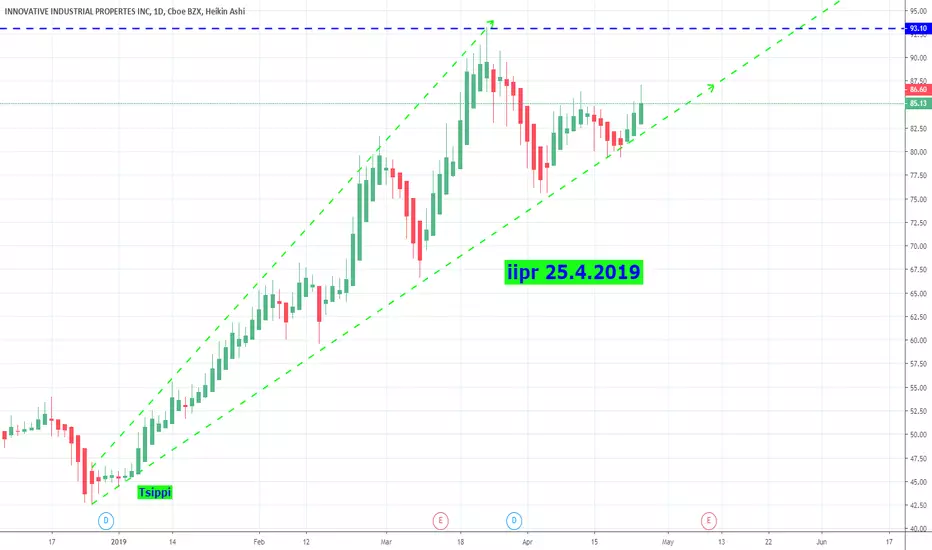
Innovative Industrial Properties Inc $IIPROne of my favourite related cannabis company ,focused on the acquisition, ownership and management of specialised industrial properties leased to experienced, state-licensed operators for their regulated medical-use cannabis facilities in the us. 2% div.
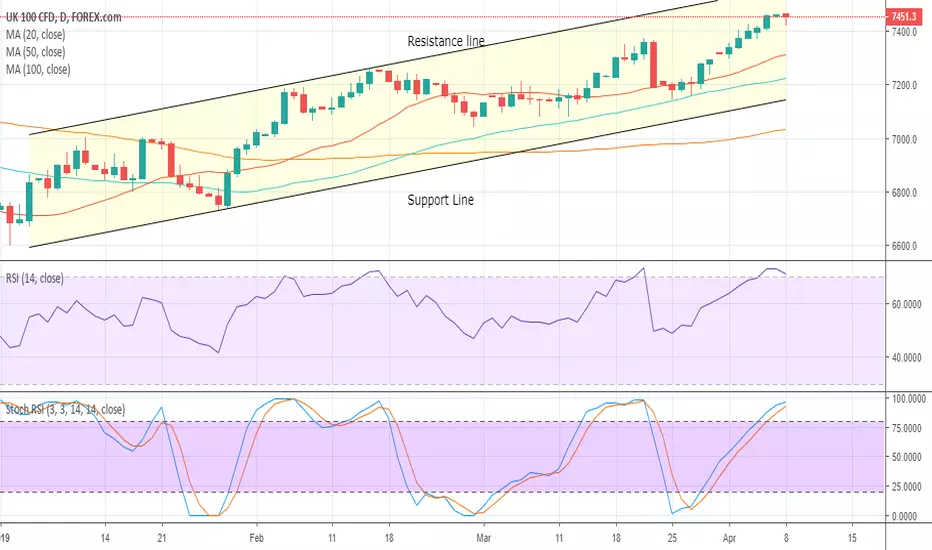
FTSE 100 Long Term Long, Dividend Yield > Financing The FTSE 100 is in a "bullish price channel" as it has a positive slope with the upper trend line marking resistance and lower trend line marking support.
We are long the FTSE 100 and the dividend yield for 2019 should be close to 5% which provides positive income for holding the position even through a leveraged product that incurs financing charges (ie: a CFD or spreadbet).
The financing for a leveraged FTSE 100 position is calculated as (Benchmark+spread)*daycount*market value Eg: (0.8185%+2.5%)*(1/365)*7450= 68p per day financing charge on a position of notional value GBP 7,450. This is using the benchmark rate at of GBP 3 month libor of 0.81850% as at the 05.04.19 and a spread of 2.5%.
Therefore holding the position could currently yield around 1.7% (5% dividend yield – 3.3% benchmark + spread). This is evidently not much but useful in building a long term long position and it is important to understand how financing is calculated as well as how it can impact returns.
Additionally, a further potential drop in GBPUSD due to the uncertainty surrounding Brexit could see further upside for the index. This is because such a large proportion of profits for FTSE 100 companies is made in dollars. If sterling weakens then dollar revenues, once converted back into sterling, are worth more.
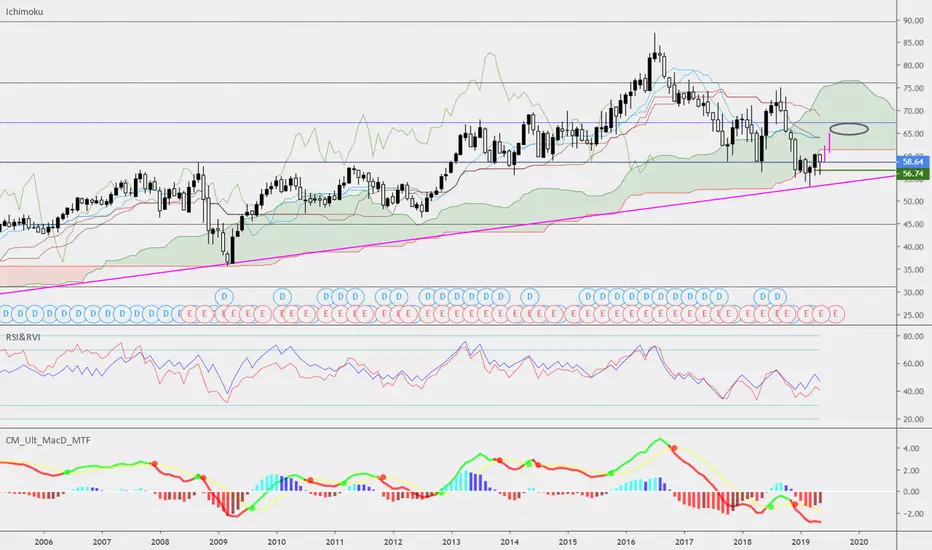
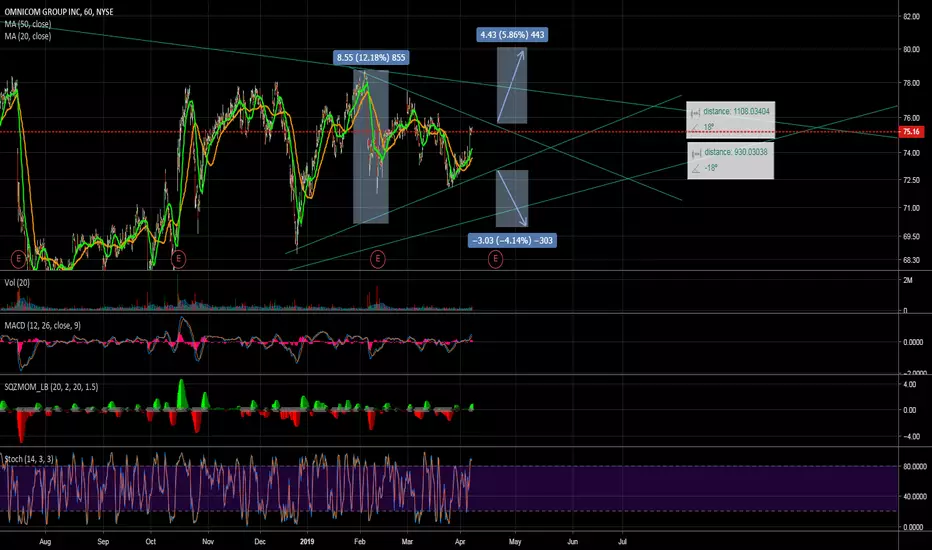
OMC Symmetrical TriangleNeutral pattern until decisive close outside pattern. SP is near bottom upward monthly trendline. May be a good buying opportunity for a decent long term dividend paying stock with divi growth of 9 years.
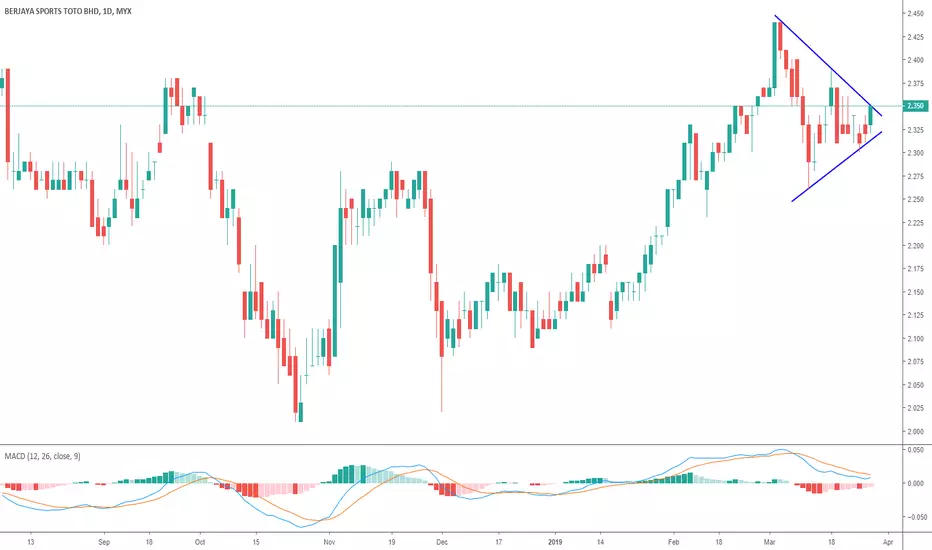
Potential Bullish Flag, BJTOTOPotential bullish flag pattern spotted in daily chart of BJTOTO,
a break above 2.35 present a buying opportunities for capital gains and dividends.
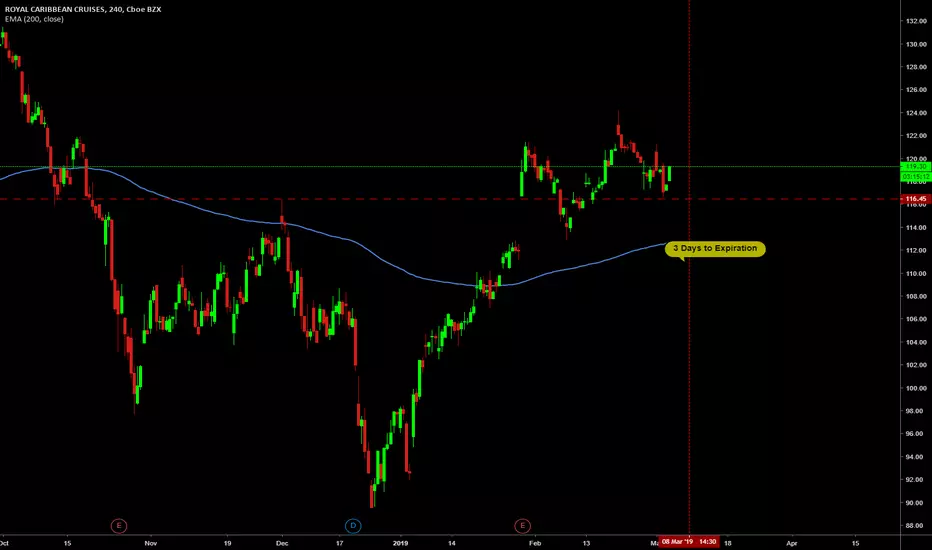
Covered Strangle for Dividend Capture Enhancement (75% prob)Bought 100 RCL for 118.25
Ex-Dividend is tomorrow and dividend is .70, so If I have the stock by tomorrow I will receive the dividend.
To enhance the trade I also Sold the 115/119 Strangle for an additional $1.1 with 3 days to expiration (That's how long I will be in this trade)
Max win would be $185 for the covered strangle plus $70 for the dividend = $255
My break even counting the dividend is 116.45
So I have 1.5% protection to the downside.
This gives us about 75% probability to make money