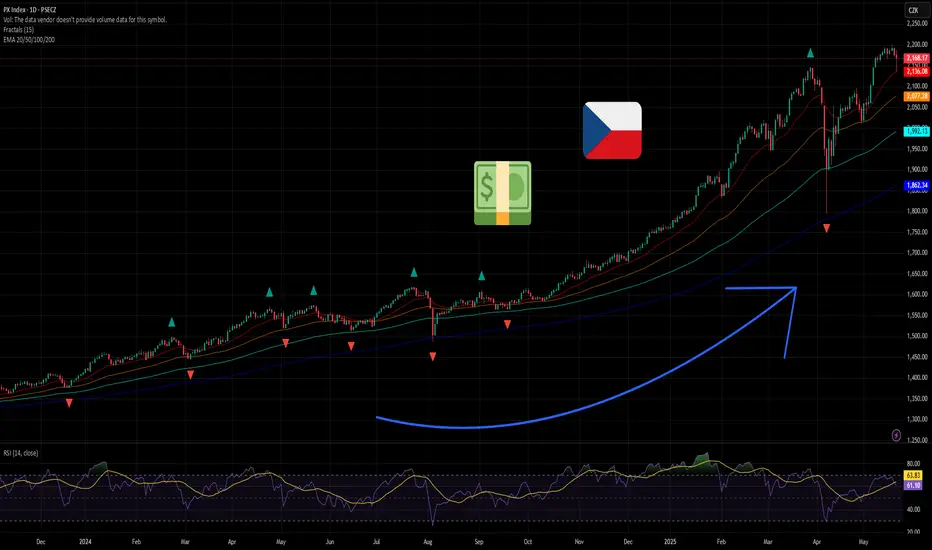
Czech Republic: A Dividend HeavenThe Prague Stock Exchange (PSE) PSECZ:PX is characterized by a concentration of mature, dividend-paying companies, particularly in sectors such as energy, banking, and heavy industry. Unlike growth-focused exchanges in the U.S. or Asia, the Czech market offers relatively few stocks with high reinvestment or expansion trajectories.
Preference for Payouts
Over the past two decades, Czech listed companies have consistently distributed a significant share of profits as dividends. This reflects both limited reinvestment opportunities in a relatively saturated domestic market and a shareholder preference for cash returns. For example, CEZ and Komercni banka have maintained payout ratios above 70% in most years.
Structural Support & Tax environment
The Czech Republic provides a structurally supportive environment for dividend-oriented investors. One key advantage is the tax framework. Czech residents are exempt from capital gains tax if they hold an investment for more than three years. This strongly favors long-term investing.
For non-residents, a 15% withholding tax on dividends applies—unless the investor resides in a country outside the EU/EEA that does not have a tax treaty or tax information exchange agreement with the Czech Republic.
Key Dividend-Paying Companies
CEZ (CEZ) PSECZ:CEZ
Industry: Energy (Electricity generation and distribution)
Dividend History (Gross per Share) / Dividend Yield (%)
2020: CZK 34 10.1%
2021: CZK 52 5.8%
2022: CZK 48 18.83%
2023: CZK 145 5.43%
2024: CZK 52 5.9%
Dividend Growth:
2020 to 2021: +52.9%
2021 to 2022: -7.7%
2022 to 2023: +202%
2023 to 2024: -64.1%
Komercni banka (KOMB) PSECZ:KOMB
Industry: Banking and financial services
Dividend History (Gross per Share) / Dividend Yield (%)
2020: CZK 23.9 3.63%
2021: CZK 99.3 10.62%
2022: CZK 60.42 9.22%
2023: CZK 82.7 11.41%
2024: CZK 91.3 10.76%
Dividend Growth:
2020 to 2021: +315.6%
2021 to 2022: -39.2%
2022 to 2023: +36.9%
2023 to 2024: +10.4%
Moneta Money Bank (MONET) PSECZ:MONET
Industry: Banking and financial services
Dividend History (Gross per Share) / Dividend Yield (%)
2020: CZK 0 (dividend suspended)
2021: CZK 3 10.67%
2022: CZK 7 10.53%
2023: CZK 8 12.82%
2024: CZK 9 8.08%
Dividend Growth:
2020 to 2021: N/A
2021 to 2022: +133.3%
2022 to 2023: +14.3%
2023 to 2024: +12.5%
Dividendyield
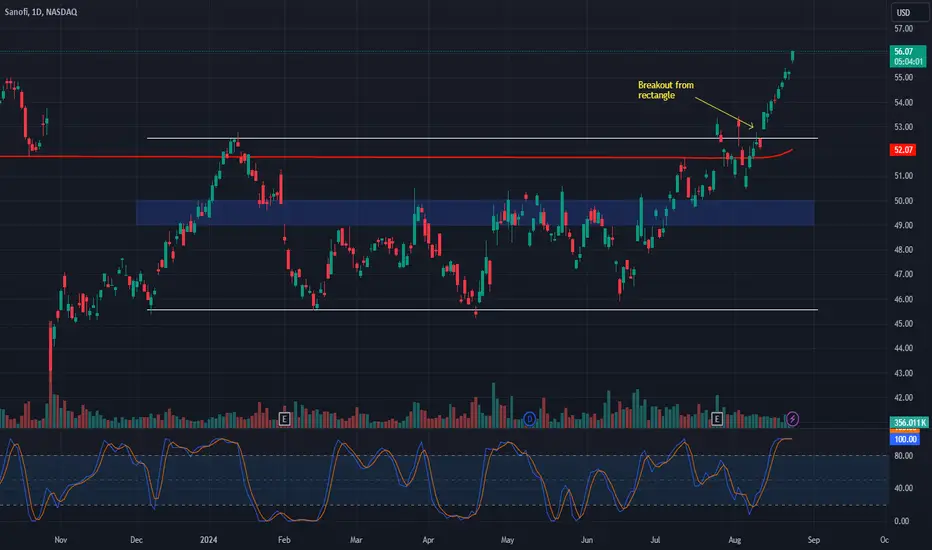
Sanofi (SNY): A Strong Investment CaseCompany Overview:
Sanofi NASDAQ:SNY is a major pharmaceutical company based in Paris, with a market capitalization of $134 billion.
Investment Highlights:
Dividend Yield: 3.8%, more than double the S&P 500 average.
Drug Portfolio: Diverse and includes successful drug developments.
Pipeline: Promising future drug pipeline with potential for growth.
Berkshire Hathaway Investment: Long-standing investment from Berkshire Hathaway underscores the company’s attractiveness and stability.
Outlook:
We are bullish on SNY due to its growth potential and solid dividend payout. The combination of a strong drug portfolio, promising pipeline, and robust dividend makes Sanofi a compelling investment choice.
#Sanofi #SNY #Pharmaceuticals #Investment #DividendYield #MarketCap #GrowthPotential #BerkshireHathaway #StockAnalysis #Bullish
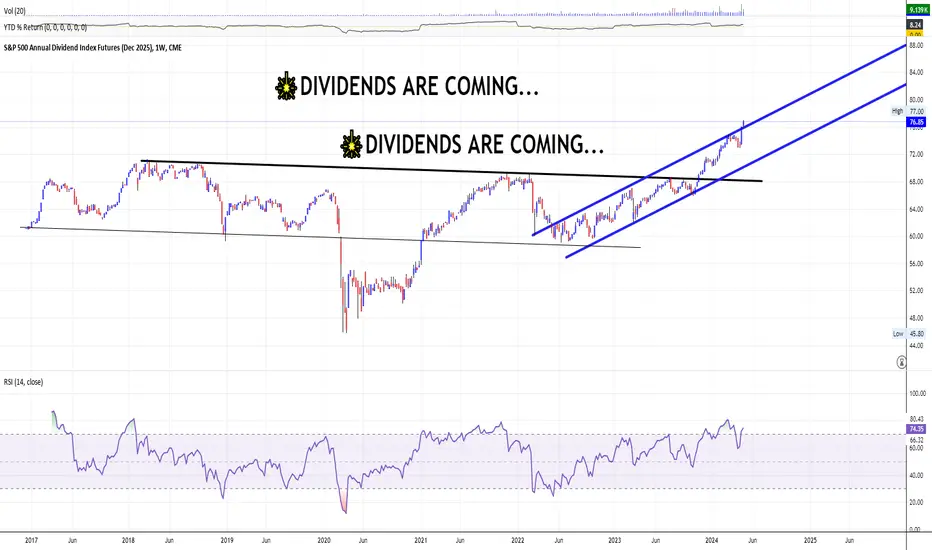
Dividends Are Coming. S&P500 Annual Dividend Index FuturesA few months ago I started this research, research of Equity Index Dividend futures, provided by CME Group.
Well, sounds good. Let's continue..
Were you ready or not, but in February, 2024 Meta platforms (META) announced its first-ever in history cash dividend of $0.50 per share to be paid out on quarterly basis.
“We intend to pay a cash dividend on a quarterly basis going forward,” the company said in a release .
Meta stock surged for 20% after that amid other huge reasons.
Alphabet (GOOG) also issued first-ever dividend of 20 cents per share in April, 2024.
The news, announced alongside first-quarter earnings, helped to send the Google parent’s shares up 15%.
Dividend Market as well as Dividend futures trading shines bright.
Understanding Dividends and Dividend Market Futures
👉 A dividend is the distribution of corporate earnings to eligible shareholders.
👉 Dividend payments and amounts are determined by a company's board of directors. Dividends must be approved by the shareholders by voting rights. Although cash dividends are common, dividends can also be issued as shares of stock.
👉 The dividend yield is the dividend per share, and expressed as a percentage of a company's share price.
👉 Many companies - constituents of S&P500 Index still DO NOT PAY dividends and instead retain earnings to be invested back into the company.
👉 The S&P500 Dividend Points Index (Annual) tracks the total dividends from the constituents of the S&P 500 Index. The index provides investors the opportunity to hedge or take a view on dividends for U.S. stocks, independent of price movement, as S&P500 Dividend Index Futures is a market expectation of how many points Dividends Index will collect by the end of year.
👉 Using the S&P500 Dividend Index as the underlying in financial products, investors can hedge or gain exposure to the dividend performance of the S&P500 Index.
Understanding S&P500 Annual Dividend Index Futures
👉 The S&P500 Annual Dividend Index futures (main technical graph is for 2025 S&P500 Annual Dividend Index Futures) calculates the accumulation of all ordinary gross dividends paid on the S&P500 index constituent stocks that have gone ex-dividend over a 12-month period. The amounts are expressed as dividend index points.
👉 The underlying index for S&P500 Annual Dividend Index futures is the S&P500 Dividend Index. The methodology for the index can be found here at S&P Global website.
👉 Dividend index points specifically refer to the level of index points that are directly attributable to the dividends of index constituents. They typically only capture regular dividends and calculate this on the ex-date of the respective constituents within each index.
👉 In general, “special” or “extraordinary” dividends are not included as dividend points in the respective annual dividend indices.
👉 Futures contract Unit is $ 250 x S&P 500 Annual Dividends Index.
Technical considerations
🤝 Main technical graph (S&P500 Annual Dividend Index Futures 2025) indicates on strong bullish bias. Who knows, maybe at one sunny day even Tesla King, Elon Musk will unleash his E-pocket 😂
🤝 Happy Dividend Market Trading to Everyone! Enjoy!
How I go about Dividends as a Trader!Q. “In your view how do you go about with dividends as a trader and as an investor? Do you buy to chase dividends when they are declared or not?
A. As a position trader (short term holder), I'm not really interested in buying companies for the dividends released.
That’s because I prefer to make money in the short term with the trades I take, according to my short term strategy and analysis.
But if I did have an investor mentality and I wanted to take advantage of buying companies for dividends, I would do a number of things.
These include:
First I would do my own thorough research and due diligence on the company's overall financial health and performance.
Second, I would look at the dividend history of each company to see more or less what I would have earned over the last couple of years.
Also, if you look at the history of the dividend, it will help you determine whether it's a reliable company to buy.
I personally don't believe it's a good idea to chase dividends with stocks.
I have also never met anyone that makes money chasing dividends in the short term.
The problem is when the dividend is released, the share price tends to drop quite significantly.
And you could end up losing more money because of the share price drop, rather than the money you gain through the dividends.
This means, you could be stuck holding onto the shares and positions for the next couple of weeks or even months, waiting for the price to recover.
Reply: *Hey Timon, thanks for comprehensive respond. It cleared my confusion as a trader when it comes to dividends.


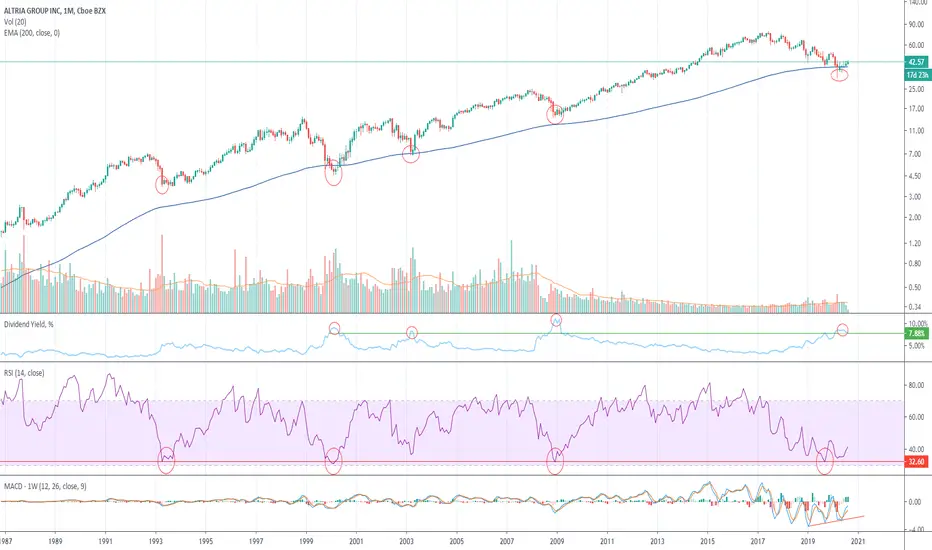
If you didn't know which company this was, would you buy?Would you buy purely on the technicals not knowing what stock this is? It's tempting!
Looking at a long-term monthly chart over a 30+ year time frame you can see each time RSI reached the 32.6 level this stock has bottomed. The large time frame over which this has been observed strengthens my confidence that this could be yet another bottoming for this stock.
The last four instances dividend yield has peaked above the current 7.88% annual dividend yield, this has also corresponded with a major bottom for this stock.
On a weekly frequency, the MACD MAs have been establishing a series of higher lows further confirming a long-term bottom is forming.
Lastly, the 200 Monthly EMA has been a strong support line over this 30+ year time frame. It looks as if the 200 EMA has held once again and price is now working it's way up of this support area.
From a purely technical perspective, I would buy this stock. Even if this stocks hovers sideways along its 200 Monthly EMA there is a nearly 8% dividend to collect.
With all that said, I do think this is a controversial stock but I think there's a compelling fundamental story too. Gross margin % and operating margin % have been steadily increasing over this long time period. There are also new frontiers (such as cannabis $CRON) which have the potential to be profitable investments in the long-run. However, Juul is an example that hasn't worked out well and resulted in losses for the company. The company currently trades at 9.41 full-year forecasted earnings and price-to-sales ratio of 3.85.
I still think this is an opportune time to get in at cheap valuations supported by technicals meanwhile collecting a large and sustainable dividend.