DJI Dow Jones Next Possible MovePair : DOW JONES ( US30 - DJI )
Description :
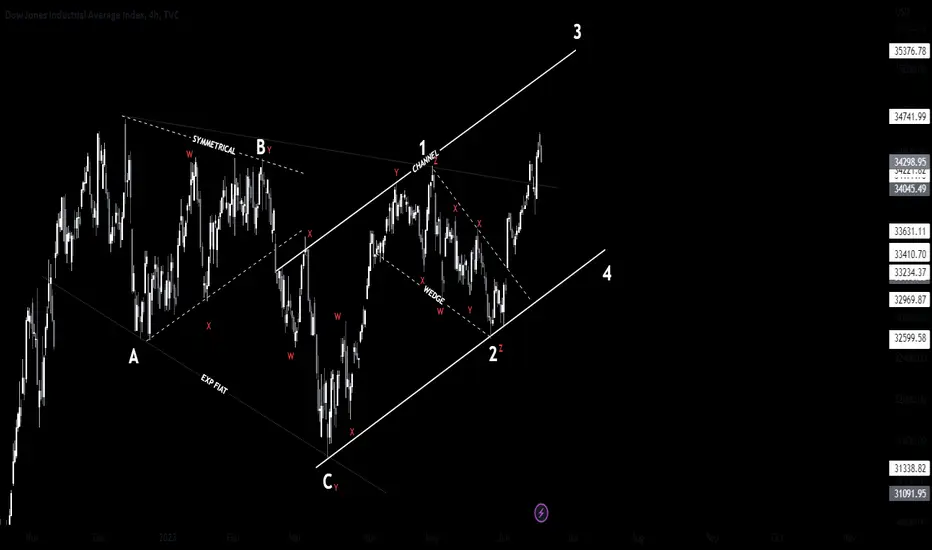
Bullish Channel as an Corrective Pattern in Short Time Frame
Divergence
Exp FIAT
Break of Structure
Falling Wedge in STF with the Breakout of UTL
Completed " ABC " Corrective Wave and " 12 " Impulsive Wave
Dji30
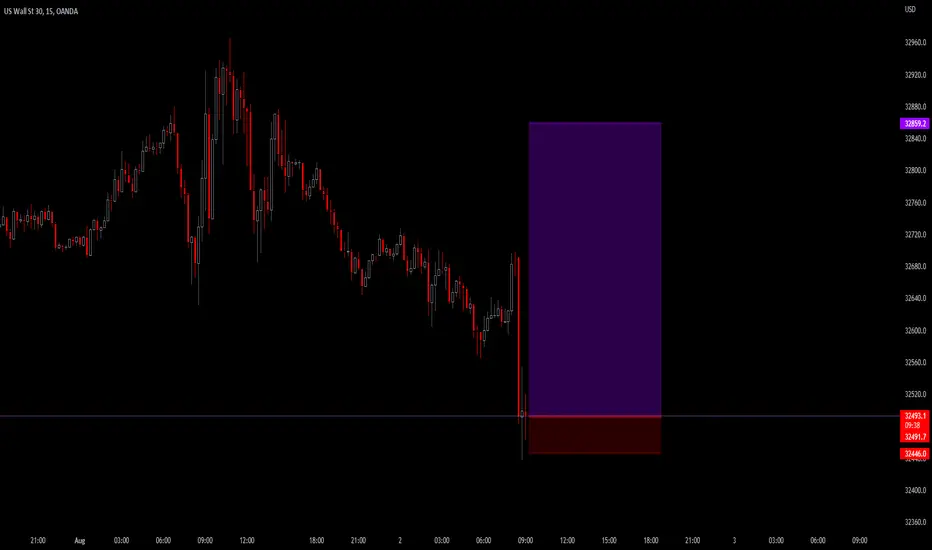
DJI target is getting delivered!Getting close to the perfect touchdown target!
#NDX and #SPX have been in consolidation mode since Mar 31st.
No need to be always in trade; cash is a position too!

Dow Jones Harmonic pattern - DJ30 Potential Bearish Bat CFDHi there,
Short note from me - This week could be crucial for the next quarter especcialy we have 3 decisions about interest rates: FED, ECB and BOE. But today i want to show you potential bearish bat harmonic pattern what I found on DJI30, which means we are going to test some lower price levels.
My scenario for FED on wednesday:
- rise interest rate by 50 bps - we all going down,
- 25 bps, but- market going down until wednesday: we are going up in short term,
- 25 bps, but- market going up: short, sell the news,
- 0 bps (unlikely), going up,
Outside this I'm still more bearish in particular that the downside formation was formed.

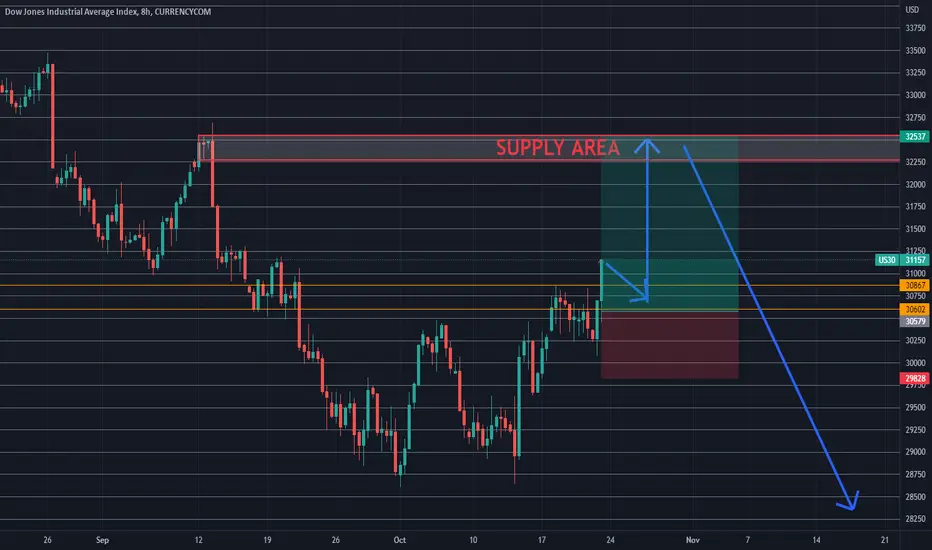
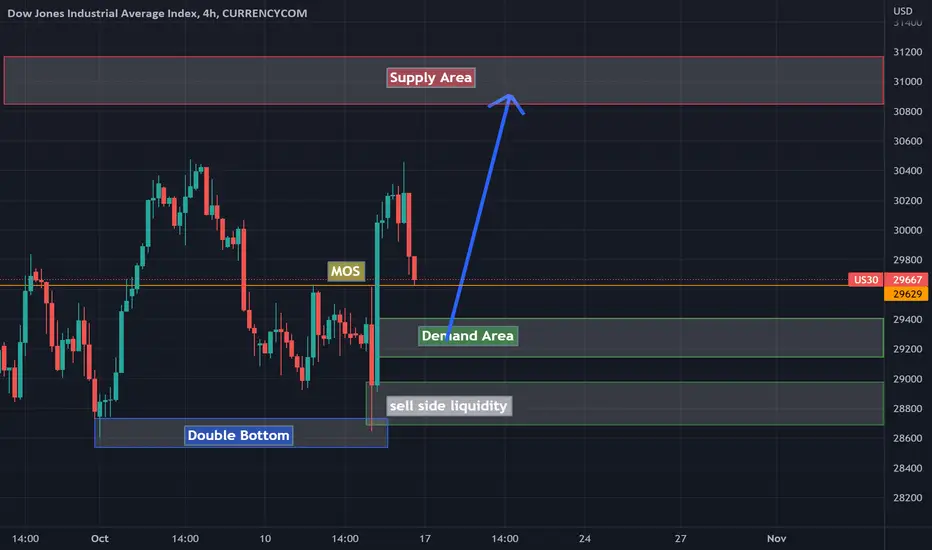
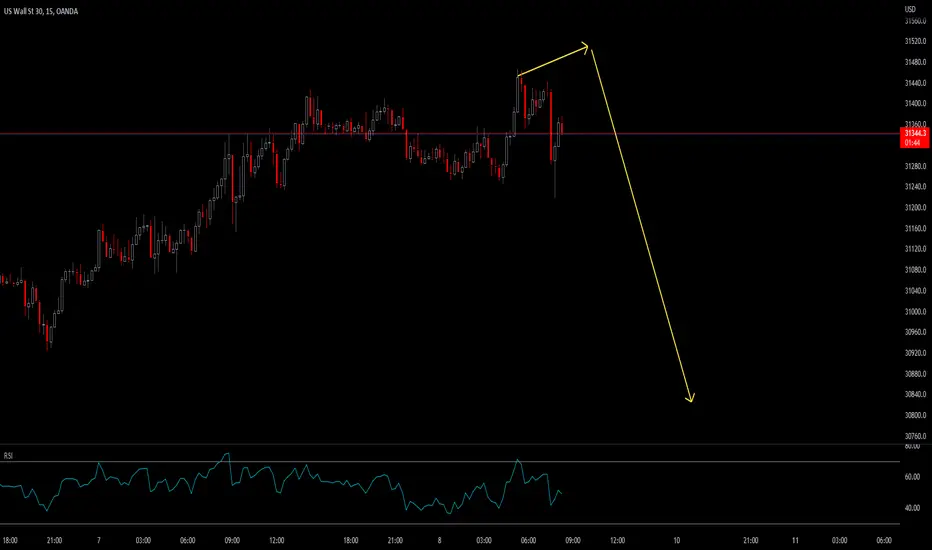
Let's Dump Dow jones!!US stock indexes might not finish the week with healthy gains so this my forecast for Dow jones So yesterday the price has reached Supply Area So I think we will have huge drop from this level
DOWJONES this week Pump it before FOMCI think this week everything against dollar will go up until next week and after fed interest rate they will dump it
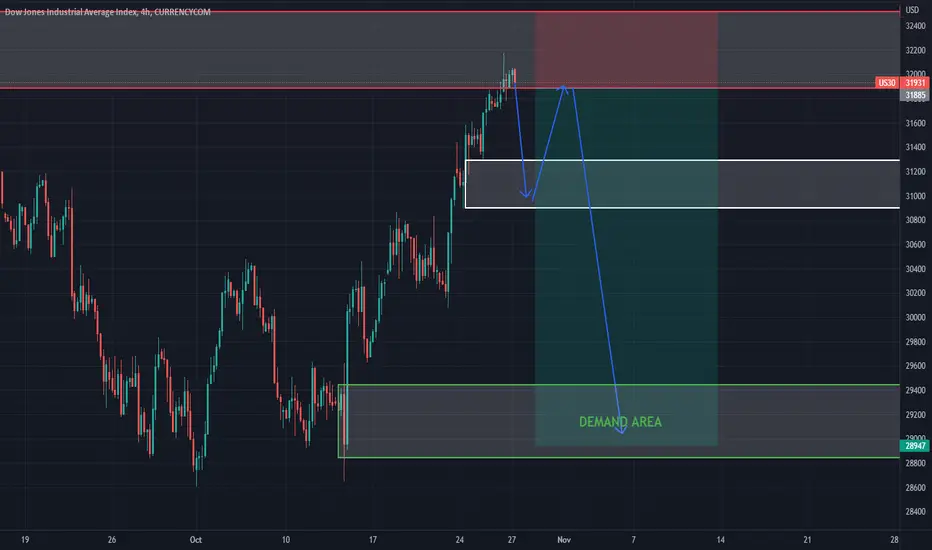
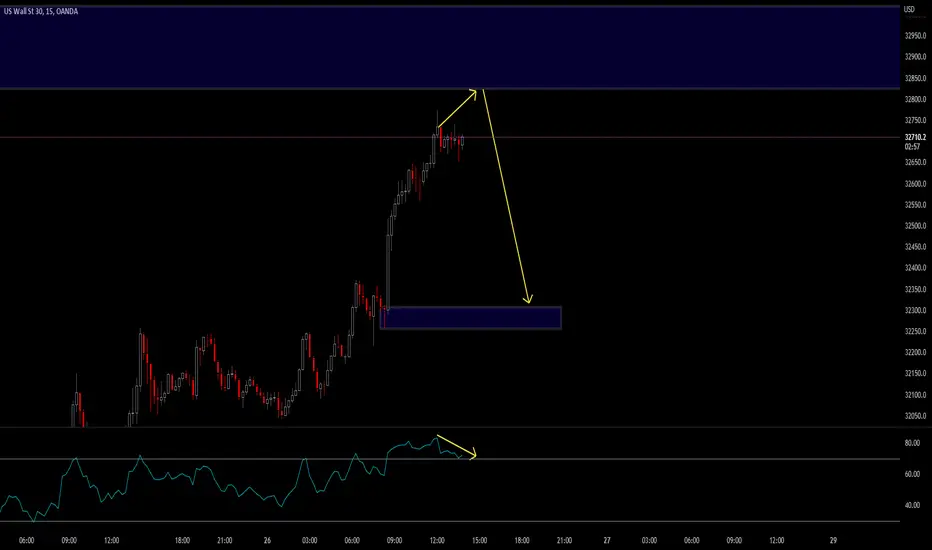
DOWJONES this week?!We saw on Thursday the market broke the structure and on Friday went for a retracement so I think we have a nice buy entry between 29400 - 29100 price it might go lower than that for stop loss hunt aka sell side liquidity smart money is Going to fill their bags at 30900-31200 levels.
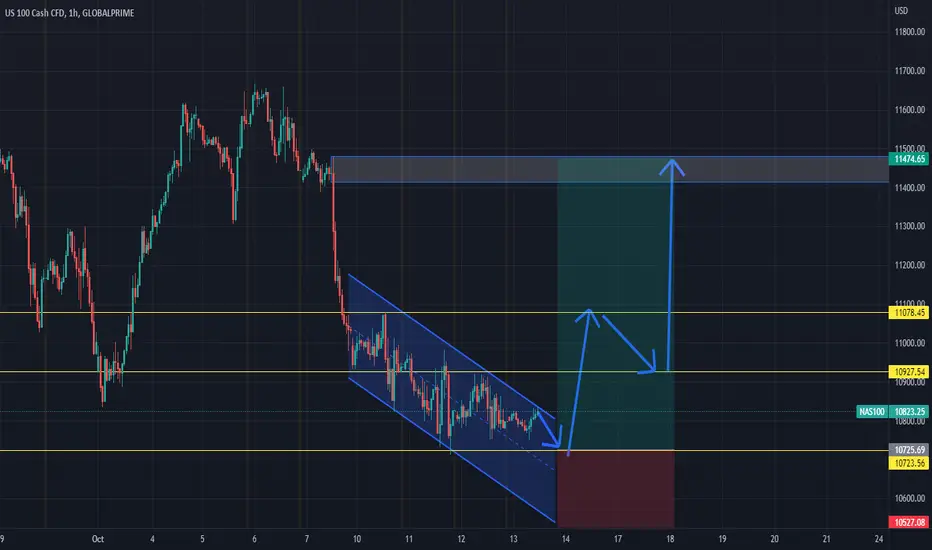
Nasdaq Today !!we can spot a falling wedge pattern that is very close to a breakout also very well respected and this provides a great opportunity for a long position! but don't forget we have Consumer Price Index after 1 hr from now which is a key way to measure changes in purchasing trends and inflation. if its less than Forecast then we will see Nasdaq, Dow and Gold will move to upward but if it's more than forecast then we will see market crash thats why we have put our stop loss near !!
Please note that all analysis and signals is our view of the market . We are not responsible for any decision you make.
•Don't Forget to manage your risk

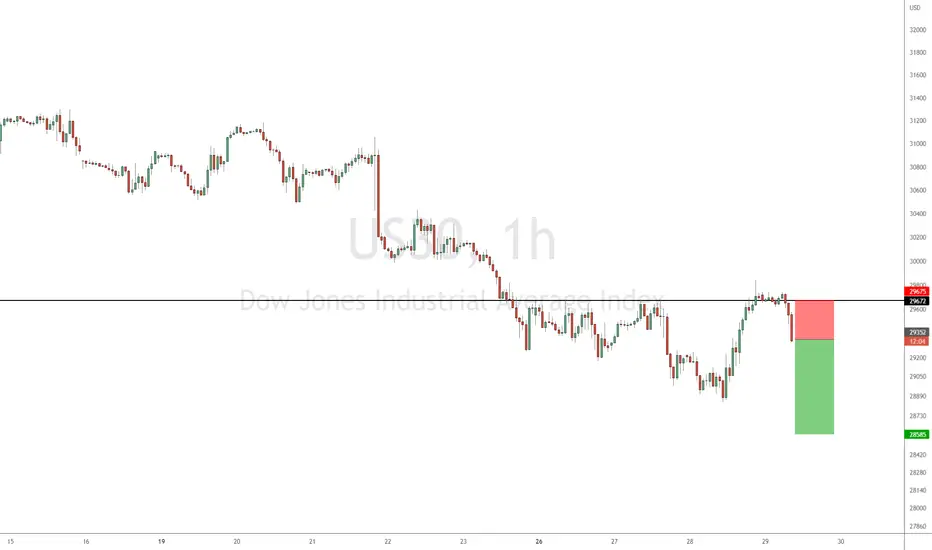
Joe Gun2Head Trade - Selling the weakest of the US indicesTrade Idea: Selling US30
Reasoning: Selling the weakest of the US indices
Entry Level: 29352
Take Profit Level: 28585
Stop Loss: 29675
Risk/Reward: 2.37:1
Disclaimer – Signal Centre. Please be reminded – you alone are responsible for your trading – both gains and losses. There is a very high degree of risk involved in trading. The technical analysis , like all indicators, strategies, columns, articles and other features accessible on/though this site is for informational purposes only and should not be construed as investment advice by you. Your use of the technical analysis , as would also your use of all mentioned indicators, strategies, columns, articles and all other features, is entirely at your own risk and it is your sole responsibility to evaluate the accuracy, completeness and usefulness (including suitability) of the information. You should assess the risk of any trade with your financial adviser and make your own independent decision(s) regarding any tradable products which may be the subject matter of the technical analysis or any of the said indicators, strategies, columns, articles and all other features.
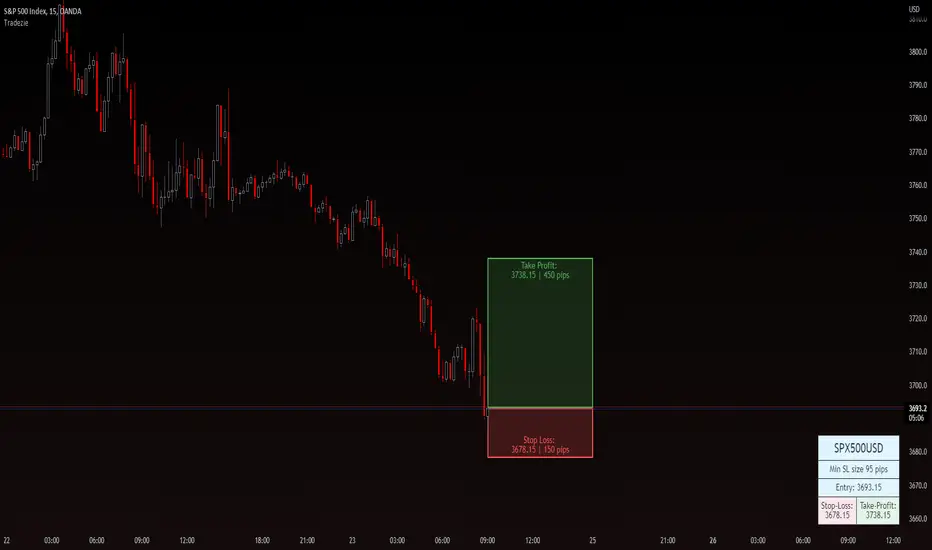
SPX500 15min chart, Bullish Direction150pip SL, targeting 1:3RR. Trading 15min RSi Divergence here as entry.
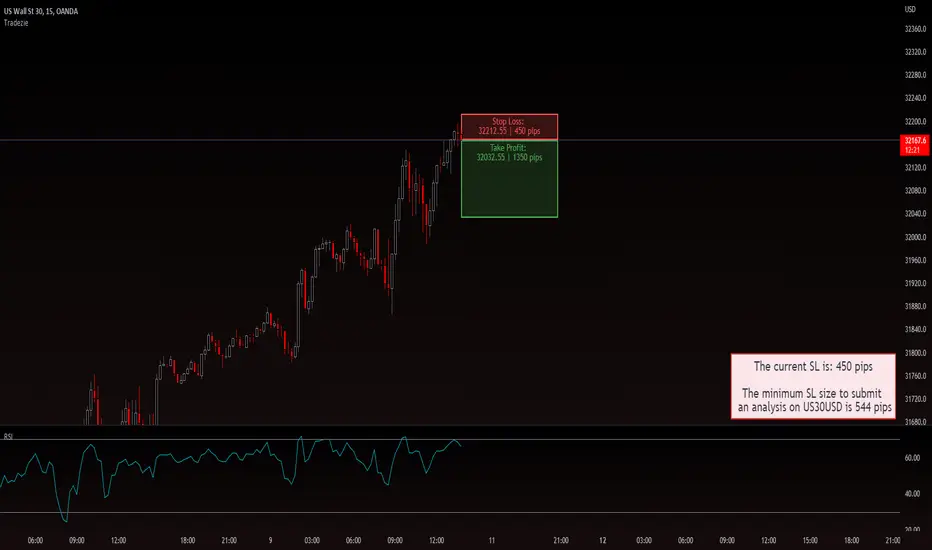
US30, 15min Chart, Short positionUS30 has entered into a Daily Supply level all while giving us a very nice 15min RSI Div setup for our entry. I will look to short here and take it to previous lows. The stop loss is 450pips and i am shooting for a 1:3RR.
US30 Long15min RSI Setup, will be a banger! We are also inside a nice 1H Demand that should see some reaction.
US30 ShortThis is what i'll be watching for on US30. 15min RSI Divergence to form, then a huge drop to follow. Atleast a 1:12 trade here coming up.
US30 SHort, massive swing inboundWhere to start.. economy is shit, and the FED keeps printing money leading to an artificial bullish market. what could go wrong right?
*4H Supply Zone tapped into
*4H RSI Divergence is about to finish forming
*4H Pinbar to form showing insane rejection and candlestick confirmation
*15min RSI Divergence for entry.
This could be a killer

US30 ShortHere's my 15min short for US30. We are sitting in a massive 4H Supply Zone, and we have some very clear RSI Divergence as confirmation. Lets get it.

US30 ShortI will be watching for this to happen on US30. Once we approach into the zone i will be looking for either 15min RSI Divergence or SMT Divergence to occur with SPX500. Those are my only entry criteria.

US30 BuyI will be waiting for this to play out on US30. Watch 15min RSI Divergence to form. When it does, place order at close of bearish candle that creates the divergence, 45pt stop then target that area above! Let's get it!

US30 15min ShortI am watching for this to happen on US30. Will be waiting for 15min to show RSI Divergence then will go in!
US30 15min ShortI am expecting this for US30. Watch the 15min chart very closely and wait until RSI Divergence forms. As soon as the bull candle finishes forming you will enter the trade with a SL of 450 pips. Target previous lows.

US30 ShortWe are finally reaching into a very large 4H Supply Zone, and i am hoping to see RSI Divergence form on the 15min for an entry. With 15min RSi Setups i always use 35pts (350pips) and target 1:7RR. Happy trading!
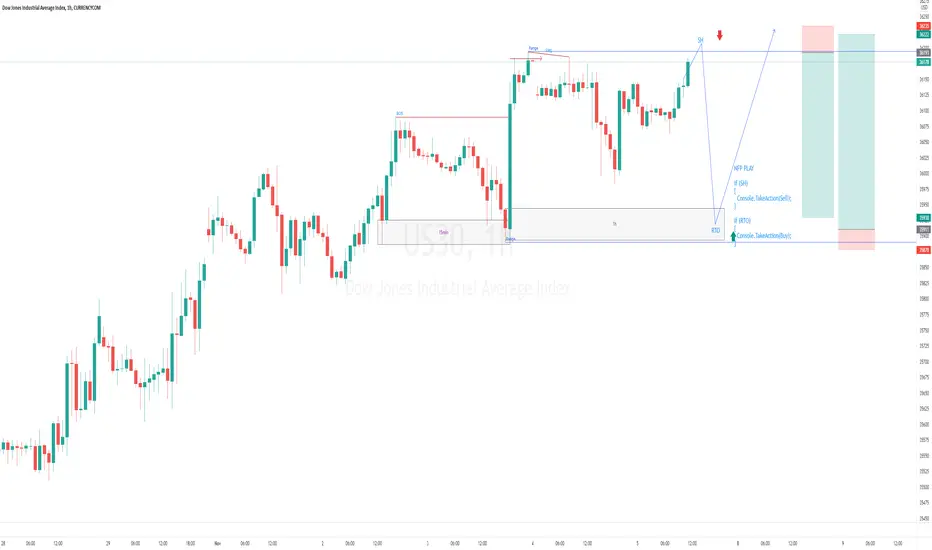
US30 NFP PlaybookFirst post here
It's NFP day today and here is my chart markup for how I plan to play the news.
The syntax is for those who understand coding language. If you don't you can look at the chart to understand what it means.
NFP PLAY
if (SH)
{
Console.TakeAction(Sell);
}
if (RTO)
{
Console.TakeAction(Buy);
}
The plan is to SELL if there is Buy to Sell (SH) then BUY if the price returns to breakout origin.
Feel free to ask me any questions you may have.