Dow Jones Industrial Average: To 36000 Epic Milestone and BeyondDow 36,000: A New Strategy to Profit from Coming Stock Market Growth is a book published on October 1, 1999 by columnist James C. Glassman and economist Kevin A. Hassett in which they argued that stocks were significantly undervalued in 1999 and came to the conclusion that the market will grow 4 times, and the Dow Jones Industrial Average TVC:DJI will rise to 36,000 by 2002 or 2004.
The most important fact about stocks at the dawn of the twenty-first century: they are cheap...
- Glassman and Hasset. 1999. "Introduction". Dow 36000
However, life has made its own adjustments, and the era of "irrational optimism" (as it always happens) - came to its inevitable end.
In January 2000, just about three months later the publication of the book, the Dow Jones Index reached a record high of 11,750.28 points, which subsequently remained unbeaten for the next 6 plus years.
In the early 2000s, the Index fell steadily after the dot-com technology bubble burst.
And after the well-known bang on the American Twin Towers happened on September 11, 2001, the Dow Jones index fell even more, reaching a minimum of 7286.27 points by October 2002.
Financial crisis of 2007-09 sent the Dow Jones to even lower levels, which ultimately freed the hands of Congress and the US Treasury to uncover the money bazooka through raising national debt limits.
In general, only after the second attempt to fix above DJIA 10-year moving average in the third quarter of 2011, the Dow was able to rise in a half of the predicted path (from about 10,000 to 36,000 points).
Just 18 years later to the publication, in October 2017, - Dow reached milestone of 23,000 points, and the final achievement of the desired mark of 36,000 points took place only in December 2021.
However, by that time just few people remembered this book and its authors, who were later called "charlatans". Given that over the 22-year period since the publication of the book, consumer spending in the US ( FRED:PCE ) has increased by more than 2.5 times overall; the prices of gasoline, oil, wheat, corn, and sugar have more than tripled, and the prices of metals such as copper and gold have risen 5 to 7 times.
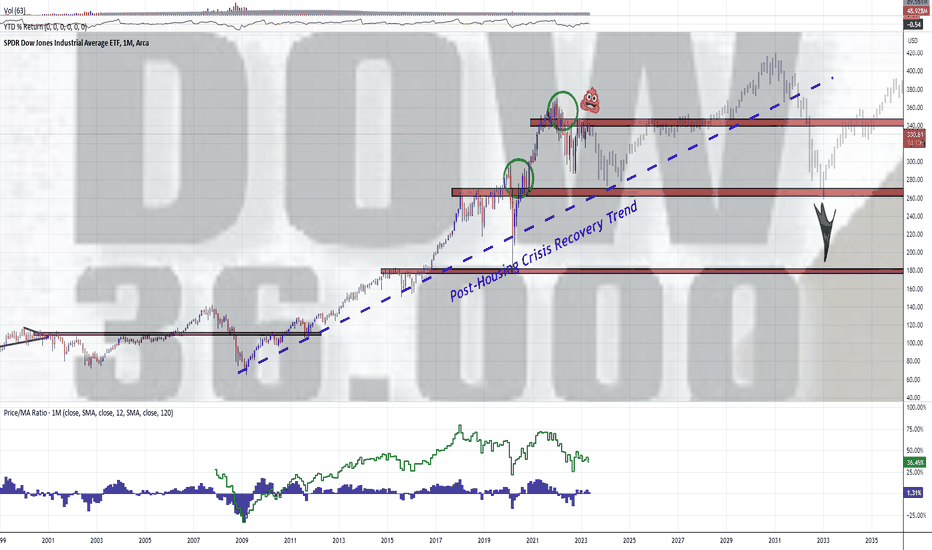
Closer to today's reality, the Dow Jones Industrial Average continues to follow the main uptrend trajectory formed by the US recovery from the 2007-09 Housing crisis. Dow stays for nowadays above its 10-year simple moving average that supported the index both in the third quarter of 2011 and at the time of Covid- 19 market collapse in the first quarter of 2020. At the moment Dow is being above the marked moving average by about 36.45%.
Technical resistance is considered as a range of 34,000 - 34,500 points, that lost in the first quarter of 2022. Attempts to return above this strong level have been overshadowed for several months - either by a banking collapse, and later by aggravated talk about the crisis of the US national debt ceiling.
In such scenarios, coupled with inflation, which remains significantly above the target level of 2 percent, despite repeated attempts to curb it by the Federal Reserve , the 36,000th milestone can for quite a long time, for a decade or even a year and a half, become a growth constraint of the world economy for quite a long time - for a decade or even fifteen years.
Key facts about the Dow Jones Industrial Average:
👉 Technical chart provided by ETF AMEX:DIA - SPDR Dow Jones Industrial Average ETF, generally in line with the price and yield of the Dow Jones Industrial Average (100:1 ratio).
👉 Dow Jones Industrial Average ( DJ:DJI ) is made up of 30 price-weighted blue-chip components of US stocks.
👉 DJIA is the oldest barometer of the US stock market, the flag and the logo of capitalism, and the most widely quoted indicator of the activity of the US stock market and world economy.
Djia
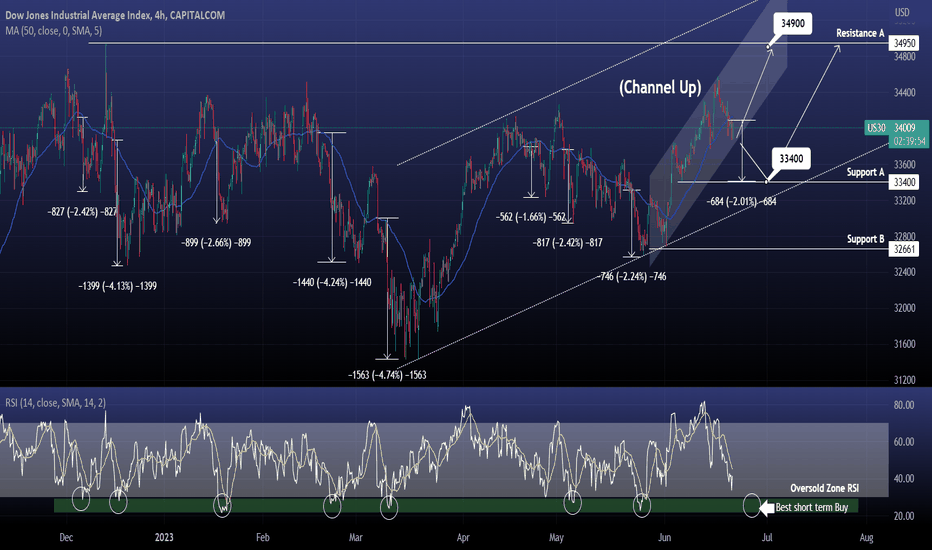
DOW JONES Crossed under the 4hour MA50. Short term sell signal.Dow Jones has crossed under the 4hour MA50 and hit the bottom of the short term Channel Up.
Since December, every closing under the 4hour MA50 has been a sell signal (8 times) with a decline ranging from -1.66% to -4.74% from the moment of crossing.
As long as the Channel Up holds, buy and target Resistance A at 34900.
If the Channel Up breaks, sell and target Support A at 33400.
Then since that Support is near the bottom of the long term Channel Up started in March and represents a -2.00% decline from the MA50 breaking moment, buy for the medium term and target again 34900.
A very consistent buy signal is when the 4hour RSI enters the green Oversold Zone. That has issued a rebound back to the 4hour MA50 on all 7 occurrences since December.
Previous chart:
Follow us, like the idea and leave a comment below!!
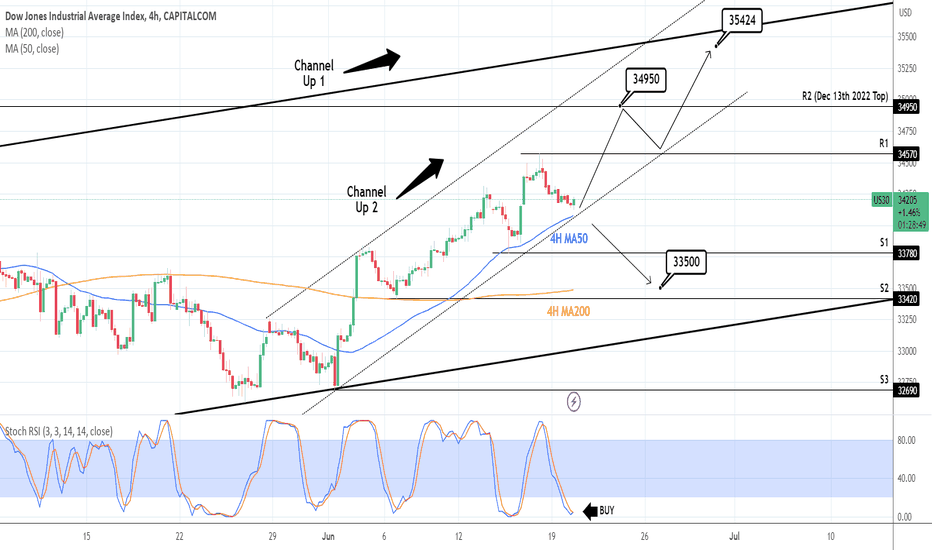
DOW JONES on the 4H MA50 on the Channel UpDow Jones touched the 4H MA50 and bottom of Channel Up 2 that is dominating June's price action. Naturally, the 1D technicals are bullish (RSI = 63.354, MACD = 250.370, ADX = 14.024) and the 4H ones marginally neutral, which indicates a short term buy opportunity.
With the 4H STOCH RSI making a Bullish Cross inside the oversold zone, that is technically a buy signal at least on the short term. The next technical Resistance is R2 and that's our target (TP = 34,950), which is also the Top of December 13th 2022.
If the candle closes under the 4H MA50 though, which would also mean crossing under Channel Up 2, we will short targeting the 4H MA200 (TP = 33,500).
Prior idea:
## If you like our free content follow our profile to get more daily ideas. ##
## Comments and likes are greatly appreciated. ##
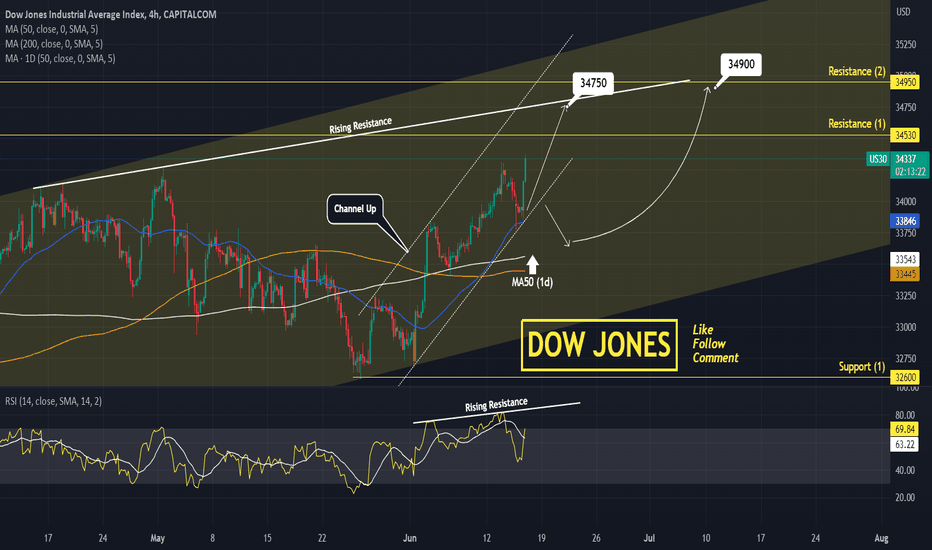
DOW JONES rebounding on the MA50 (4h) aiming at 34750.Dow Jones has had a strong rebound on the MA50 (4h) since the Fed low yesterday and maintains the short term Channel Up.
There is still much room for the index to rise inside the long term Channel Up.
Trading Plan:
1. Buy on the current market price.
2. If the price crosses under the Channel Up, buy on the MA50 (1d).
Targets:
1. 34750 (Rising Resistance).
2. 34900 (Resistance 2).
Tips:
1. The RSI (4h) has its own Rising Resistance to be mindful of. The last two contact points with it, formed Higher Highs on the short term Channel Up.
Please like, follow and comment!!
Notes:
Past trading plan:
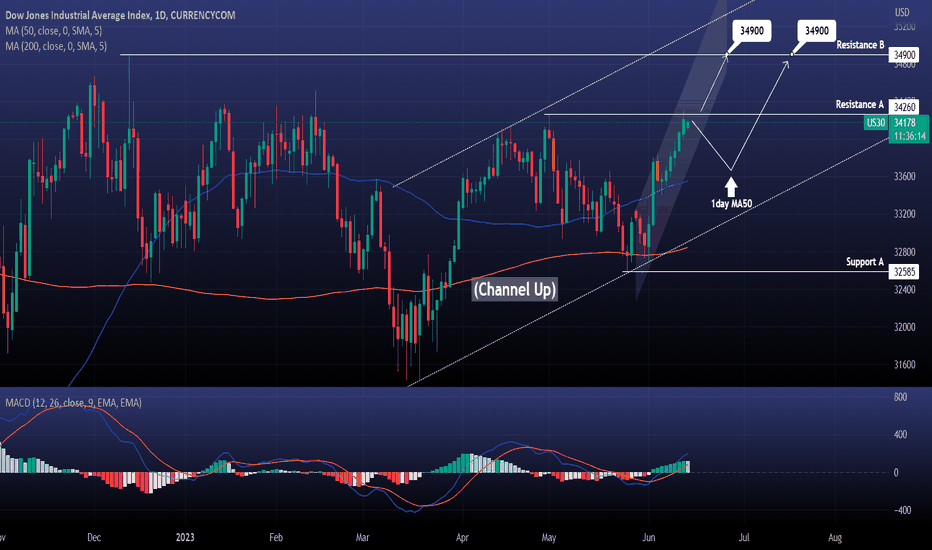
DOW JONES The closing of the 1day candle can send it to 34900Dow Jones/ US30 hit yesterday Resistance A (34260) but closed the candle under it.
If it closes over it, especially if the Fed assists with favorable news today, buy and target Resistance B at 34900.
Until it closes over it, a rejection is equally possible, with the 1day MA50 being the lowest buy entry in the event of a pull back.
The 1day MACD is still on a Bullish Cross, showing a healthy bullish trend.
Previous chart:
Follow us, like the idea and leave a comment below!!
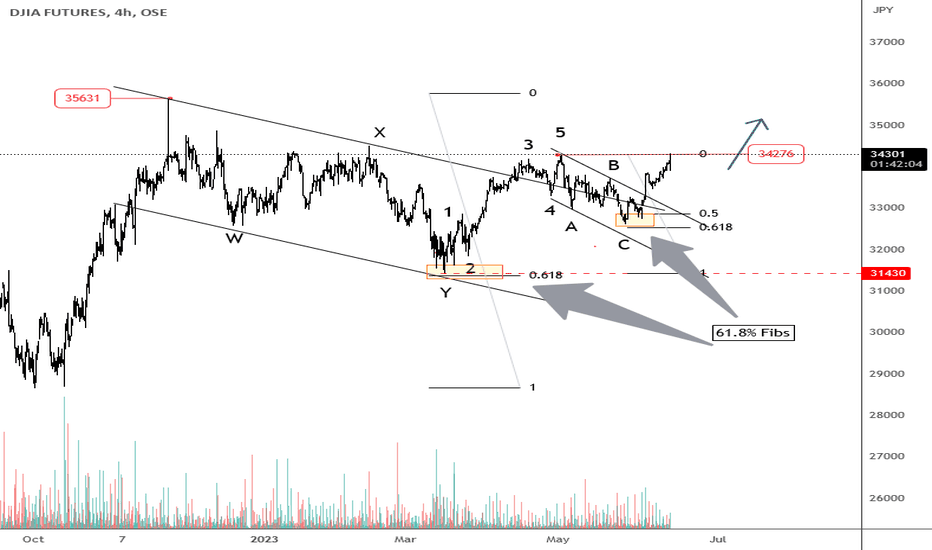
DJIA Is Bullish, Bouncing Away From The 61.8% Fib Stocks are bullish for the last few weeks, and some of indexes are finally breaking higher on speculation that FED is going to pause the hiking cycle. US CPI print also came out lower than expected, 4% down from 4.7% so there is even greate chance that FED will be on hold soon. When that’s the case stocks can move higher much easily, but still keep in mind that for higher stocks dovish times are the ideal, but hold is not dovish, and we forget this too many times. Anyway, looking at the DJIA, the trend is in a recovery mode and looks like more gains can be underway after first correction down to 61.8% Fibs back in March followed by five waves rise and then another perfect minor A-B-C drop again into 61.8% Fib. This is definitely the Fibs that needs a lot of attention and so far we can see a nice turn higher with price threatening 34276 level. Ideally a daily and weekly closes above that figure opens room for 35631.
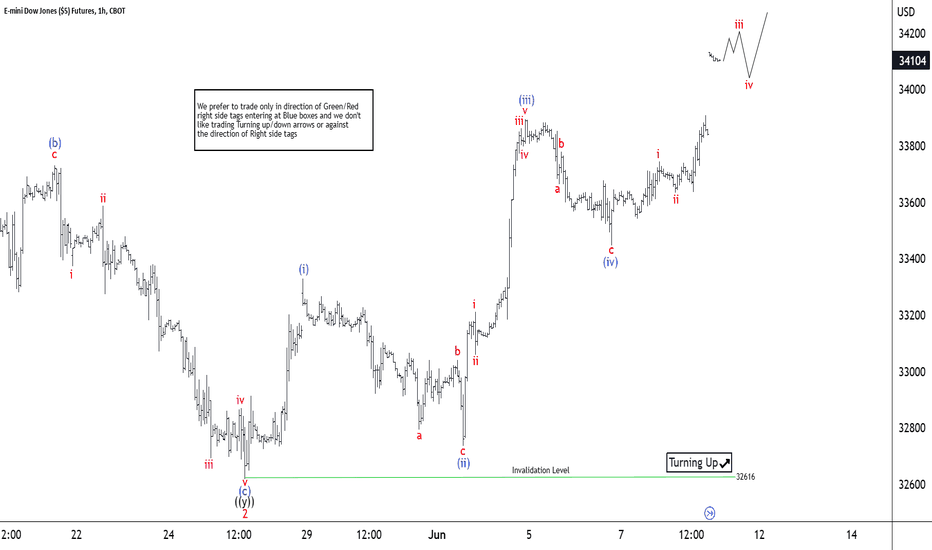
Dow Futures (YM) Rallying Higher as ImpulseShort Term Elliott Wave in Dow Futures (YM) suggests rally from 3.15.2023 low is in progress as a 5 waves impulse Elliott Wave structure. Up from 3.15.2023 low, wave 1 ended at 34363 and pullback in wave 2 ended at 32619. The Index has turned higher in wave 3 with internal subdivision as another 5 waves in lesser degree. Up from wave 2, wave (i) ended at 3330 and dips in wave (ii) ended at 32737. Up from wave (ii), wave i ended at 33212 and pullback in wave ii ended at 33060. Wave iii ended at 33863, wave iv ended at 33797, and wave v ended at 33894 which completed wave (iii).
Pullback in wave (iv) ended at 33448 as a zigzag structure. Down from wave (iii), wave a ended at 33665, wave b ended at 33780 and wave c lower ended at 33448. This completed wave (iv). Wave (v) of ((i)) is currently in progress. Up from wave (iv), wave i ended at 33745 and pullback in wave ii ended at 33635. Expect the Index to extend higher a few more highs to end wave v of (v) of ((i)). Then it should pullback in wave ((ii)) to correct cycle from 5.25.2023 low in 3, 7, or 11 swing before the rally resumes. Near term, as far as pivot at 32616 low stays intact, expect dips to find support in 3, 7, 11 swing for further upside.
DOW JONES Channel Up aiming at May's High.Dow Jones is trading inside a Channel Up and yesterday's low was on the 4hour MA200.
With an emerging 4hour Golden Cross, this is a buy signal on the short-term.
The 4hour MACD is also about to make a Buy Cross, a very consistent buy opportunity.
Target Resistance A at 34260.
Previous chart:
Follow us, like the idea and leave a comment below!!
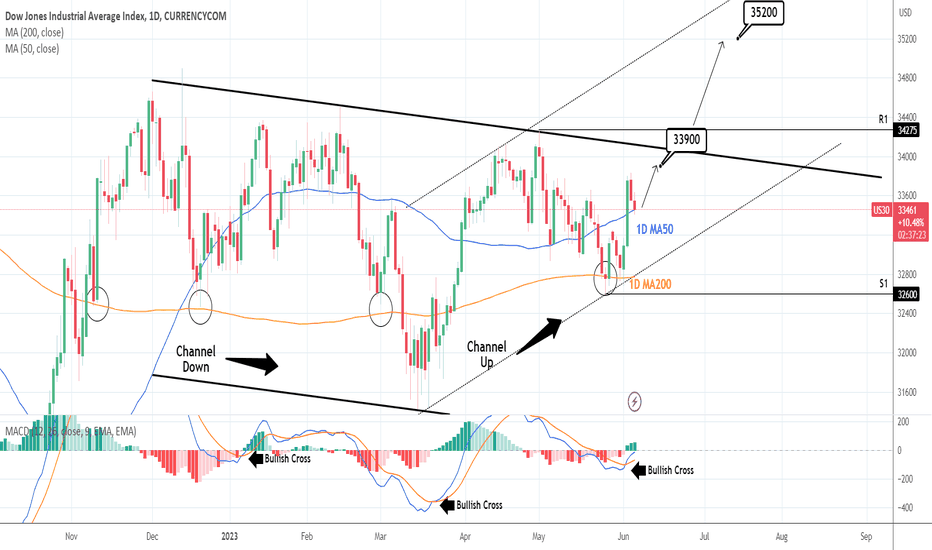
DOW JONES: Testing the 1D MA50. Rally if it holds.Dow Jones hit TP1 = 33,650 and is now going for our TP2 = 33,900 as per the trading plan we made last week (chart at the bottom). The 1D time frame finally turned (slightly) bullish (RSI = 51.712, MACD = -40.000, ADX = 28.963) for the first time since May 1st but today's pull back is testing the 1D MA50. If it holds, we expect to reach the 33,900 target that is under the top of the large Channel Down structure.
With the MACD having formed a Bullish Cross, there are high chances of this turning into a medium term rally into a new Channel Up. If R1 breaks (34,275) we will buy the breakout and aim at the top of this potential Channel Up (TP = 35,200).
Prior idea:
## If you like our free content follow our profile to get more daily ideas. ##
## Comments and likes are greatly appreciated. ##
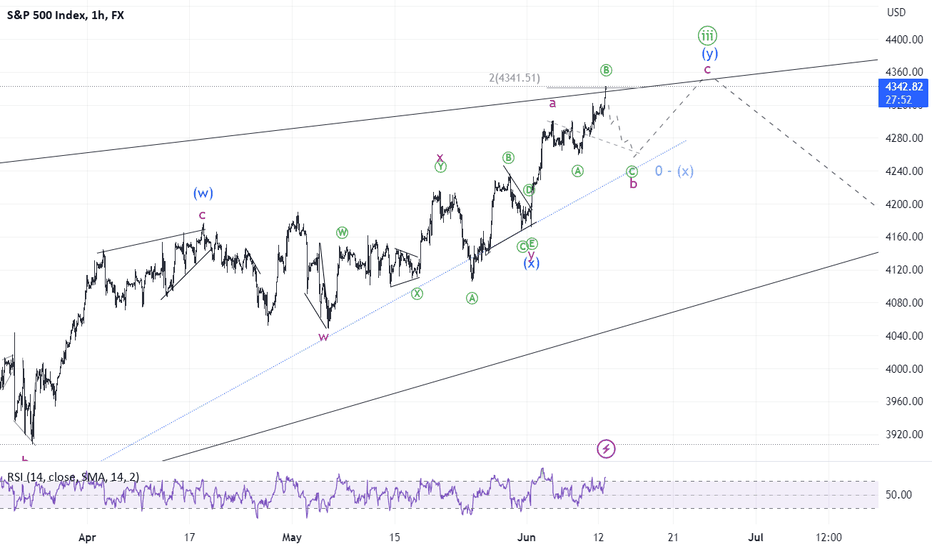
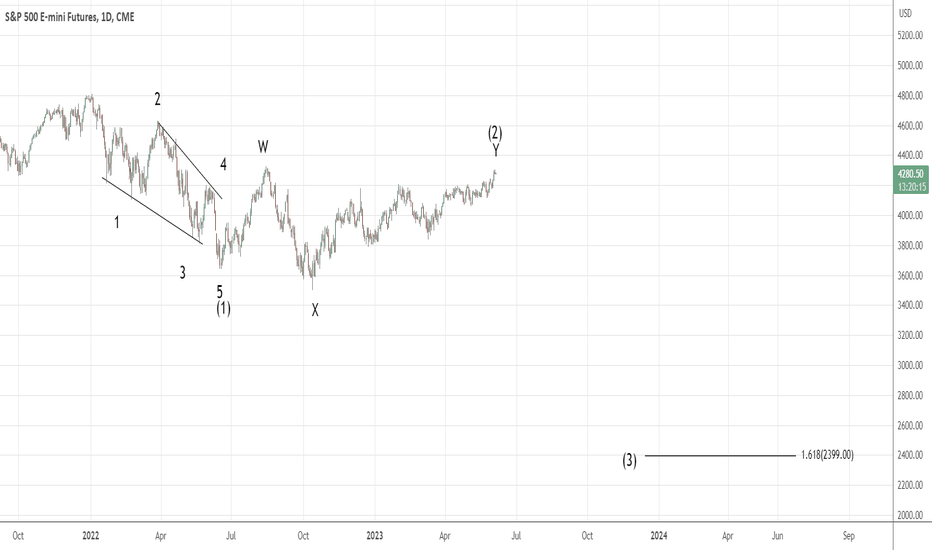
S&P500 and US stock marketThe medium- and long-term forecast of a serious fall remains in force , but so far there is no confirmation of its beginning, we are focusing on the above levels. Technically, we can still show a small increase, fundamentally the situation is unstable and the fall can begin at any moment. There are serious problems in the banking sector , the prospects of a recession . In previous reviews, the inversion of the yield curve (US government bonds) was mentioned more than once, at the moment the situation is only getting worse. Sooner or later, it will begin to return to a "normal state", which will be the beginning of an sharp phase of the crisis.
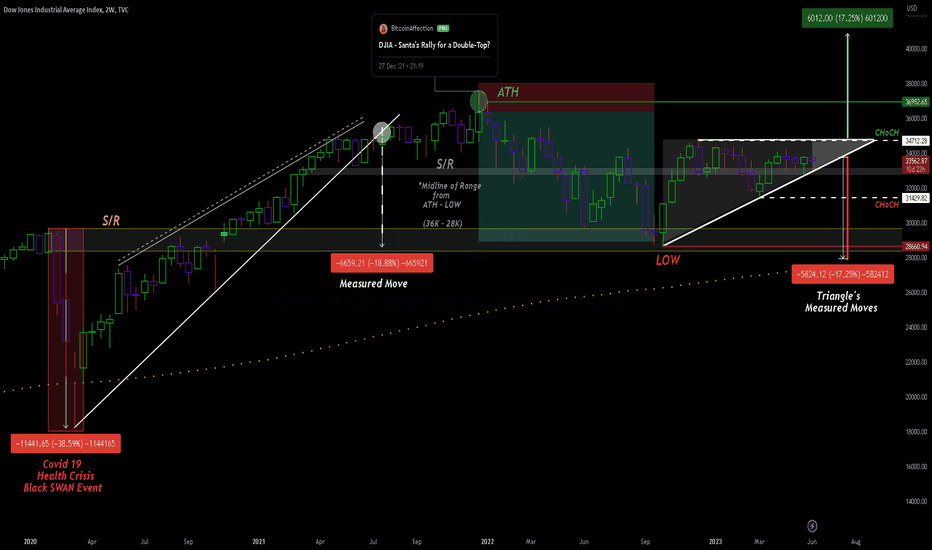
$DJIA -Awaiting Apex's End *2WBig Move incoming for Dow Jones Industrial Average.
AMEX:DJIA has created Triangle's Apex approaching the end .
Note that this is a Neutral Pattern, it can go each ways ;
Bearish and Bullish.
(depending on TVC:DXY , Geo-Politics & Macro Economics conditions)
For now, it's better to observe and stay sharp and await for further confirmations.
Nothing is clear yet TA speaking for AMEX:DJIA
AMEX:DJIA is one of the Heaviest Financial Sector for United States.
That being said,
it is very important to always have a lookout of its Price Action
and Trends Directions for further clarification of how other US Financial Sectors
will perform.
A Change of Charachter would definetely bring more clarification of reaching levels
of ATH or LOW
At the time of this idea being released price is finding some support at S/R
zone and 20-50EMA over maintaining their bullish crossover.
For now, it's better to observe and stay sharp and await for further confirmations.
Nothing is clear yet TA speaking for AMEX:DJIA , as well taking in to consideration
The Debt Ceiling decision that is yet to take place.
TRADE SAFE
***
Note that this is not Financial Advice !
Please do your own research and consult your Financial Advisor before partaking
any trading related activities based soly on this idea.
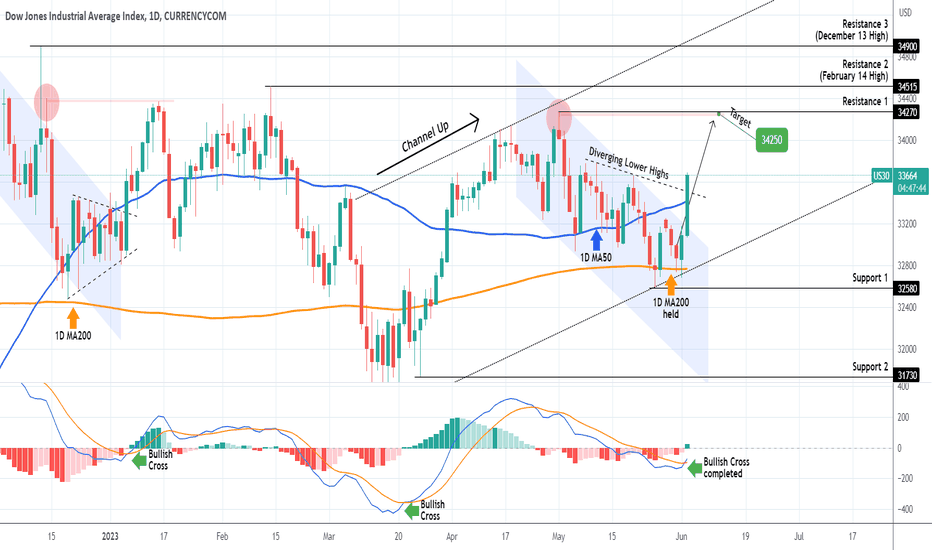
DOW JONES on a confirmed Bullish break-out.Dow Jones (DJI) has broken above the short-term Channel Down today, fulfilling the conditions for a buy break-out as presented on our previous analysis (see idea below) and is now even above the 1D MA50 (blue trend-line):
To add more to the bullish sentiment, it even broke above the Diverging Lower Highs and has no real Resistance until 34270, which is our short-term Target. The current rebounded was achieved after the 1D MA200 (orange trend-line) held as Support on three separate tests.
The hidden Buy Signal however was derived by the 1D MACD, which completed today a Bullish Cross, the first since March 21 that was the previous market bottom and the start of the current long-term Channel Up
-------------------------------------------------------------------------------
** Please LIKE 👍, FOLLOW ✅, SHARE 🙌 and COMMENT ✍ if you enjoy this idea! Also share your ideas and charts in the comments section below! **
-------------------------------------------------------------------------------
💸💸💸💸💸💸
👇 👇 👇 👇 👇 👇
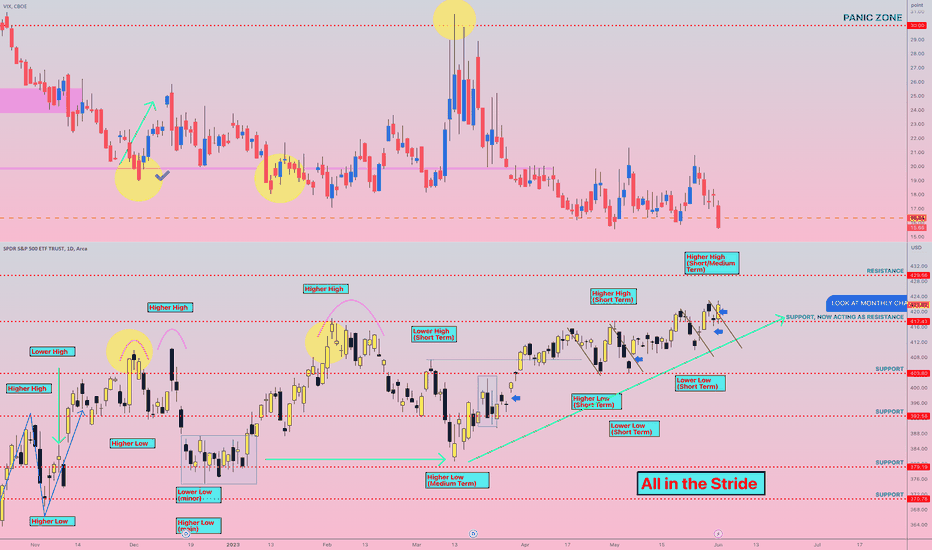
All in the Stride, 2 Jun 2023🖼 Daily Technical Picture 📈
➤ Equities shot up to continue the upward march. A Buy signal was triggered and executed. The previous Short position was flipped into a Buy but only after suffering further loss. Clearly the Strategy(ies) are confidently Bullish.
➤ If we look at the movement of the S&P500 equity index since the March bottom we can observe the character of the movement so far. Prices initially accelerated up into April. It proceeded higher with a two steps up, one step down type of progression.
➤ The step down has become shallower and shallower. This sort of behaviour can be thought of as people chasing the market or being more confident to buy the market. They are not willing to wait for lower prices. This is more obvious with the movement in the NASDAQ and mega tech stocks.
➤ Conclusion: 🐆 Surely that only leads to one conclusion: Markets are headed higher.
EQUITY TREND:
⦿ Short-term (weeks) - UP
⦿ Medium-term (< 6 months) - UP
⦿ Long-term (>6 months) - DOWN
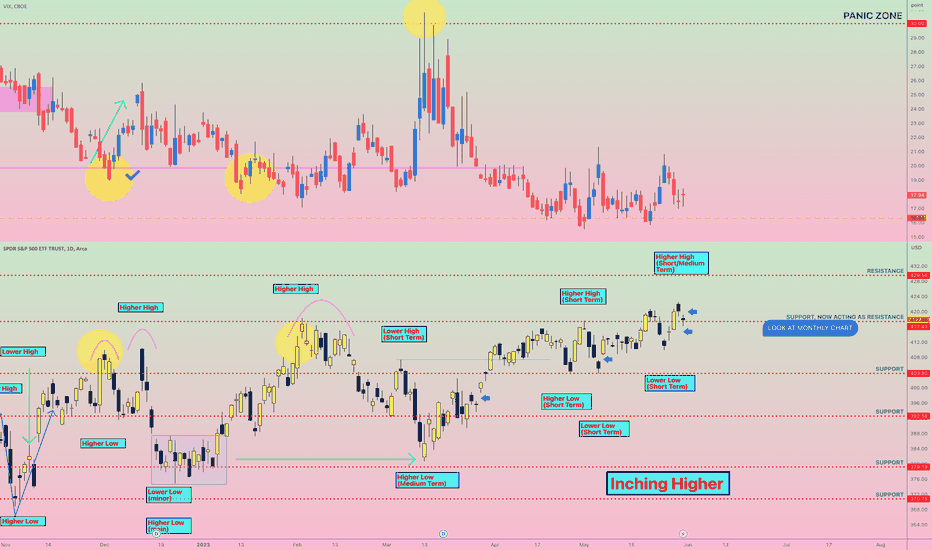
Inching Higher, 1 Jun 2023🖼 Daily Technical Picture 📈
➤ Markets pulled back but in the short-term, it is still zig-zagging upwards. It is inching higher and so is the hurdle required to proof the case for a new Bull market.
➤ For May, the monthly price failed to close above the Feb high just like in prior months. It has however put in a place a higher high. The higher high at 422.58 on the SPY is the new monthly hurdle that needs to be eclipsed. It is both hope and a struggle. The hope is for a new Bull market, the struggle is to get there. Picture a tiring swimmer that is treading water, getting closer to safety but barely keeping afloat.
➤ I hold a small short position.
➤ Conclusion: 🐆 Pricing is setting up for a high conviction short opportunity but I also said that many times in May. It failed to materialise into a trade.
EQUITY TREND:
⦿ Short-term (weeks) - UP
⦿ Medium-term (< 6 months) - UP
⦿ Long-term (>6 months) - DOWN
DOW JONES Trading approach going into JuneDow Jones / DJI is trading inside a Channel Down pattern for more than a month.
The price is now under the 4hour MA50 and as long as it closes there, sell and target close to Support A at 32600.
A crossing (and candle closing) over the 4hour MA100 will be a short term buy signal targeting 33400 (top of the Channel Down).
A crossing (and candle closing) over the 4hour MA200 will be a long term buy signal targeting Resistance A at 34260.
Previous chart:
Follow us, like the idea and leave a comment below!!
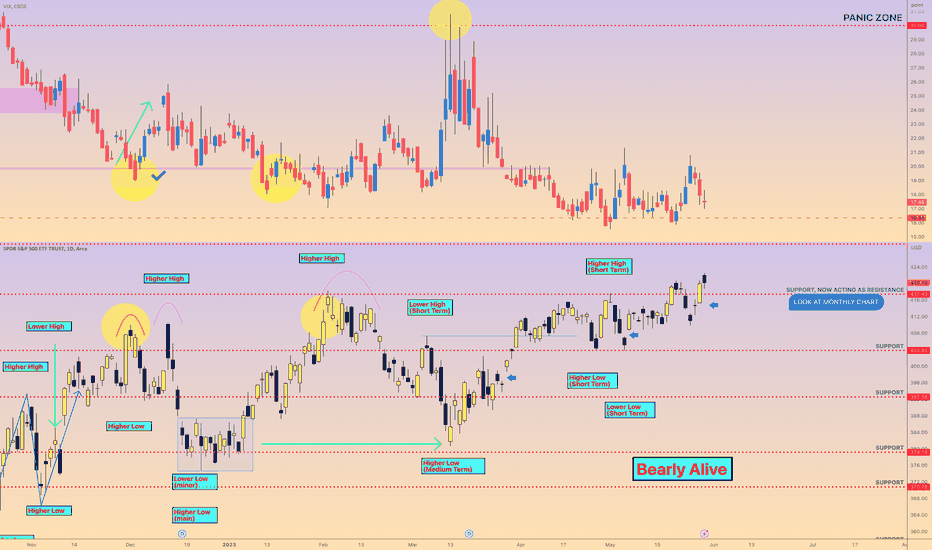
"Bearly" Alive, 31 May 2023🖼 Daily Technical Picture 📈
➤ Bulls may have horns instead of FAANGS but it is just an effective weapon. By some measures the Bear market is over and the Bull market phase is in its infancy.
➤ For me, a strong monthly close in May above the February high is that confirmation. Such a close would reverse the downtrend on the monthly chart. A failure to do so will keep the Bears alive...barely.
➤ The only threat to the Bull market story is in the lack of breadth of stocks contributing to the rise of equities. A strong market is usually composed of multiple sectors leading the charge. Here we only have a very select group of mega tech stocks. To breathe new life into the Bearish narrative, the FAANG bubble needs to implode almost immediately along with the AI hype.
➤ I hold a small short position.
➤ Conclusion: 🐆 FAANGS are sharp.
EQUITY TREND:
⦿ Short-term (weeks) - UP
⦿ Medium-term (< 6 months) - UP
⦿ Long-term (>6 months) - DOWN
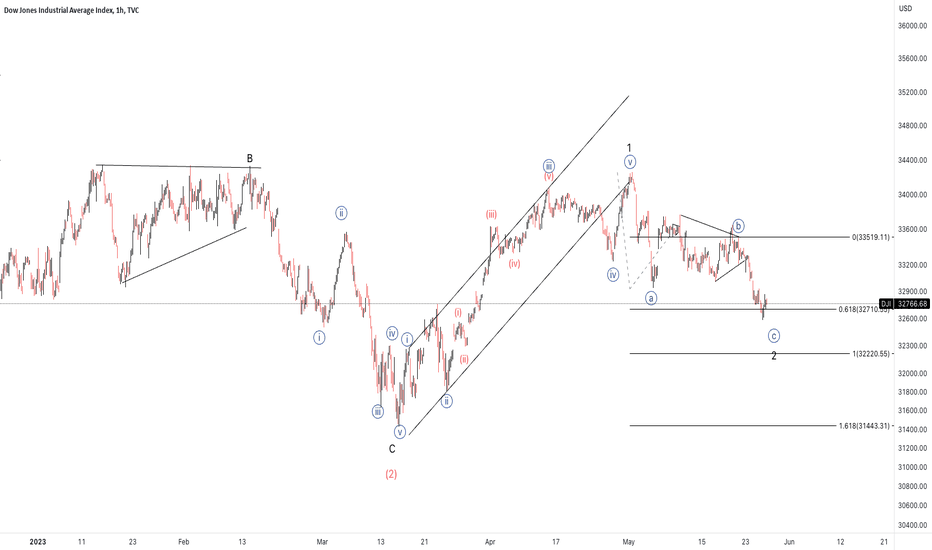
DJI looking for upside resumptionGood morning all!
I'll be breef as I the count kind of speaks for itself. It looks like we are ready to resume higher into wave 3 as we are looking at what appears to be a clear three wave move into wave 2.
It looks like TECH will be giving a break and VALUE will come back strong into sector rotation.
CHECK OUT my previous post on the NASDAQ which played out perfectly, let's see if this post will have the same faith.
Feel free to ASK me questions in the comments.
Enjoy the weekend and trade safe!
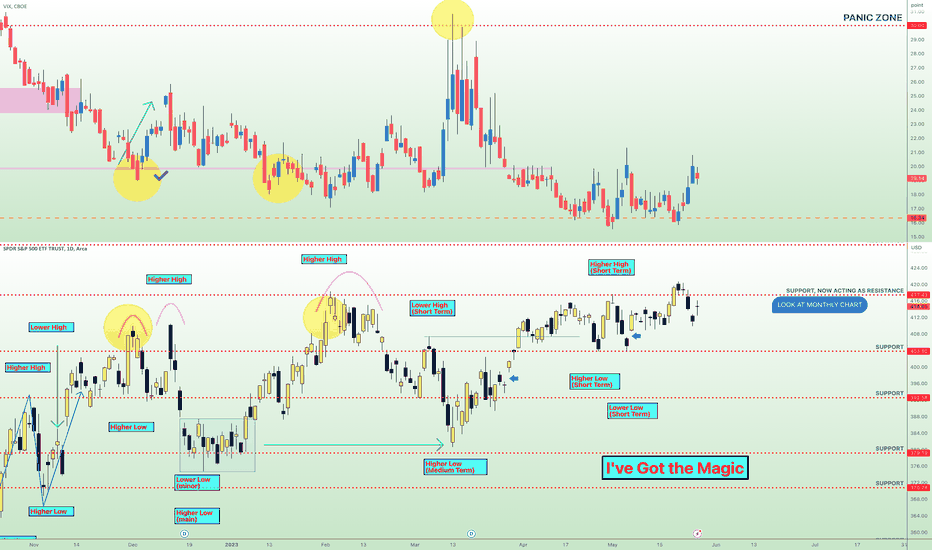
I've Got the Magic, 26 May 2023🖼 Daily Technical Picture 📈
"I've got the magic in me
Every time I touch that track, it turns into gold
Now everybody knows I've got the magic in me
When I hit the floor, the girls come snapping at me
Now everybody wants some crystal magic"
I'm borrowing those song lyrics by The Treblemakers from the Movie: Pitch Perfect.
➤ Equities did indeed gap higher to close the previous days' price gap and magically also closed the gap it created during today's open. Killing two birds (I mean gaps) with one stone.
➤ Nvidia's share price also played with the AI magic trick for a huge price gap of it's own. Will this gap get filled? I'm 💯% sure it will but not in one day.
➤ That being said, that bit of magic helped me out of my long position with a teeny tiny profit leaving behind a small short position. Price is setting up nicely for a Short move. If the price path that I imagine magically comes to fruition it should look something like this: Prices are re-testing the recent high by moving slightly up or down or sideways for a couple of more days prior to the real move lower.
➤ Conclusion: 🐆 I'm looking forward to seeing more magic tricks. 🪄
EQUITY TREND:
⦿ Short-term (weeks) - UP
⦿ Medium-term (< 6 months) - UP
⦿ Long-term (>6 months) - DOWN
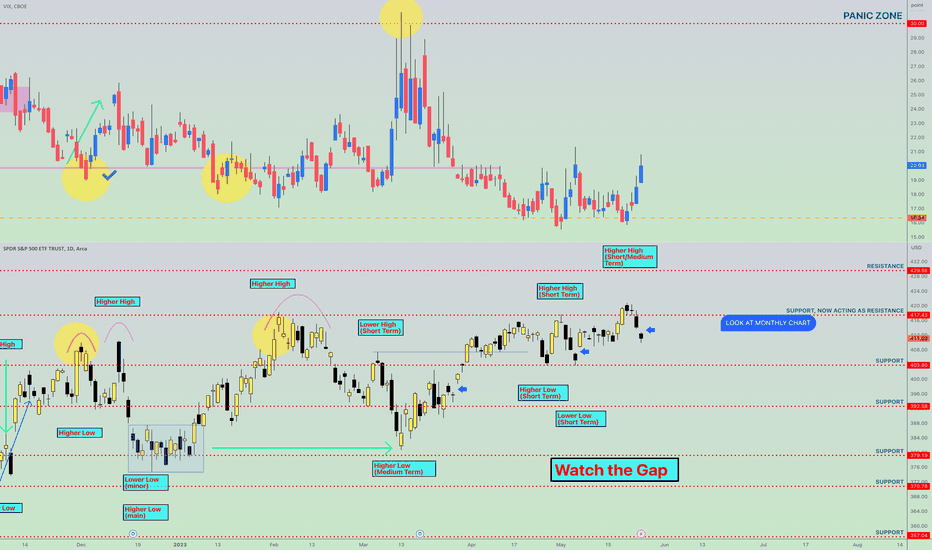
Watch the Gap, 25 May 2023🖼 Daily Technical Picture 📈
➤ Equities gapped lower but found short-term support at the 410 level on the SPY. The VIX accelerated higher. In after-hours trading the price has bounced higher. It would be interesting to see if this is sustained until market open. It could lead to the filling of the gap and in doing so creating another gap. Are you following my gapping explanation? If not, look at the chart. You'll note there are a couple of other unfilled gaps lower as marked by the blue arrows. These tend to get filled over time.
➤ Without prior knowledge of the after hours bounce, from the naked eye it does look price wants to bounce higher given the combination of 1) hitting a support level 2) deceleration in the drop (reducing bar/candle size)
➤ I do favour the notion that the immediate gap should be filled. That will hopefully get me out of my long trade for a profit. If that is fulfilled, I'll be looking for a potential Short entry shortly after if things play out as expected.
➤ I remain positioned fairly neutral for now.
➤ Conclusion: 🐆 The favoured view is for price to straddle lower.
EQUITY TREND:
⦿ Short-term (weeks) - UP
⦿ Medium-term (< 6 months) - UP
⦿ Long-term (>6 months) - DOWN
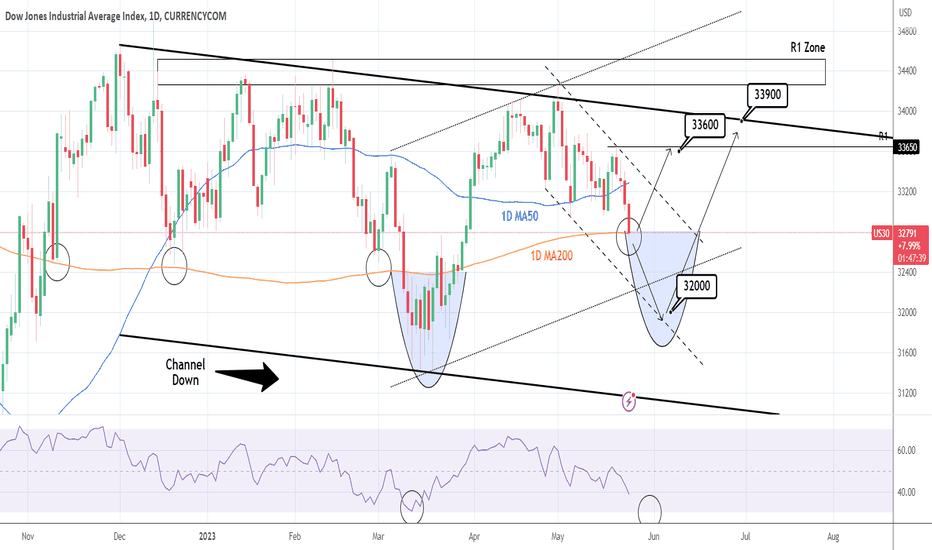
DOW JONES: Hit the 1D MA200 after almost 2 months.Dow Jones touched today the 1D MA200 for the first time since March 29th, almost 2 months after the strong bullish break-out. The 1D timeframe is technically bearish (RSI = 38.438, MACD = -67.410, ADX = 30.240), indicating that we are approaching low enough levels to justify a long term buy. However we are only willing to open a buy position as long as the 1D candles close over the 1D MA200 and target R1 (TP = 33,600).
If a candle closes below the 1D MA200, we will open a sell and target the bottom of the dashed Channel Down (TP = 32,000). Once the 1D RSI gets oversold, we will again buy on the long term, aiming at the top of the seven month Channel Down (TP = 33,900).
Keep in mind that the 1D MA200 has held and provided excellent buy signals, three times and only once on March 9th it broke.
Prior idea:
## If you like our free content follow our profile to get more daily ideas. ##
## Comments and likes are greatly appreciated. ##
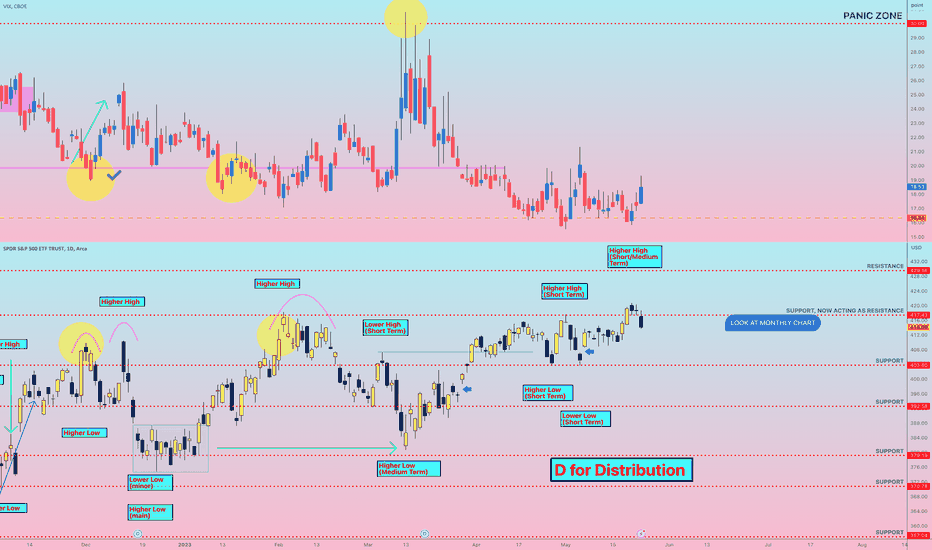
D for Distribution, 24 May 2023🖼 Daily Technical Picture 📈
"D is for Down
Like the Market today
D is for Distribution
We are on our way"
➤ Equities fell back into the recent consolidation. As discussed in yesterday's note, the price action now favours the bearish view. Price tends to fall to the bottom of the range.
➤ Assuming we are in the Distribution phase, the path lower can be abrupt or staggered. The abrupt case sees prices shoot straight through and below the low of the consolidation. The speed that happens displays the urgency of Sellers.
➤ A staggered path will see re-tests with prices briefly bouncing higher along the way down. It normally starts with the re-test of the high of the range. Each time the re-test will fail and prices fall further. It is at a lower speed with less urgency.
➤ Given the narrow range of the consolidation, it would only require a couple of large down days to find the bottom of the range. I'm not expecting a slow grind whatever path the price takes.
➤ Interestingly, I have received a buy signal and this has been dutifully executed. It is a small position to play the "re-test". Incidentally this hedges out the pre-existing small short position. Overall the portfolio is fairly neutral.
➤ Conclusion: 🐆 The Distribution can only be confirmed after the fact. i.e. price breaks below the range and keeps falling. Anything before that is just conjecture.
EQUITY TREND:
⦿ Short-term (weeks) - UP
⦿ Medium-term (< 6 months) - UP
⦿ Long-term (>6 months) - DOWN
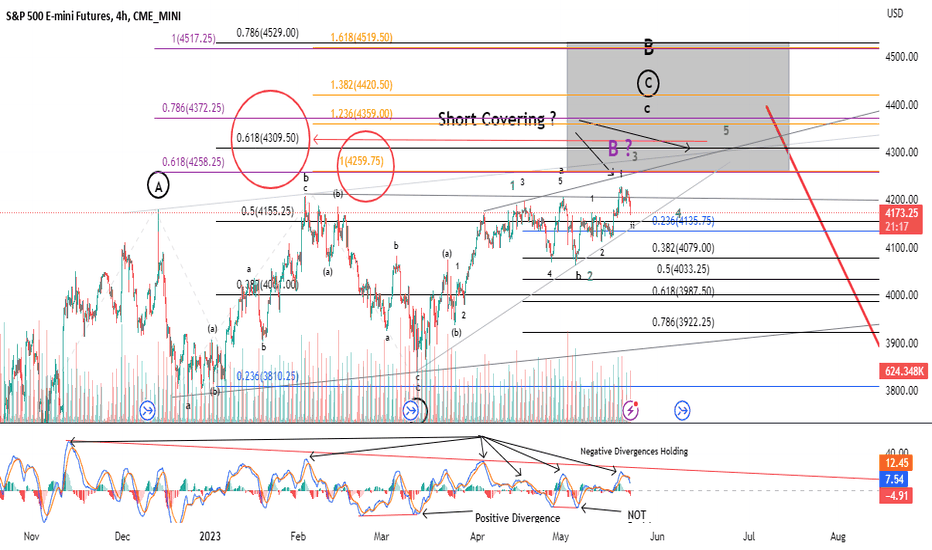
Weekly Update: The Triangle Count was Invalidated, Now What?Since the December lows of 3788 ES, I have been tracking a triangle pattern that would have reconciled higher in my target box for a larger B-wave. Readers can look at previous postings to see what I have been forecasting. Last week, SPX Futures breached the 4208.50 level. So, with that, the final micro target of an e-wave was invalidated and thus the triangle count abandoned.
With respect to a triangle pattern, two topics I continue to share with my members in our trading room is (1) Triangles are rare patterns, and (2) they typically invalidate between the D and the E wave, only to reveal a much simpler pattern. Yes, it is true price patterns can become complex when in the midst of a counter trend corrective rally or decline. However, I tend to keep my labeling simple rather than defaulting to the complex as many of these patterns tend to be viewed as simple zig zags in the rear-view mirror. That is what we have been presented with now that price has invalidated the more complex triangle pattern as featured above.
Here's where things get tricky.
For the Elliott Wave uninitiated, after an A and B waves you get…” Wait for it” …a C wave. Anyone who follows or practices Elliott Wave Analysis would agree when I say that a C-wave feels like a Crash when the reconciliation is to the downside, or a parabolic move when the trend is up. If you wish to challenge that my determination of that feel free to post your comments below.
I will admit in the short term, there appears to be some work to do to the upside for our A wave to equal our C wave higher. But here’s the most important piece of information I share with you today. With the breach of 4208.50 last week, I now have the minimum waves in place to consider this counter trend rally complete. However, as of the time of my authoring this weekly update, I have no immediate information that our upside pattern is complete. Let’s discuss what I expect now, and what clues we will see before such a “Crash Event” lower is underway.
My Expectation:
Let me start with the mathematical sweet spot for the counter trend price action to complete and reverse from. That price point is the .618% Fibonacci retracement level up at 4309.50. That would mean we have about only about 2.8% upside left to go from current levels.
However, the reasonable target area higher (above the .618% level at 4309.50) could extend at maximum to the price area of 4529. That is the .786% retracement level. In fact, prior to that level, price would have to exceed the 1.0 extension level higher at 4517. So, let’s assume that everything goes right with the Fed, Inflation, the Jobs Market, and Not to mention the debt ceiling…4529 would be the statistical anomaly for higher price action.
So, what’s my expectation higher: Provided we do not breach 4062.25 then I think it’s reasonable to expect 4309.50. Below 4062.50 and the possibility we are in our C-wave down to NEW LOWS, starts to get higher.
Disclaimer: If you have gotten this far in this post then you have read all of the above. Many of the comments I receive here on TradingView...are from people who scan my posts...but have a lot to comment on...al of which I address within the context of my posts.
Just like trading...reading is hard.
Best to all,
Chris
