Dow Jones Index Rises Towards Key ResistanceDow Jones Index Rises Towards Key Resistance
On Friday, the Dow Jones Industrial Average (Wall Street 30 mini on FXOpen) climbed above the 42,950 level — a high not seen since early March.
The index has gained around 1.6% since the beginning of June.
Why Is the Dow Jones Rising?
→ Friday’s US jobs report helped ease concerns about the country’s economic outlook. According to ForexFactory, Non-Farm Employment Change came in at +139K, beating the forecast of +126K.
→ On Thursday, Donald Trump and Chinese President Xi Jinping held a call, easing tariff tensions. Market participants also welcomed news that officials may hold trade negotiations in London on 9 June.
Could the DJIA (Wall Street 30 mini on FXOpen) Rally Continue?
Technical Analysis of the Dow Jones Chart
The chart suggests that the 42,950 level is acting as a significant resistance. The price has repeatedly reversed from the 42,660–42,950 area (as shown by the arrows).
At the same time:
→ Friday’s move above 42,950 triggered selling pressure, forming a candlestick with a long upper shadow;
→ This may have been a false bullish breakout of the May high;
→ The price remains within an ascending channel (shown in blue), but the bounces off the lower boundary appear weak.
Given this setup, it is reasonable to assume that intensified bearish activity near 42,950 on the USA30 could lead to a breakout below the channel’s lower boundary.
Additional pressure on the Dow Jones Industrial Average (Wall Street 30 mini on FXOpen) may come from developments in California, where protests have erupted against immigrant deportations, with President Donald Trump and Governor Gavin Newsom trading accusations.
This article represents the opinion of the Companies operating under the FXOpen brand only. It is not to be construed as an offer, solicitation, or recommendation with respect to products and services provided by the Companies operating under the FXOpen brand, nor is it to be considered financial advice.
Djiaanalysis

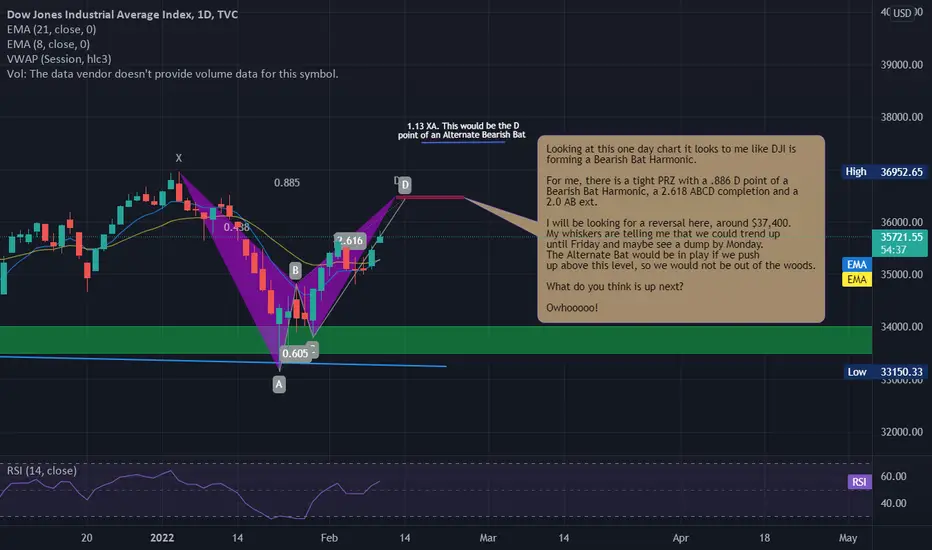
Dow Jones Industrial Bearish Bat?Looking at this one day chart it looks to me like DJI is
forming a Bearish Bat Harmonic.
For me, there is a tight PRZ with a .886 D point of a
Bearish Bat Harmonic, a 2.618 ABCD completion and a
2.0 AB ext.
I will be looking for a reversal here, around $37,400.
My whiskers are telling me that we could trend up
until Friday and maybe see a dump by Monday.
The Alternate Bat would be in play if we push
up above this level, so we would not be out of the woods.
What do you think is up next?
Owhooooo!
PLTRMost recent ABC was a bearish correction but it looks like the bulls canceled a retest of that bottom trend line and is now breaking out.

NASDAQThinking the NDX has been leading the dump and the DJIA & SP500 will dump harder % wise while NDX starts to lead the recovery IMO


DJIA long trade ideaPlan: resistance level breakout --> wait for the price to bounce off from support level --> wait for the rejection candle pattern to form e.g. bullish engulfing, pinbar, etc --> BUY
**Disclaimer** the content on this analysis is subject to change at any time without notice, and is provided for the sole purpose of assisting traders to make independent investment decisions.
Traders!! if you like my ideas and do take the same trade as I do, please write it in a comment so we can manage the trade together.
_____________________________________________________________________________________________________________________
Thank you for your support ;)
GWBFX

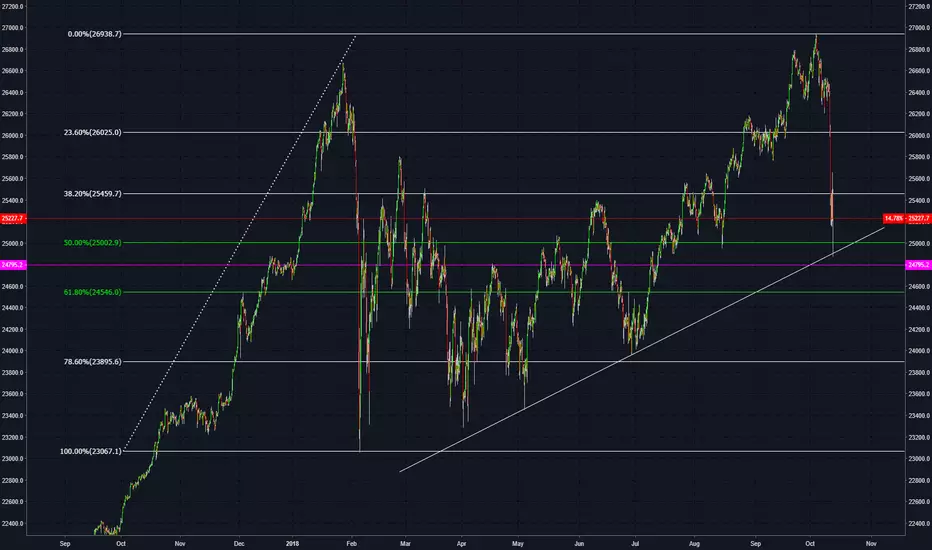
US30 AnalysisUS30 took a significant drop over the past couple of days. Price is approaching a historically significant key level on the weekly and daily (purple line). Note price is also hovering around 50% and 61.8% fib levels. Check out the trendline as well. Also must pay attention to fundamentals. Watching for potential rebound.

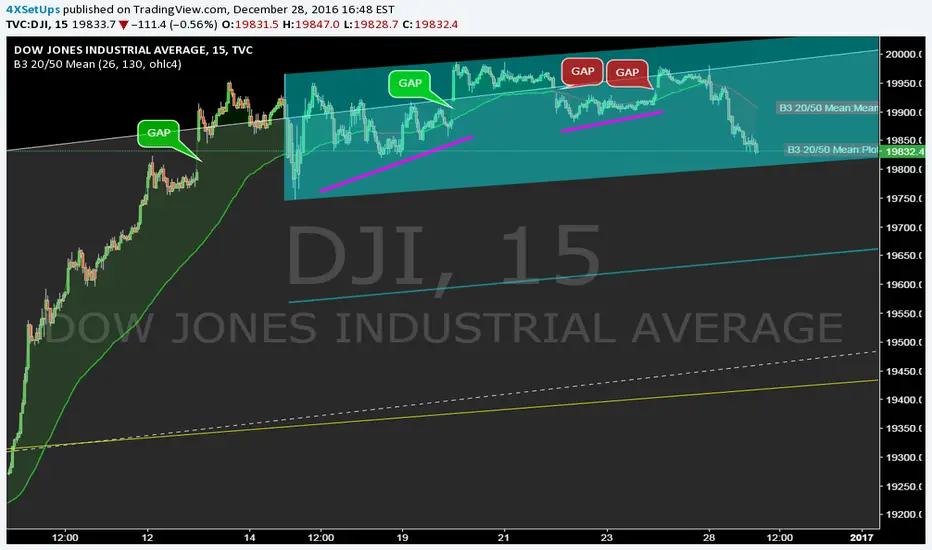
DJI @ 15min @ 1st bearish signals (2weeks) since trump elected ?This is only a trading capability - no recommendation !!!
Next week i`ll confirm or change my opinion about this SetUp :)
Buying/Selling or even only watching is always your own responsibility ...
Best regards
Aaron