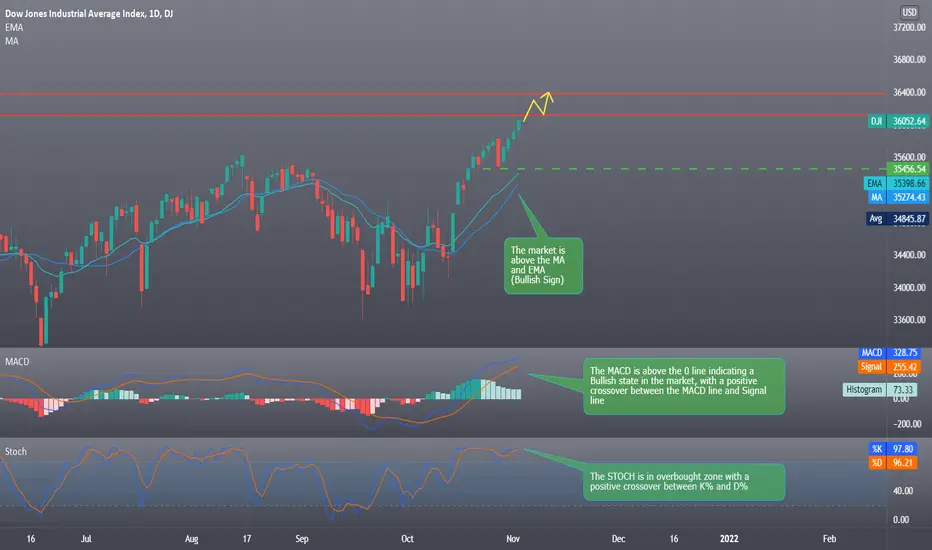
Dow Jones gained 0.39% what's next ?Hello everyone, as we all know the market action discounts everything :)
_________________________________Make sure to Like and Follow if you like the idea_________________________________
U.S. stocks were higher after the close on Tuesday, as gains in the Basic Materials, Technology, and Healthcare sectors led shares higher.
The Dow Jones Industrial Average rose 138.79 points, or 0.39%, to 36,052.63
Possible Scenario for the market :
The market is trading right now at $36052.64 and the trend is moving with a strong Bullish momentum that started on the 28th of October, After a sudden drop in the market.
This Bullish movement will probably be reaching the $36115.86 resistance level where it will be aiming to breakout that level to reach the resistance at $36380.11.
In case the Bears tried to make a move then we could be seeing a drop that most likely won't reach any further than $35456.54.
Technical indicators show :
1) The market is above the 5 10 20 50 100 and 200 MA and EMA (Strong Bullish signs)
2) The MACD is above the 0 line indicating a Bullish state in the market, with a positive crossover between the MACD line and Signal line.
3) The STOCH is in overbought zone with a positive crossover between K% (97.80) and D% (96.21)
Weekly Support & Resistance points :
support Resistance
1) 35575.99 1) 35978.05
2) 35332.38 2) 36136.50
3) 35173.93 3) 36380.11
Fundamental point of view :
The Fed will release a statement at the end of its two-day meeting on Wednesday when it is expected to announce the start of tapering its bond-buying program. Markets also are pricing an interest rate hike at the Bank of England meeting on Thursday.
"Most times, markets are happiest when they get predictability when they get what they expect, and I think the expectation is that they are going to taper," said Randy Frederick, vice president of trading and derivatives for Charles Schwab (NYSE:SCHW) in Austin, Texas.
This is my personal opinion done with technical analysis of the market price and research online from Fundamental Analysts and News for The Fundamental point of view, not financial advice.
If you have any questions please ask and have a great day !!
Thank you for reading.
Djianalysis
Am I Crazy to Expect DJIA to Drop by 8000 points Long Term?Markets are strong and the outlook currently is very bullish. So anyone who thinks that markts will drop significantly in the mid to long term would be laughed at right?
But i just cant help but notice that markets are way too high at the moment. everything seems pretty over valued - although market analysts will say the valuations are just about at the right level if not still low.
Could all these excellent company earnings be transitory, thus skewing the markets?
or perhaps theres something more to come, such as another wave of teh pandemic that could pull the markets down.
Whilst we are yet to see what it could be... my better judgement of technical alalysis tells me we could see a big correction in the markets over the long term.
Im aiming for around 26,000 for teh DJIA. Time will tell.

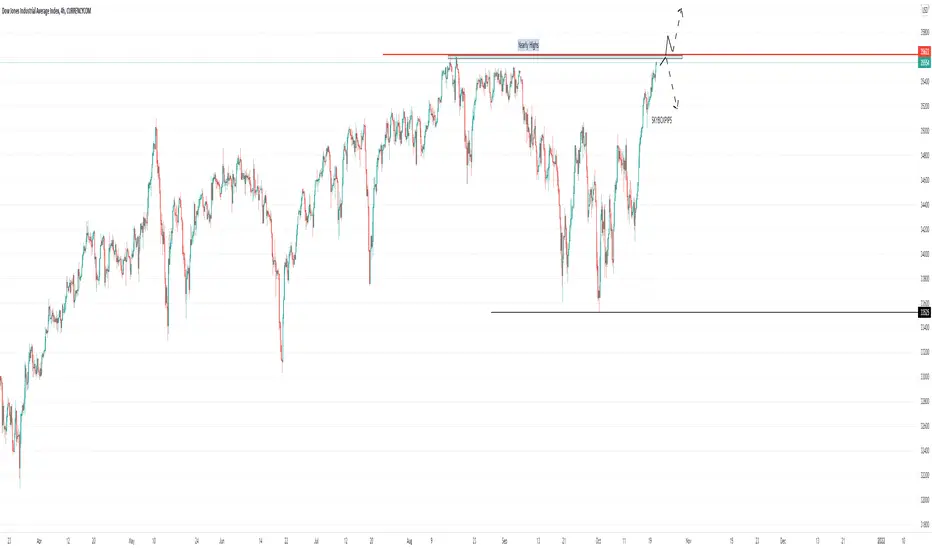
US30/ Dow Jones AnalysisPrice is approaching yearly highs AKA as a Liquidity Level. There is divergence going into the Liquidity Level so predicting price to immediately reverse and go short (short term) once it hits the Liquidity level OR Break and retest yearly highs to continue long. Wait for your price action and confluences.
This is simply my analysis and not financial advice
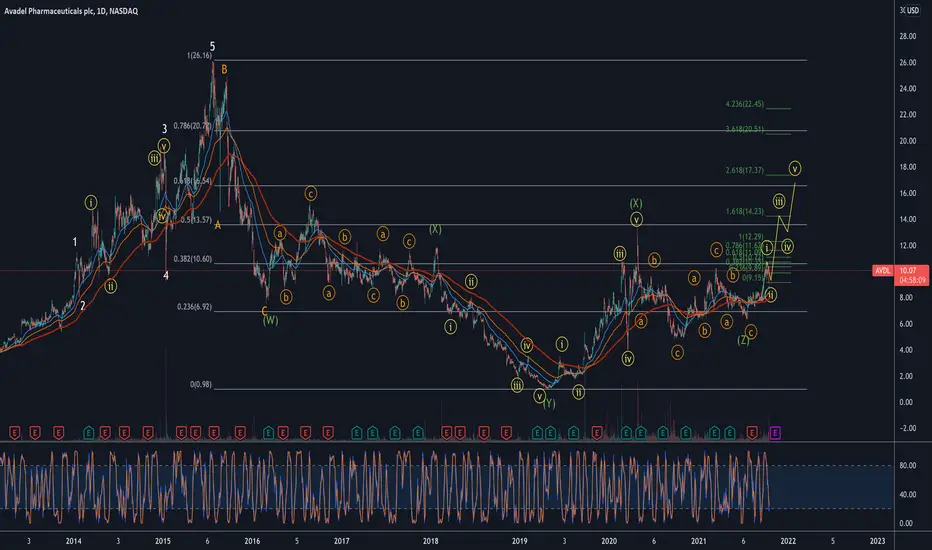
AVDLLooks like a push to the 618 fib retracement might be up next. If we have an impulsive 5 up incoming the chart should look like this IMO.
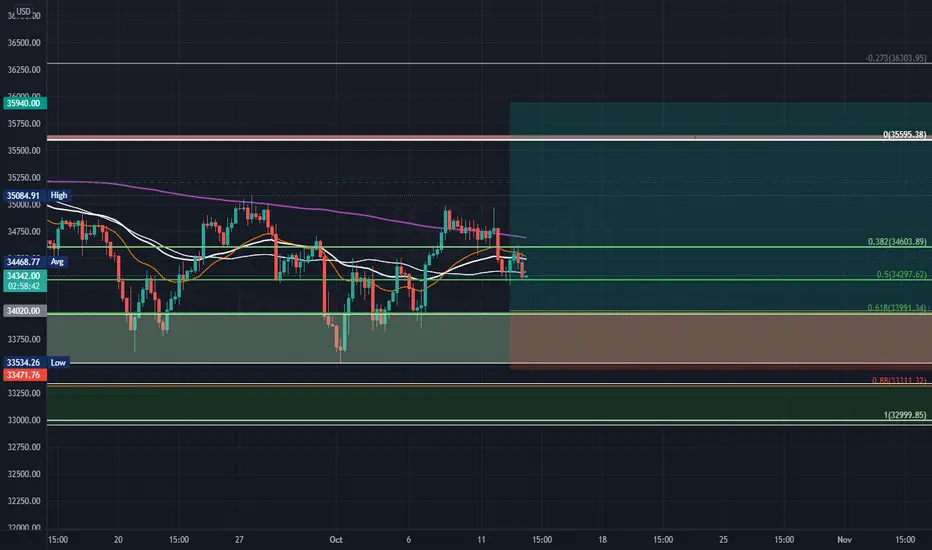
BUY US30/WS30: Swing Trading AnalysisEntering a Buy Limit order for US30:
Entry: 34020
SL: 33470
TP: 35940
The market is testing support at 34000, added 20 pips to accommodate for spreads and broker rates. Will enter a buy in this zone as soon as I see reversal signals in order to reinstate
LONG positions. The SL is below the zone. The entry also matches with Fib level of 61.8 which is a good area to buy especially on US30.
DJI forming a triangleDow Jones Index is forming a triangle with potential pump or dump of nearly 4 percent! Personally I think that it will breakout before the end of the triangle to a new all time high.

dji intraday tips dji intraday tips ..................................................................................

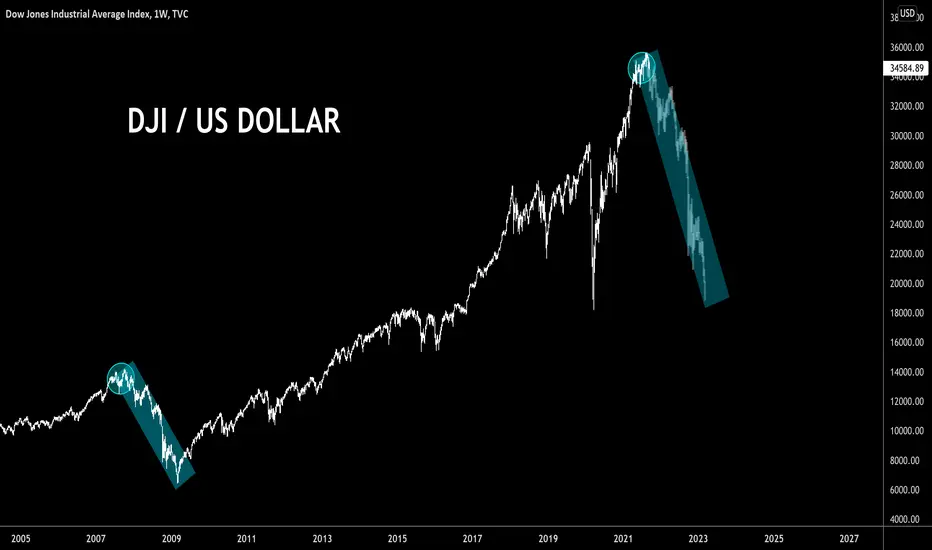
DJI - STILL LARGELY BEARISH AS DEBT CEILING APPROACHESDJI / US DOLLAR OVERVIEW
Looking at the broader picture here on a 5D chart, we see DJI following exact movement as per October 2007 - mimicking the financial crash of the 2008. As we continue to watch the events that unfold worldwide, an even greater threat to the healthy economy looms in the darkness, stock market crash (deflation of the financial stock bubble caused by an increasing world inflation).

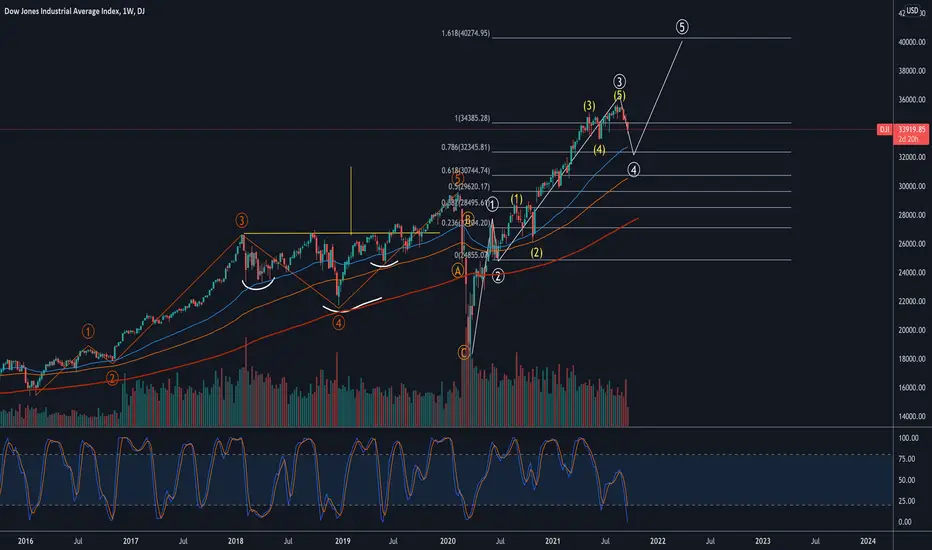
Dow Jones Industrial Index with higher potential up to 41003 possible Take profits for DJ:DJI
We are still in a bullish trend in the indexes like CURRENCYCOM:US30
SL under 33000
Fibonacchi Extensions:
TP1: 35600
TP2: 37000
TP3: ~40000
Dow Jones Industrial - Comparision to The Great Depression First time using tradingview for stock market and the first thing I saw was this. I had an idea to compare the charts from today's time and from the great depression. I am very noob at TA but I am starting to learn and understand basic principles and from what I've read, isn't the RSI one of the best indicators?
I mean... we have some big "news" in the world today that wasn't very welcomed and maybe the crash from March 2020 was just a sign of what is about to happen?

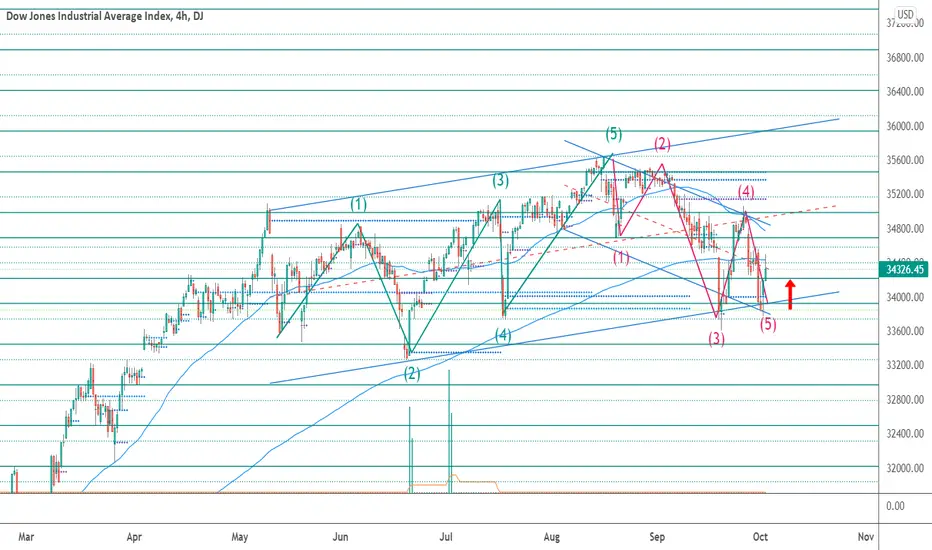
Dow Jones Industrial creates a double bottom at 33920Dow Jones Industrial creates a double bottom and forms a long-term price channel in H4. The Index also completed a five-wave pullback sequence to the downside and could head back up if it holds above 33920
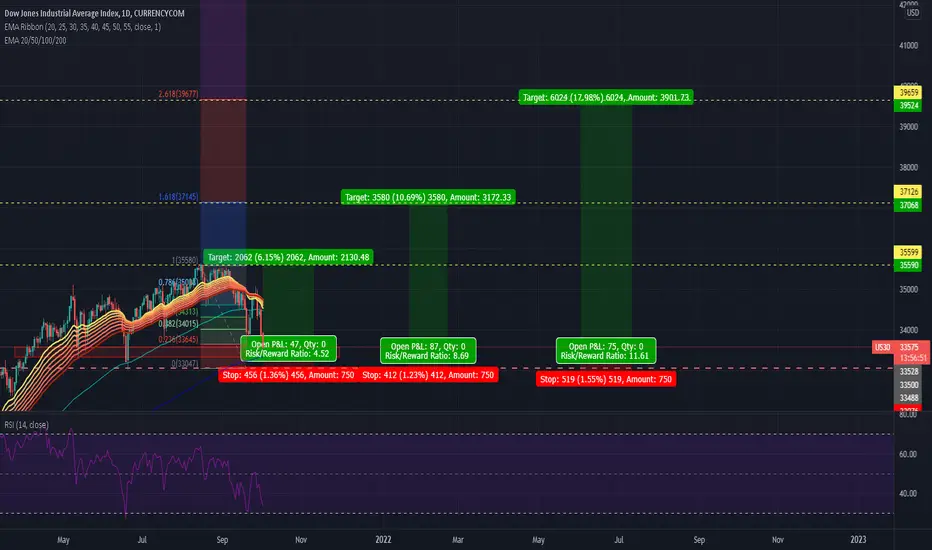
Dow Jones: Good Boy! 😎😎😎Who is a good boy? The Dow Jones is! Here, the top was perfectly hit and the following correction also evolves as planned – so far. We expect the course to drop below 34034 points and then attack new all-time highs.
Let’s gooooo!

APPLLooks like Apple has completed a 5W impulsive move up on HTF weekly chart and is probably going into another ABC correction that keeps the price flat to down until some catalyst create the next pattern

DJI - BEGINNING OF THE END? - CryptoManiac101DJI / US DOLLAR OVERVIEW
Every time I've heard someone mention DJI and the so called 'upcoming crash', it almost sounds too repetitive and at the end of that same week you'd see DJI, DOW climb higher and higher to everyone's dismay. Well, we might finally be nearing or entering the new 'phase' of the stock market and global economy as a whole where we will finally see the Black Swan event unravel.
Stay tuned!
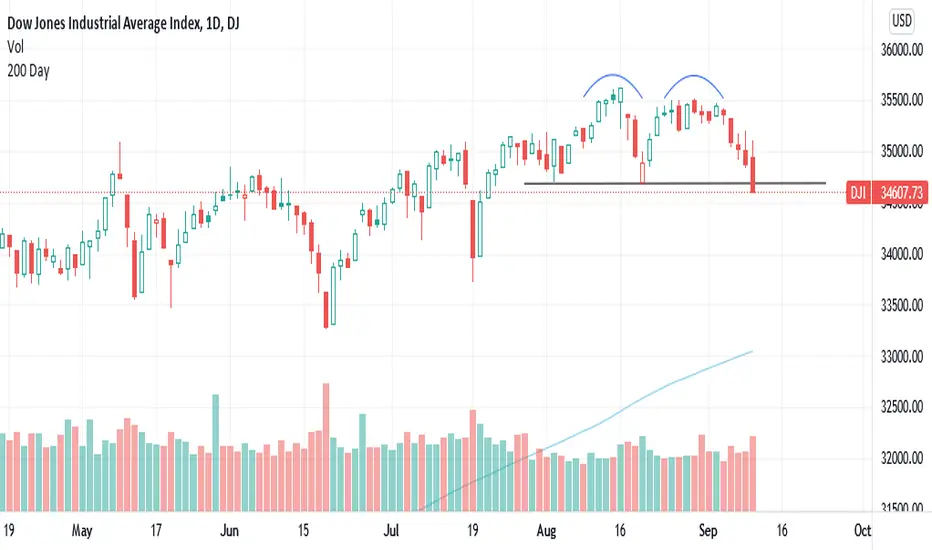
End Of The Bull Run?This week the US had a Jobs Report that showed slower than expected growth, which has led to a bearish week in the stock market. The DJI has formed a double top which has broken to the down side. Could this reversal pattern play out and bring about a bear market?
Dow Jones Danger Zone - Jan 2022Similar to my SPX500 idea, I think the fractal here looks remarkably similar to price action and we could be approaching the top in the DJIA. Suggested date

Down Jones Industrial Average is 50% @ a trough or Down for one!Since Covid's Low 28 signals !!!
Volume Weighted Average Price (VWAP) is a technical analysis tool used to measure the average price weighted by volume. VWAP is typically used with intraday charts as a way to determine the general direction of intraday prices. VWAP is similar to a moving average in that when price is above VWAP, prices are rising and when price is below VWAP, prices are falling. VWAP is primarily used by technical analysts to identify market trends.

Dow: Aaaaand Action! 📽📽📽The Dow Jones has a hard time pushing for an offensive to overcome the resistance at 35547 points. However, sooner or later we see the course moving above that resistance and gradually build up new all-time highs until the area around 37607 points is reached.
Good times coming!


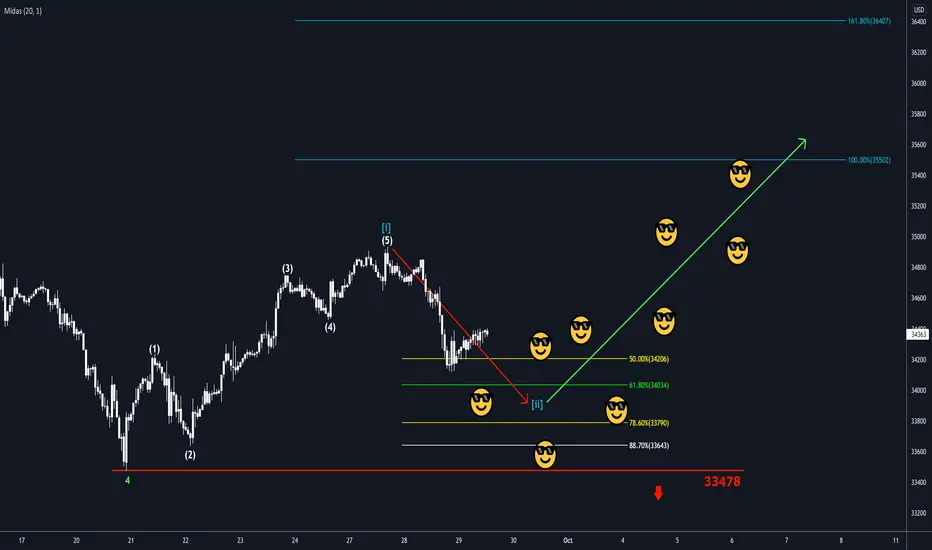
DJI - RETRACEMENT BEFORE GOING UP AGAIN !Accumulation is happening .
It would be a good apportunity for DJI lover
