DODO/USDT Approaching Major Breakout? End of a Long Downtrend?📊 In-Depth Analysis of DODO/USDT (1D Chart)
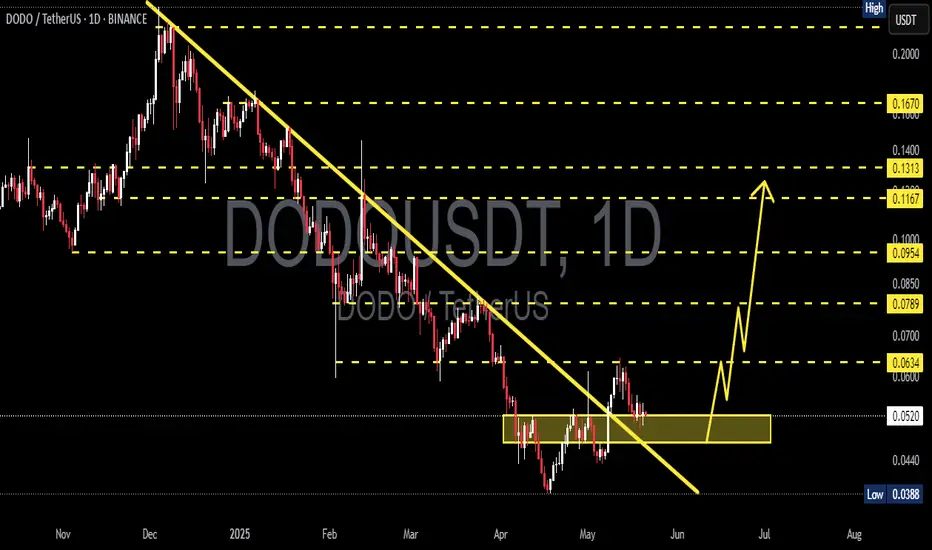
The DODO/USDT pair remains in a medium-to-long-term downtrend since late 2024. However, the current price action shows early signs of a potential reversal.
📐 Pattern and Structure
Downtrend Resistance Line: The descending yellow trendline from the December 2024 peak continues to act as major resistance. Price is now testing this line.
Key Support Zone: The region around $0.0314 – $0.0384 is a strong support area, proven by multiple bounce attempts.
Layered Resistance Zones:
$0.0454
$0.0512
$0.0606
$0.0787
$0.1169
Major high at $0.2219
🟢 Bullish Scenario
If price breaks above the descending trendline, it could signal:
1. A potential short-term trend reversal.
2. First upside targets lie around $0.0454 and $0.0512.
3. With strong volume, further upside to $0.0606 and $0.0787 is possible.
Bullish Confirmation: A breakout candle above the trendline with strong volume and a successful retest.
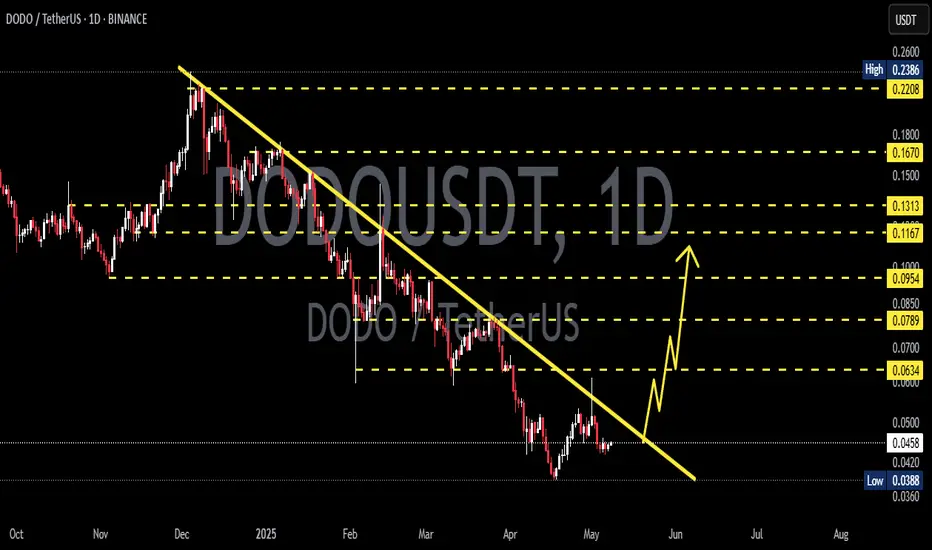
🔴 Bearish Scenario
If the price gets rejected at the trendline:
1. Price could revisit the critical $0.0314 support.
2. A breakdown below $0.0314 would likely trigger a new lower low, extending the downtrend.
3. Minimal support exists below this level, increasing downside risk.
📌 Pattern Summary
The structure shows a classic descending trendline dominating the market.
The price is consolidating and forming a potential accumulation base.
A confirmed breakout would likely shift the overall momentum.
🧠 Strategy & Risk Management
Aggressive Entry: Buy on breakout + successful retest of trendline.
Conservative Entry: Wait for confirmation above $0.0512 for safer reversal confirmation.
Stop-loss: Below $0.0314, the critical support zone.
#DODOUSDT #CryptoBreakout #TechnicalAnalysis #AltcoinReversal #TrendlineBreak #CryptoChart #CryptoSignals #DODOAnalysis #BullishBreakout
Dodousdtbuy
DODOUSDT 1D UpdateDODO ~ 1D Update
#DODO Buy gradually from here if you still have confidence in this coin with a short term target of at least 15%+ from here.
DODOUSDT 1D Analysis DODO ~ 1D Analysis
#DODO Buy after successfully breaking through this resistance line with a short-term target of at least 10%+.
DODOUSDT 1WDODO ~ 1W Analysis
#DODO This is a very good support for now, buy if you still have a Conviction on this Coin, the target is 20%+.

DODOUSDT 1WDODO ~ 1W
#DODO If you still have Conviction on the coin,. Buy in stages from here with a minimum target of 20%++

DODOUSDT Trade Idea. I like the Odds of this !💲💲💲💲💲
The candles on this ticker is always crazy !
OBV Moves signalling big positions, RSI is in an OKAY place.
#DODOArmy, here we go. 🚀
1:7 Risk to Reward, Reduce at TP's, manage your risk and exposure.
As always, Stay Safe and DYOR.
#TheHopinionist

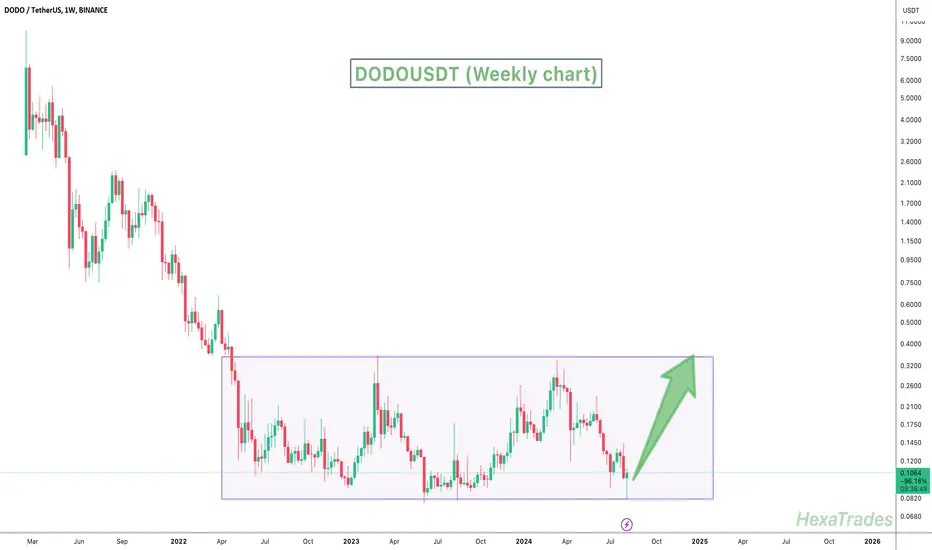
DODOUSDT Rectangle PatternDODOUSDT Technical analysis update
DODO's price has been trading within a rectangle pattern for the last 840 days and price has now dropped again to the box's support level. we can expect a bullish move from the current rectangle support level.
Next Target is $0.35
Stop Loss: $0.078
Regards
Hexa
DODO updated price chartAs you can see DODO has popped out of its falling vedge and there was bullish divergence formation on RSI on the daily timeframe.
What you think? Share your comments here below.
#DYOR

DODO bullishWe broke trend so i think we will see big pumps !! Indicators bullish too :-) Have a nice day

#DODO/USDT BUY/LONG CALL Lying above strong demand zone.#DODO/USDT BUY/LONG CALL
Lying above strong demand zone. EMA'S are also acting as a support. MACD crossover is showing bullish momentum. It will pump hard from here
Targets: $ 1.05 - 1.2 - 1.35 - 1.55
Stop if 1D close below $ 0.75
By @cryptoAXEN

DODOhey traders, there is dodo, we waited it for a long time so, we need a close above the blue line for 1D bar to get the green lines (short term's targets)
the yellow lines (long term's targets) and the stop loss is a close under the red line for 1D bar
.
trade carefully guys and don't forget the risk management.
.
.
.
.
.
.
.

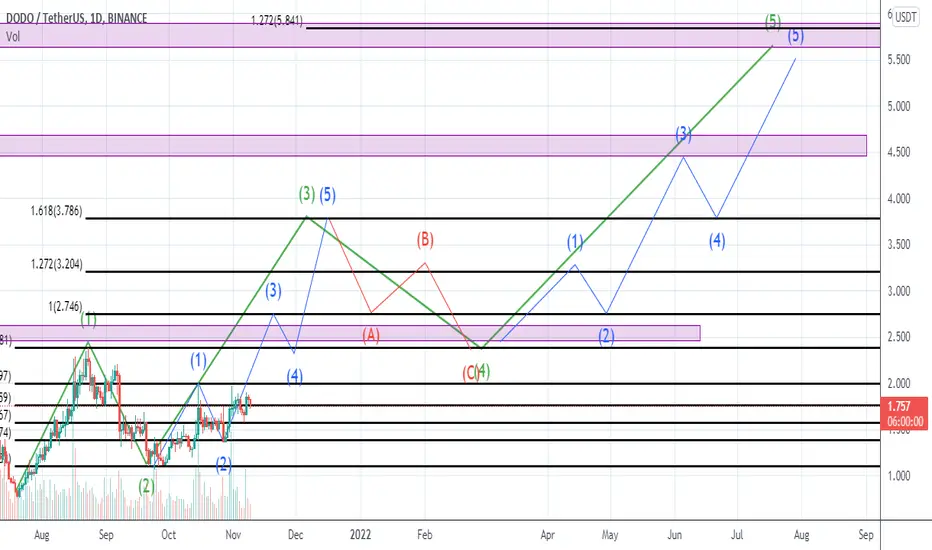
Elliott wave of DODO Green lines are the main waves
The blue lines of the waves are a subset of the motive
The red lines are corrective waves