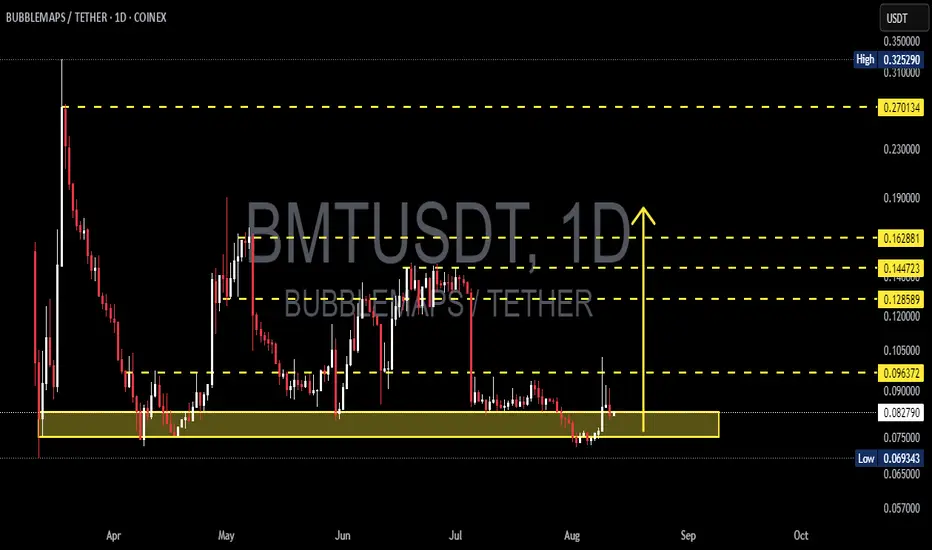
BMT/USDT – Major Rebound Potential from Accumulation Zone?🔍 Overview
BMT/USDT is currently trading at a critical support zone after a prolonged downtrend from the local peak at 0.32529. The 0.075 – 0.083 range, highlighted in yellow, has acted as a strong price defense area from March to August 2025.
The structure indicates a potential reversal pattern if the price can break above key resistance levels.
---
📈 Pattern & Technical Structure
Main Pattern: Potential Double Bottom or Accumulation Base on the daily chart.
Key Support:
Accumulation zone: 0.07500 – 0.08277
Final support: 0.06934 (lowest price of the year)
Layered Resistance Levels:
R1: 0.09637 → First psychological resistance
R2: 0.12859 → Short-term profit-taking area
R3: 0.14472 → Mid-term resistance
R4: 0.16288 → Major resistance before a strong rally
R5: 0.27013 → Long-term bullish target
---
🚀 Bullish Scenario
If the price breaks and sustains above 0.09637 with significant volume:
Short-term target: 0.12859 (+55% from current price)
Mid-term target: 0.14472 – 0.16288 (+74% to +96%)
Long-term major breakout target: 0.27013 (+226%)
Additional Confirmation:
RSI climbs above 50 and continues to strengthen
MACD forms a golden cross
Gradual increase in buying volume
---
⚠️ Bearish Scenario
If the price fails to hold above 0.075 and breaks 0.06934:
Potential downside targets:
S1: 0.06500 (-21%)
S2: 0.05700 (-31%)
Additional Confirmation:
Surge in selling volume
Daily candlestick closes below 0.06934
RSI breakdown below 40
---
🎯 Strategy & Risk Management
Buy at Support Strategy:
Entry at 0.082 – 0.083, SL below 0.06934, Target 0.12859 → Risk:Reward ± 3.4
Breakout Buy Strategy:
Entry after daily close above 0.09637, SL below 0.082, Target 0.14472 → Risk:Reward ± 2.24
---
📌 Conclusion
BMT/USDT is at a make-or-break zone: a successful breakout could trigger a strong rally, while a breakdown would extend the bearish trend. This is a decision point for swing and position traders to monitor closely.
#BMTUSDT #CryptoAnalysis #Altcoins #TechnicalAnalysis #PriceAction #Crypto #BreakoutTrading #SupportResistance #CryptoSignal #AltcoinSeason
DOGE-1
DOGE RALLYDoge coin is starting to make a rally and as it is in a broadening wedge, the technical top for that would be $1.35

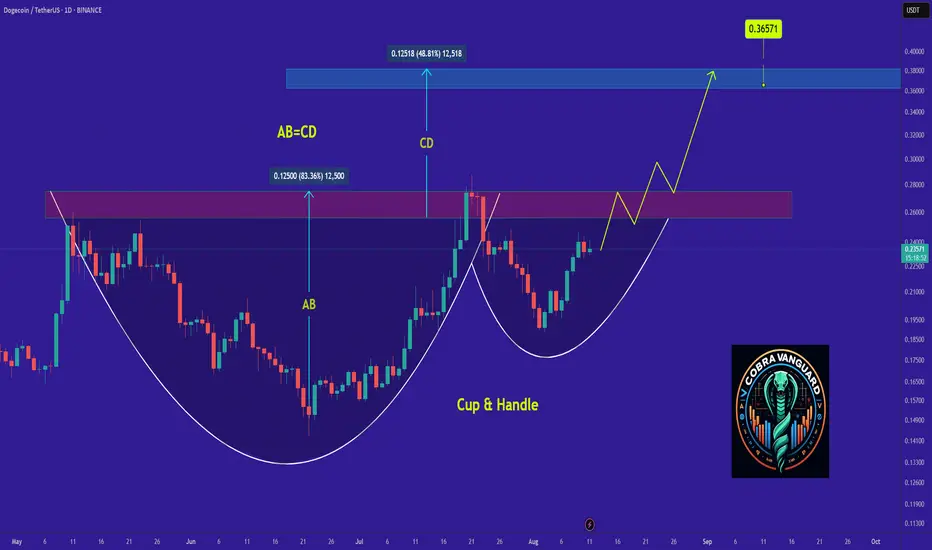
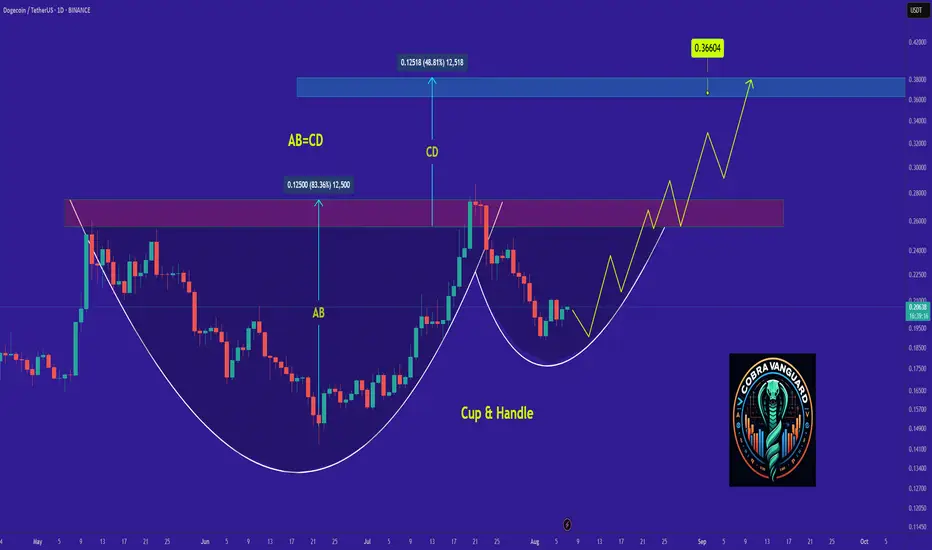
DOGE's Situation, A Comprehensive Analysis !!!It appears that the price is forming a cup and handle pattern, and if this occurs, it could push the price above $0.33.
Best regards CobraVanguard.💚
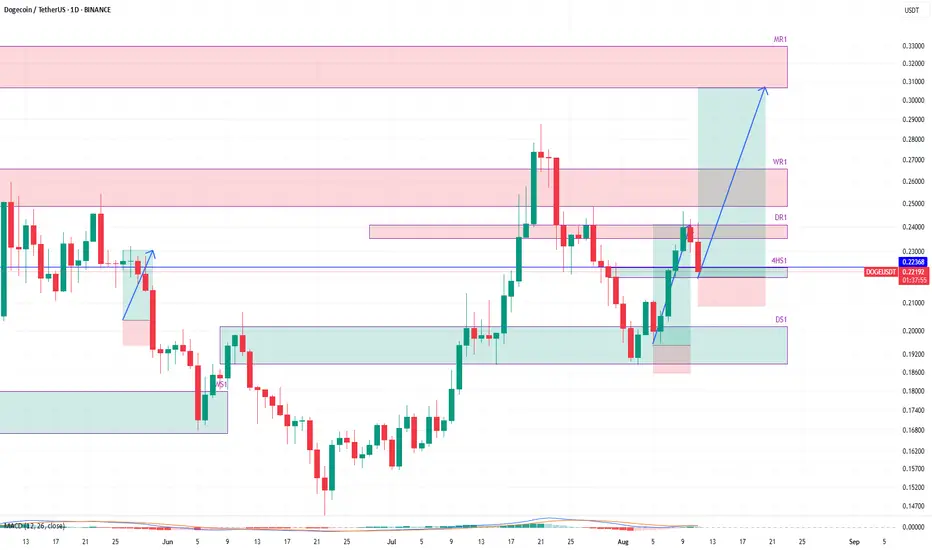
DOGEUSDT likely to head towards 0.30 to 0.33#DOGE #DOGEUSD #DOGEUSDT CRYPTOCAP:DOGE
After we closed our long trade at daily resistance DR1, the price started to pull back down as per our expectation.
This pullwas was expected by us since the price had hit the daily resistance.
Now the price has come to the 4h support zone 4HS1.
This zone is good for the price to bounce.
It is likely that the price will bounce here and resume its upward journey.
Therefore, this is a long opportunity here.
This time target is way beyond our last trade target.
I expect that this bounce will bring the price to monthly resistance MR1.
MR1 zone is around 0.30 - 0.33.
This is high R:R trade since the stop loss is very limited 5% but the profit target is huge and close to 40%.
Lets try this trade. We will keep monitoring the price action.
If any update is required, I will keep sharing here.
What do you think about this trade and the expected price action?
Would love to hear your thoughts. Share your view in comments.
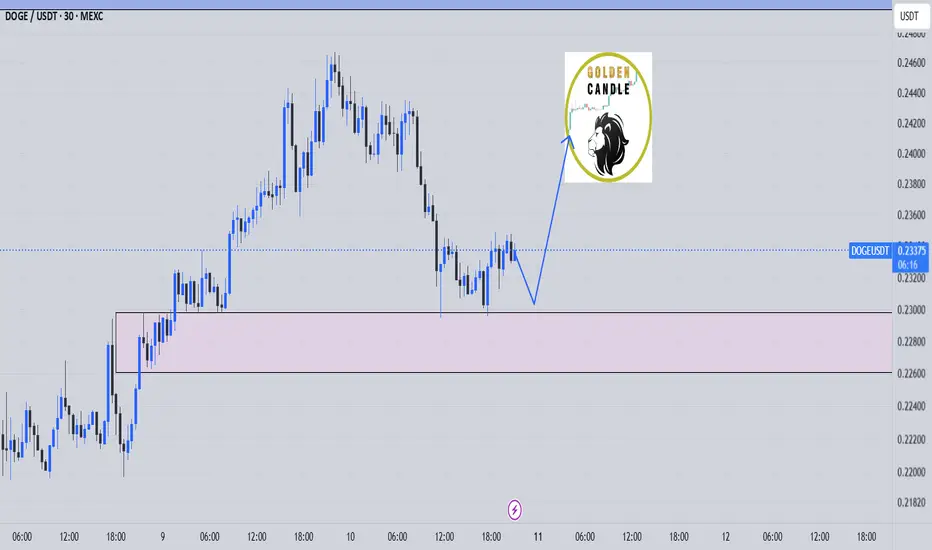
doge buy midterm"🌟 Welcome to Golden Candle! 🌟
We're a team of 📈 passionate traders 📉 who love sharing our 🔍 technical analysis insights 🔎 with the TradingView community. 🌎
Our goal is to provide 💡 valuable perspectives 💡 on market trends and patterns, but 🚫 please note that our analyses are not intended as buy or sell recommendations. 🚫
Instead, they reflect our own 💭 personal attitudes and thoughts. 💭
Follow along and 📚 learn 📚 from our analyses! 📊💡"
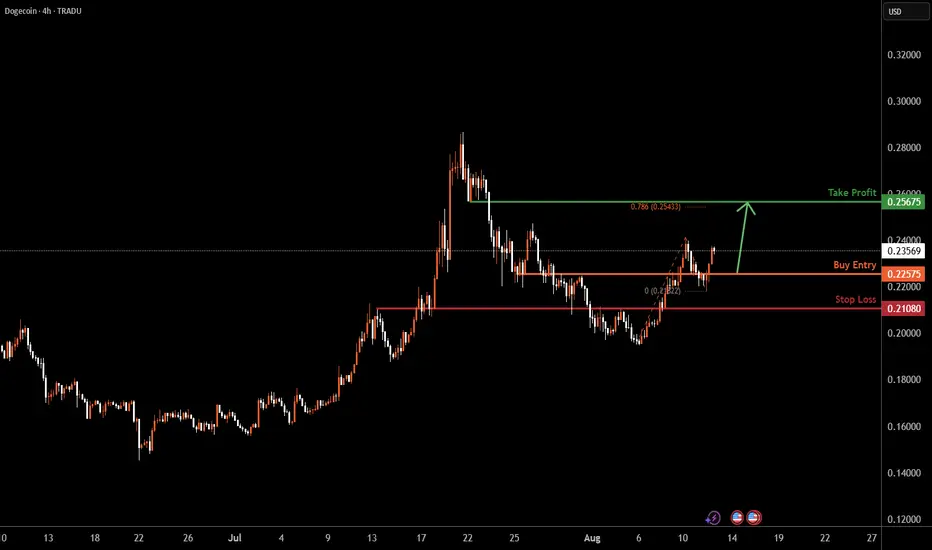
DOGEUSD H4 | Bullish riseBased on the H4 chart analysis, we can see that the price has bounced off the buy entry and could potentially rise from this level to the take profit.
Buy entry is at 0.2257, which is a pullback support.
Stop loss is at 0.2108, which is an overlap support.
Take profit is at 0.2567, which is a pullback resistance that aligns with the 78.6% Fibonacci projection.
High Risk Investment Warning
Trading Forex/CFDs on margin carries a high level of risk and may not be suitable for all investors. Leverage can work against you.
Stratos Markets Limited (tradu.com ):
CFDs are complex instruments and come with a high risk of losing money rapidly due to leverage. 65% of retail investor accounts lose money when trading CFDs with this provider. You should consider whether you understand how CFDs work and whether you can afford to take the high risk of losing your money.
Stratos Europe Ltd tradu.com ):
CFDs are complex instruments and come with a high risk of losing money rapidly due to leverage. 66% of retail investor accounts lose money when trading CFDs with this provider. You should consider whether you understand how CFDs work and whether you can afford to take the high risk of losing your money.
Stratos Global LLC (tradu.com ):
Losses can exceed deposits.
Please be advised that the information presented on TradingView is provided to Tradu (‘Company’, ‘we’) by a third-party provider (‘TFA Global Pte Ltd’). Please be reminded that you are solely responsible for the trading decisions on your account. There is a very high degree of risk involved in trading. Any information and/or content is intended entirely for research, educational and informational purposes only and does not constitute investment or consultation advice or investment strategy. The information is not tailored to the investment needs of any specific person and therefore does not involve a consideration of any of the investment objectives, financial situation or needs of any viewer that may receive it. Kindly also note that past performance is not a reliable indicator of future results. Actual results may differ materially from those anticipated in forward-looking or past performance statements. We assume no liability as to the accuracy or completeness of any of the information and/or content provided herein and the Company cannot be held responsible for any omission, mistake nor for any loss or damage including without limitation to any loss of profit which may arise from reliance on any information supplied by TFA Global Pte Ltd.
The speaker(s) is neither an employee, agent nor representative of Tradu and is therefore acting independently. The opinions given are their own, constitute general market commentary, and do not constitute the opinion or advice of Tradu or any form of personal or investment advice. Tradu neither endorses nor guarantees offerings of third-party speakers, nor is Tradu responsible for the content, veracity or opinions of third-party speakers, presenters or participants.
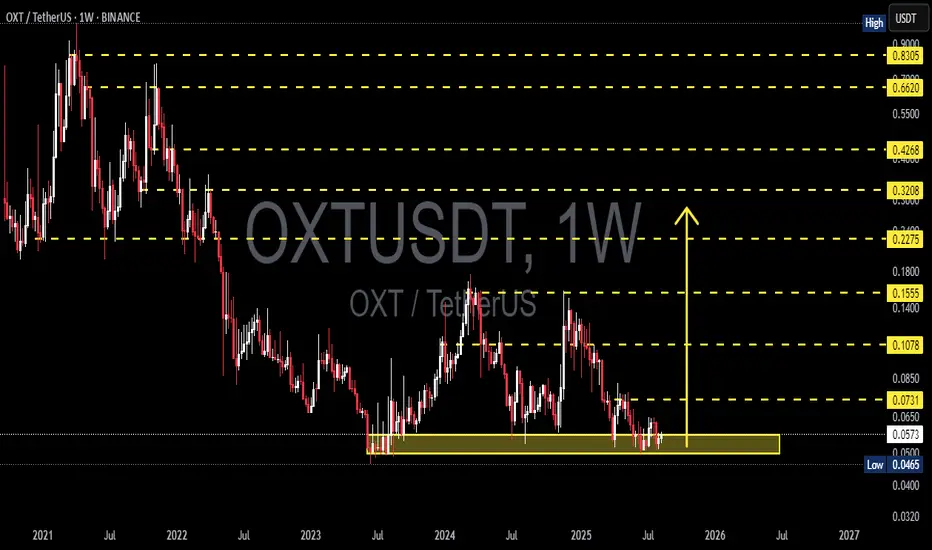
OXT/USDT — Accumulation Before a Breakout or Further Decline?📌 Overview
OXT/USDT is currently at a critical stage on the weekly chart, consolidating within the strong demand zone at 0.0465–0.0650 (yellow box) that has been tested multiple times since mid-2023. This area acts as the last line of defense for buyers before price enters uncharted multi-year lows. The macro structure remains in a long-term downtrend since the 2021 peak, but the base formation in this low zone opens up a significant opportunity for a medium-term relief rally if a breakout is confirmed.
---
1. Key Technical Levels
Main Support / Demand Zone (yellow box): 0.0465 – 0.0650
→ This is the “floor” that has been holding price for nearly two years.
Minor Support: 0.0500 (psychological & repeated reaction level)
Layered Resistance Levels:
0.0731 → 0.1078 → 0.1555 → 0.2275 → 0.3208 → 0.4268 → 0.6620 → 0.8305
---
2. Structure & Patterns
Macro Trend: A sequence of lower highs since 2021 → indicating the primary trend is still bearish.
Potential Pattern:
Base / Accumulation Range near multi-year lows → resembles an early rounding bottom, but not confirmed yet.
Possible spring pattern: brief drop below main support followed by a sharp reclaim.
Volume (not shown here): Often decreases near the bottom range, signaling sellers may be losing strength.
---
3. Bullish Scenario (Relief Rally Potential)
💡 Conservative confirmation:
Break & weekly close above 0.0731.
Step-by-step targets: 0.1078 → 0.1555 → 0.2275.
0.1078 is the key breakout pivot; clearing it could trigger large-scale short covering.
⚡ Aggressive setup:
False breakdown below 0.0465 (spring) followed by a quick weekly close back above 0.050–0.055.
Initial target: 0.0650, then 0.0731 if momentum continues.
Best suited for swing traders aiming for high risk/reward.
---
4. Bearish Scenario (Trend Continuation)
Clean weekly close below 0.0465 + failed retest (0.0465 turning into resistance).
Downside targets: 0.0400 then 0.0320.
Failure to break 0.0731 and forming another lower high would also indicate sellers remain in control.
---
5. Strategic Notes
The 0.0465–0.0650 zone is the final battleground between long-term buyers and sellers controlling the macro trend.
Patience is required on this 1W timeframe; valid breakouts may take several weekly candles to confirm.
Aggressive traders may consider entries within the yellow box with tight stops below 0.0465, while conservative traders can wait for a confirmed breakout above key resistance.
---
6. Key Takeaway
As long as price holds inside or above the yellow box, relief rally potential remains alive.
Breaking 0.0731 will be the first major signal of sentiment shift.
A breakdown below 0.0465 opens a new chapter in the long-term downtrend.
#OXT #OXTUSDT #OrchidProtocol #CryptoAnalysis #PriceAction #WeeklyChart #SwingTrade #SupportResistance #BreakoutSetup #CryptoTrading
DOGEUSD H4 | Bearish reversalBased on H4 chart analysis, we could see the price rising towards the sell entry and could reverse to the take profit.
Buy entry is at 0.25663, whic is a pullback resistance that is slightly above the 61.8% Fibonacci retracement.
Stop loss is at 0.28642, which is a multi swing high resistance.
Take profit is at 0.20822, which is a pullback support.
High Risk Investment Warning
Trading Forex/CFDs on margin carries a high level of risk and may not be suitable for all investors. Leverage can work against you.
Stratos Markets Limited (tradu.com ):
CFDs are complex instruments and come with a high risk of losing money rapidly due to leverage. 65% of retail investor accounts lose money when trading CFDs with this provider. You should consider whether you understand how CFDs work and whether you can afford to take the high risk of losing your money.
Stratos Europe Ltd (tradu.com ):
CFDs are complex instruments and come with a high risk of losing money rapidly due to leverage. 66% of retail investor accounts lose money when trading CFDs with this provider. You should consider whether you understand how CFDs work and whether you can afford to take the high risk of losing your money.
Stratos Global LLC (tradu.com ):
Losses can exceed deposits.
Please be advised that the information presented on TradingView is provided to Tradu (‘Company’, ‘we’) by a third-party provider (‘TFA Global Pte Ltd’). Please be reminded that you are solely responsible for the trading decisions on your account. There is a very high degree of risk involved in trading. Any information and/or content is intended entirely for research, educational and informational purposes only and does not constitute investment or consultation advice or investment strategy. The information is not tailored to the investment needs of any specific person and therefore does not involve a consideration of any of the investment objectives, financial situation or needs of any viewer that may receive it. Kindly also note that past performance is not a reliable indicator of future results. Actual results may differ materially from those anticipated in forward-looking or past performance statements. We assume no liability as to the accuracy or completeness of any of the information and/or content provided herein and the Company cannot be held responsible for any omission, mistake nor for any loss or damage including without limitation to any loss of profit which may arise from reliance on any information supplied by TFA Global Pte Ltd.
The speaker(s) is neither an employee, agent nor representative of Tradu and is therefore acting independently. The opinions given are their own, constitute general market commentary, and do not constitute the opinion or advice of Tradu or any form of personal or investment advice. Tradu neither endorses nor guarantees offerings of third-party speakers, nor is Tradu responsible for the content, veracity or opinions of third-party speakers, presenters or participants.

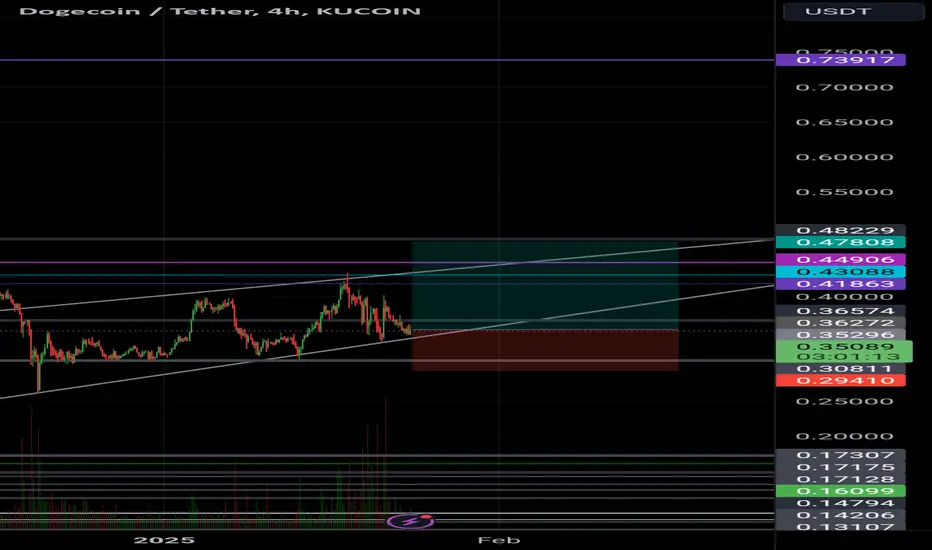
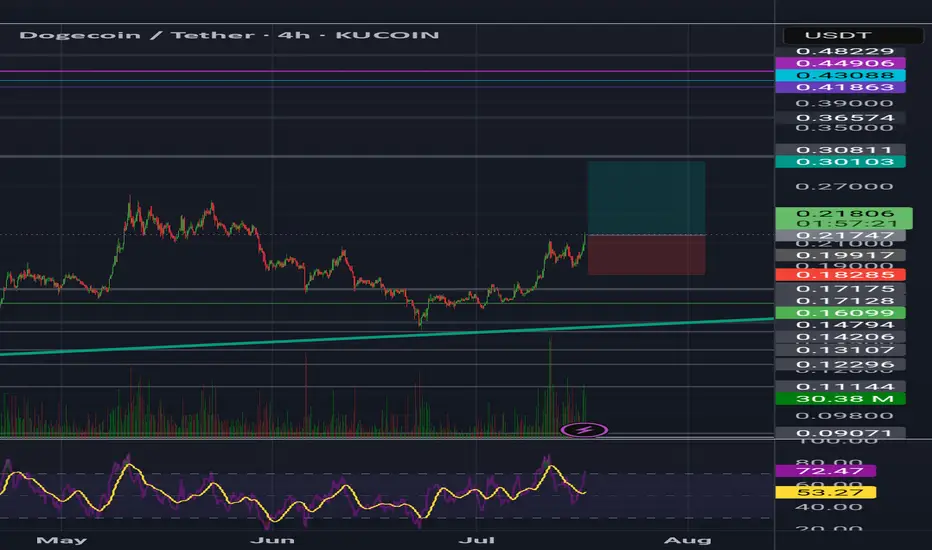
DogecoinDoge usdt Daily analysis
Time frame 4hours
Risk rewards ratio >2
Dogecoin always has a good volume in the market
Investors know that Musk is interested in Dogecoin, and this is a positive point for this currency. The currency was created as a joke but found its place and now Doge has drawn a clear path for itself and for enthusiasts.
The price is now fluctuating in an ascending triangle. It's very dangerous if market crashed down but I think sentiment of market is positive after Trump.
Of course we must be careful
So my target is not dreamy
I am watching the market and waiting for suitable time to enter again for higher target on 0.73 $
doge buy midterm"🌟 Welcome to Golden Candle! 🌟
We're a team of 📈 passionate traders 📉 who love sharing our 🔍 technical analysis insights 🔎 with the TradingView community. 🌎
Our goal is to provide 💡 valuable perspectives 💡 on market trends and patterns, but 🚫 please note that our analyses are not intended as buy or sell recommendations. 🚫
Instead, they reflect our own 💭 personal attitudes and thoughts. 💭
Follow along and 📚 learn 📚 from our analyses! 📊💡"
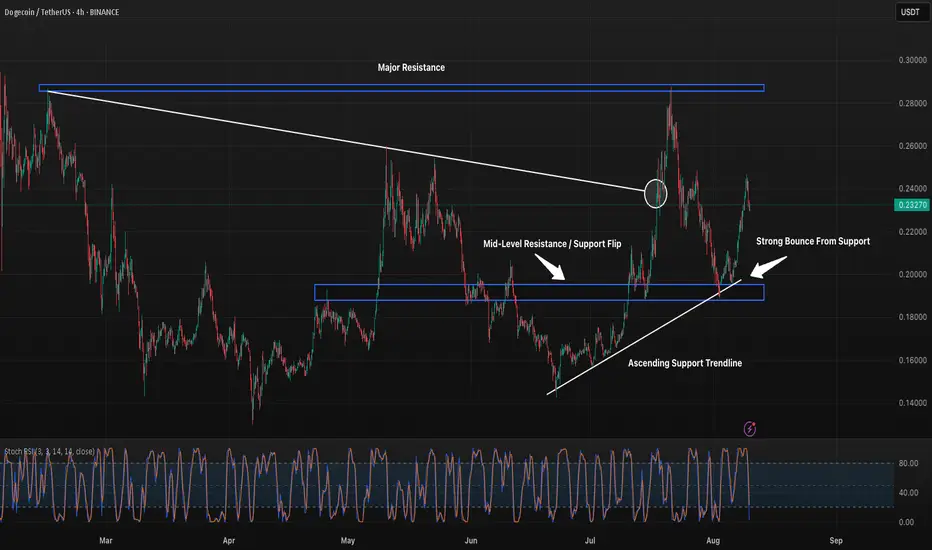
DOGE 4H Rebounds Toward Mid-Level ResistanceDOGE bounced sharply from the $0.19–$0.20 support zone and ascending trendline, pushing back toward the mid-level resistance. A clean breakout here could target the $0.29 major resistance, while failure to reclaim this zone could see price retesting the trendline for support.
DOGEUSDT heading towards 0.24 zone#DOGE #DOGEUSD #DOGEUSDT CRYPTOCAP:DOGE
This is where DOGEUSDT will bounce.
The price has tapped into the daily support DS1.
We see the reaction that there. However, the price may go deep into this support but not necessarily.
This condition presents a long opportunity on DOGEUSDT.
The price will bounce from DS1 and try another attempt at weekly resistance WR1.
The price may also struggle between 0.23 and 0.24 zone.
This may be an opportunity to load long term spot position since the price action is looking bullish for some upcoming months.
What do you think? Where do you see DOGEUSDT bounce and in upcoming month? Let me know in the comments.

Doge, a great profit until Christmas.Moving forward in the crypto market, Dogecoin will also have a great profit.
Don't forget to follow and boost to get amazing and profitable signals
Introduce me to your friends so we can all profit together
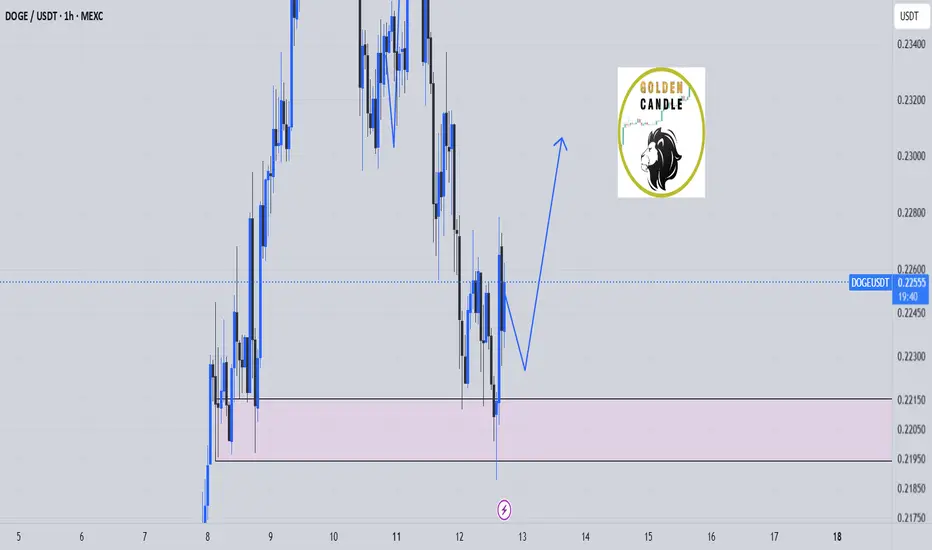
Doge...Is a 50% Pump Coming?Hello guys!
Trend Structure:
The price is moving within a broad ascending channel, with both upper and lower boundaries acting as dynamic resistance and support. The midline (dotted blue) appears to function as a short-term pivot zone.
Recent Movement:
After a mid-July decline from around $0.29, the price found support just above $0.17 and has since rallied sharply, now trading around $0.2367.
Projection Shown in Chart:
The drawn black curved arrow suggests a potential short-term pullback from the current levels before resuming the uptrend toward the $0.314 resistance, which corresponds to the upper boundary of the channel.
Key Levels:
Immediate resistance: $0.24 – $0.25 zone
Major resistance target: $0.314
Immediate support: Around $0.21 (midline of channel)
The outlook here is bullish, assuming that the midline support holds during any pullback. A break and close above $0.25 would strengthen the likelihood of a move toward $0.31.

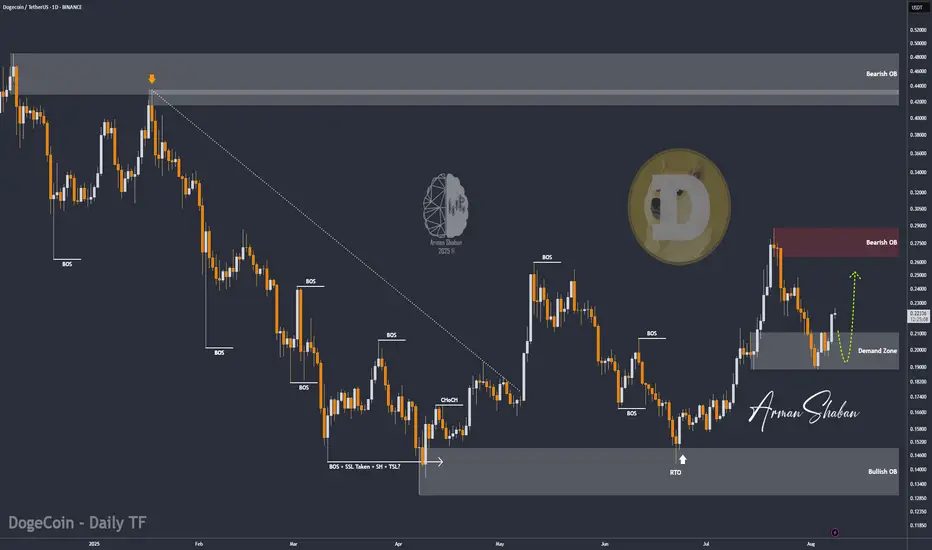
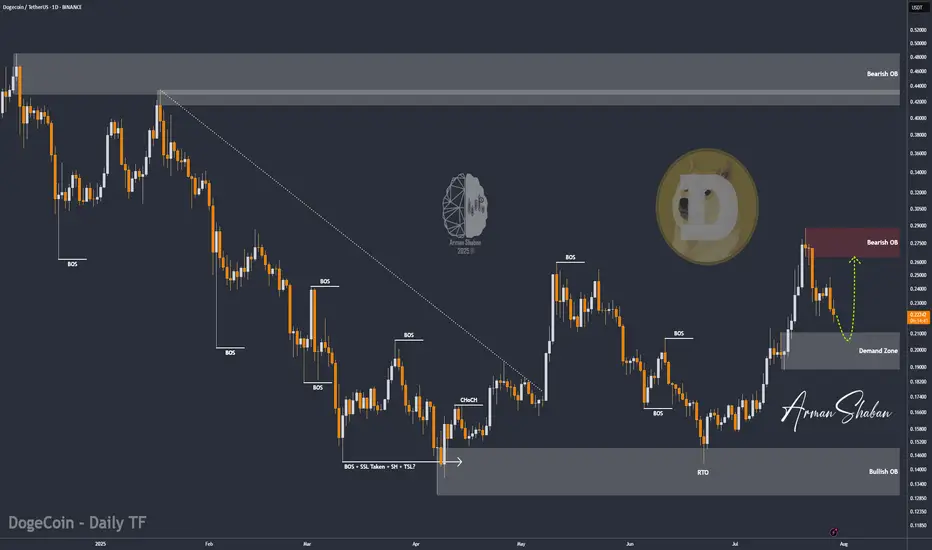
DOGE/USDT | DOGE Up 20% – Next Targets: $0.24, $0.287 & Beyond!By analyzing the Dogecoin chart on the daily timeframe, we can see that, as expected, the bullish reaction has continued, and DOGE is now trading around $0.226. This analysis has delivered over 20% returns so far. The next targets are $0.24, $0.287, $0.32, $0.41, and $0.70. Hope you’ve made the most of this move, and stay tuned for the upcoming updates!
Please support me with your likes and comments to motivate me to share more analysis with you and share your opinion about the possible trend of this chart with me !
Best Regards , Arman Shaban
DOGE: Golden Cross Incoming After 33% Pullback
This is DOGE on the Daily
This chart is screaming upside potential.
The move began with two higher lows off the 0.786 Fib level at \$0.15924. From there, price blasted through both the 50MA and 200MA straight into the 0.618 Fib at \$0.28336 — an 80% rally.
What followed was a healthy 33% correction, briefly pausing at the 0.5 Fib level (\$0.22135), which sits midway between the long-term 0.786 and 0.618 levels.
The dip stopped right at the 50MA, which once again acted as a springboard — sending price back above the 200MA, the BB center, and reclaiming the 0.5 Fib, which today is holding as support.
A golden cross is now imminent. The last time DOGE saw this setup was in early November 2024, which led to a 200% move.
In my opinion, today could offer a strong long opportunity — with a stop loss below the 0.5 Fib or even the 200MA, depending on your risk profile.
Always take profits and manage risk.
Interaction is welcome.

DOGE Breakout?After a 13 day rally and a 12 day pullback, could DOGE be breaking out and confirming a new 4H trading range?
After a bounce off the bullish orderblock DOGE has broken out of the diagonal downtrend, then pulled back to retest the previous diagonal resistance level as new support. This is a textbook breakout play & retest but this doesn't 100% guarantee the breakout will be successful. Should it be a successful breakout Local Resistance is the first clear level of interest for the bears to fight back.
This type of setup does give a clear invalidation should price fall back into the downtrend with acceptance. A fakeout could also lead to a loss of the Major Support level, that would introduce a potential revisit of $0.166.

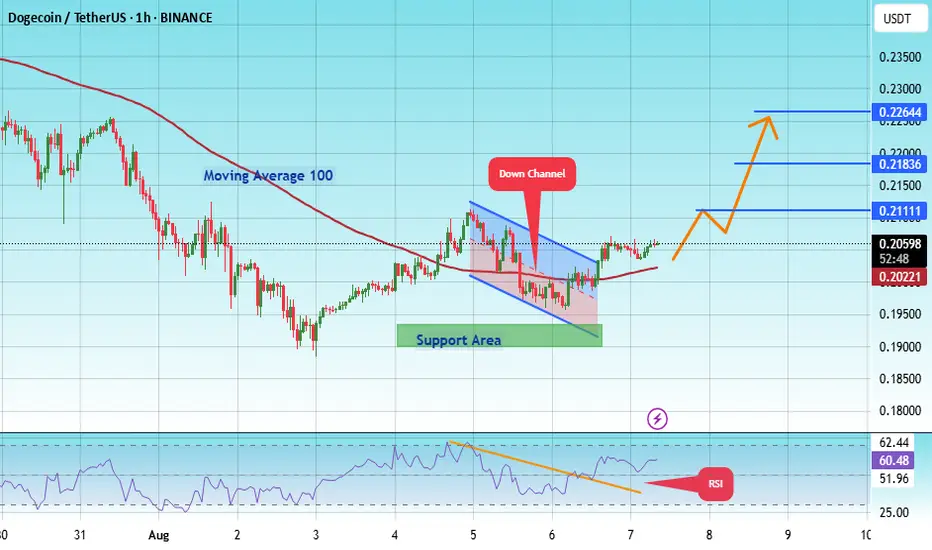
#DOGE/USDT | Eyes Bounce from Key Support !#DOGE
The price is moving within an ascending channel on the 1-hour frame, adhering well to it, and is on its way to breaking strongly upwards and retesting it.
We have support from the lower boundary of the ascending channel, at 0.1930.
We have a downtrend on the RSI indicator that is about to be broken and retested, supporting the upside.
There is a major support area in green at 0.1895, which represents a strong basis for the upside.
Don't forget a simple thing: ease and capital.
When you reach the first target, save some money and then change your stop-loss order to an entry order.
For inquiries, please leave a comment.
We have a trend to hold above the 100 Moving Average.
Entry price: 0.2060.
First target: 0.2111.
Second target: 0.2183.
Third target: 0.2264.
Don't forget a simple thing: ease and capital.
When you reach the first target, save some money and then change your stop-loss order to an entry order.
For inquiries, please leave a comment.
Thank you.
Do you think I'm joking ???It appears that the price is forming a cup and handle pattern, and if this occurs, it could push the price above $0.30.
Best regards CobraVanguard.💚
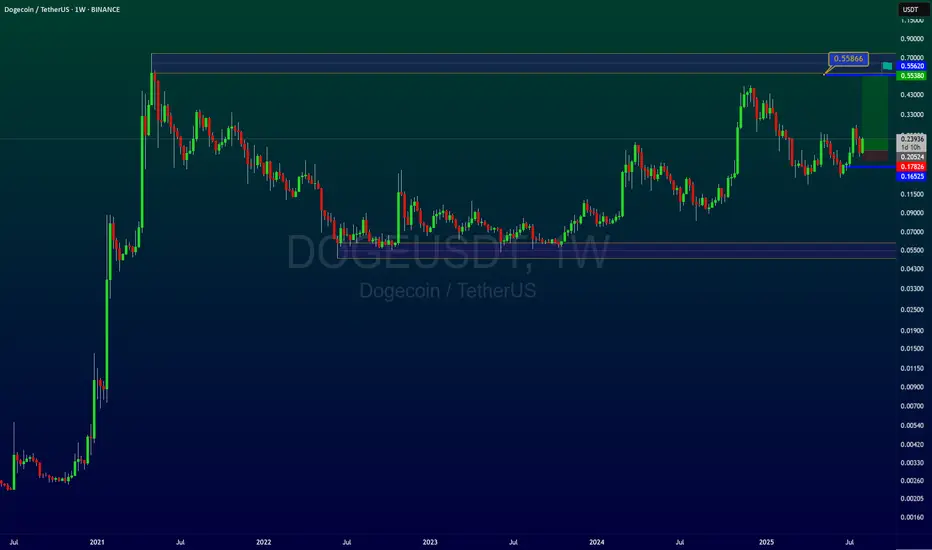
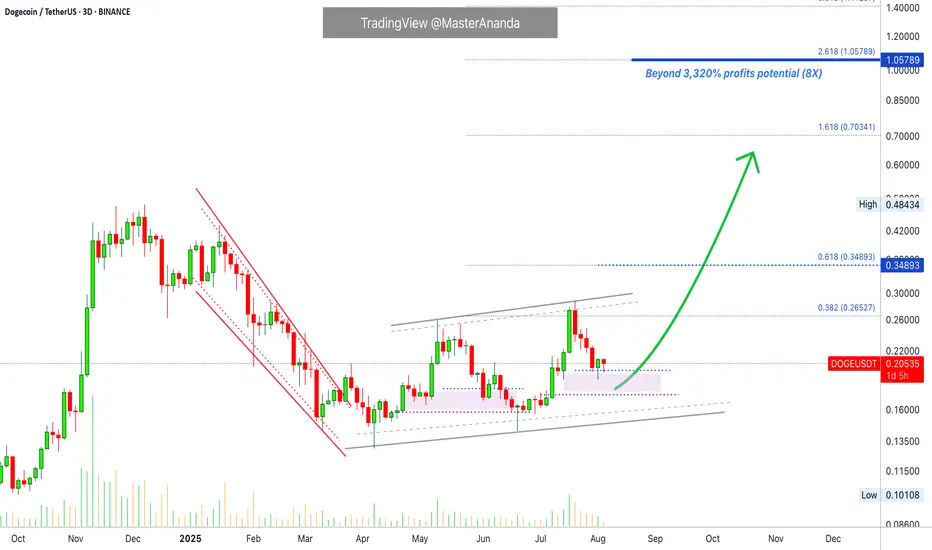
Dogecoin Turns Bullish · Leveraged Trade · 3320% Potential @8XThe support zone is the 0.618 - 0.786 Fib. retracement levels marked blue and purple on the chart. We can clearly see two hammers (candlestick patterns), last week and this week. We can see the higher lows but also the broader rising channel structure. We can also see the even bigger structure coming from the low in 2024. In short, a long-term bullish cycle unfolding right in front of our eyes... Dogecoin is going up.
I am approaching this pair for my people with high leverage. High leverage means high risk. At the same time, we also have a very high potential for reward. The last target goes beyond 3,000%.
You don't have to go for all the targets nor all the lev. You can use lower leverage for less risk, more stability and peace of mind. You can do 2-3X and this would be a safe trade setup. You can do 4-5X for mild risk but still a strong potential for reward. And finally, you can do 6-8X as an expert knowing that you can get liquidated in a flash. All money can be gone. But, if my timing is right, you can end up with a position so strong that regardless of what happens after the breakout, sell early or late, you will be happy with the results.
It is always tricky, but we continue to learn and improve. Here we can see what is possible. Knowing what is possible, planning, preparing and taking action in the right way, we can achieve our goals and quit our day-job.
Trading is no different to any other profession/work, it takes time, practice, patience and dedication. The only difference is that here when you get it right you are rewarded for the long haul. Once you learn how to trade, that is, learn to play the market at its own rhythm, you can collect as much money as you want. It is true, but it takes years of hard work.
Here we have Dogecoin again. Will it grow? Will it crash?
Time will tell, but my money is on prices going up.
My money, my rep, my trust.
Let's see... Let's wait and see.
Not all trades are meant to be won.
If you follow capital allocation and a good strategy, you are able to take in the losses that are inevitable and still win big at the end of the game.
Remember, it is not about winning the all; it is about winning big, it is about winning over and over; it is about creating the habit of winning and this habit will make all the time and effort we invest in this venture worth it. It is not about being right, it is about getting paid.
With the right mindset and a little bit of patience... We can do this!
Namaste.
DOGE/USDT | Eyes Bounce from Key Support – Next Targets Ahead!By analyzing the Dogecoin chart on the daily timeframe, we can see that after reaching the $0.29 area, the price entered a correction and is now trading around $0.22. If DOGE dips into the key support zone between $0.19–$0.21, we could expect a strong bullish reaction. The next potential targets are $0.287, $0.32, $0.41, and $0.70.
Please support me with your likes and comments to motivate me to share more analysis with you and share your opinion about the possible trend of this chart with me !
Best Regards , Arman Shaban
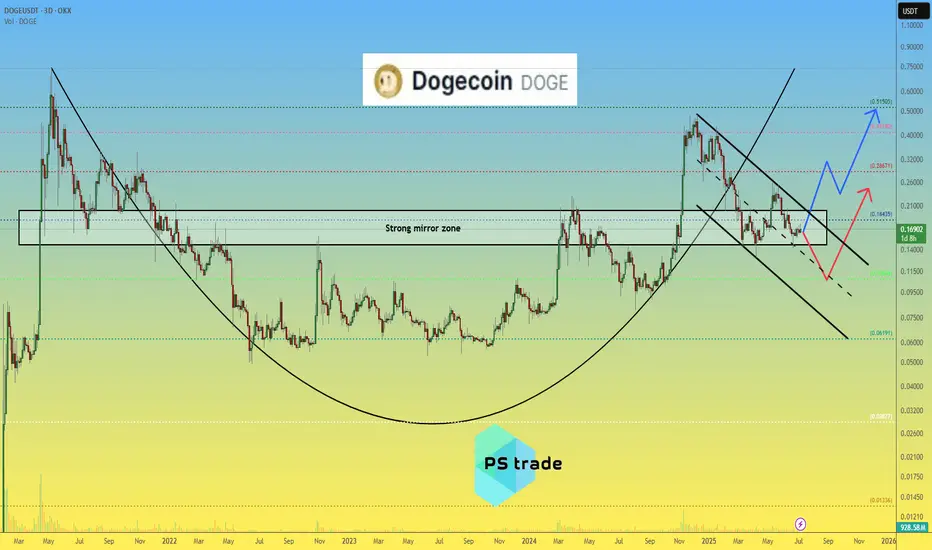
Dogecoin DOGE price analysisCRYPTOCAP:DOGE price is now in the middle of a strong mirror zone of $0.15-0.20
📈 It looks like the position is now accumulating, forming a "double bottom" and then, only a way for growth, to the highs in the region of $0.45-0.50
🐻 On the other hand, the scenario of another "leg" down fits perfectly into the TA canons. That is, it is very likely that if the price of OKX:DOGEUSDT drops below $0.15, then it is already fall to $0.10)
P.S.:
#Doge is an interesting asset, it is worth watching with one eye, and with the other eye, watch how the "battle" between Trump and Musk (who is the main influencer and "pumper" of #Dogecoin) will end.
💡 And then put the two pieces of information together and make a trading decision - "easy money" !)
_____________________
Did you like our analysis? Leave a comment, like, and follow to get more