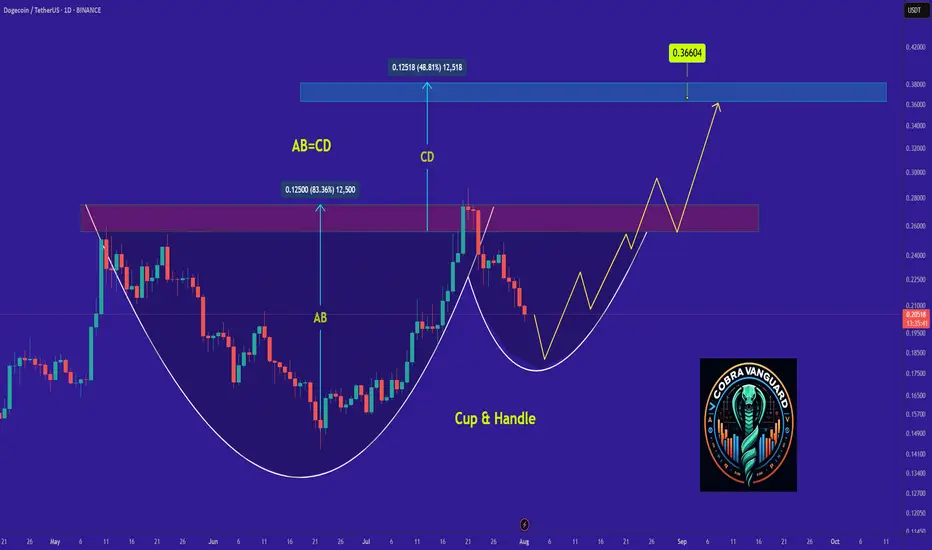
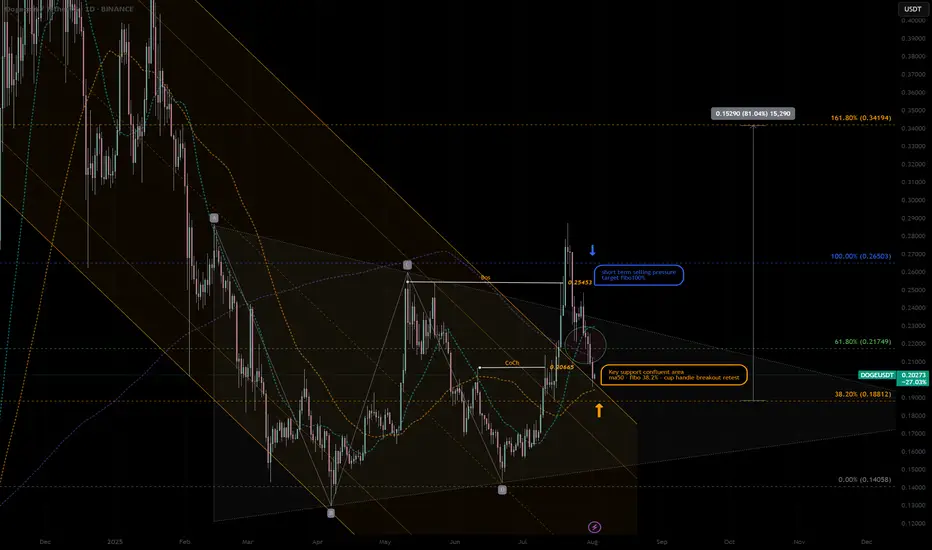
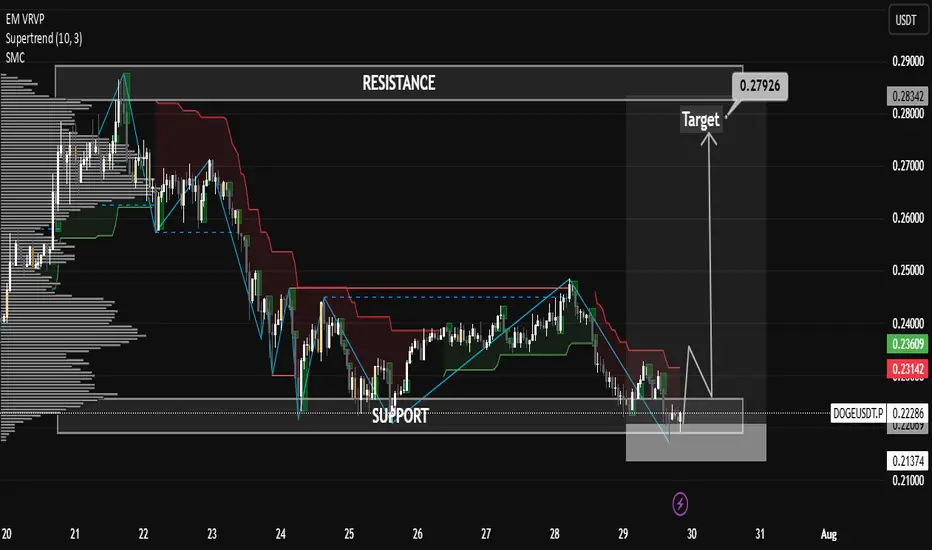
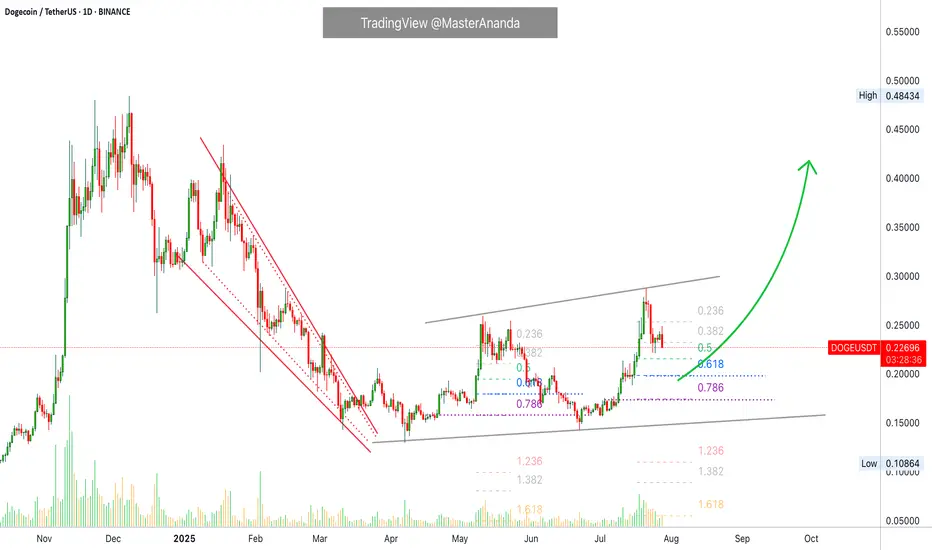
Why DOGE Remains Bullish and Its Next Potential Move !It appears that the price is forming a cup and handle pattern, and if this occurs, it could push the price above $0.30.
Best regards CobraVanguard.💚
Dogecoin
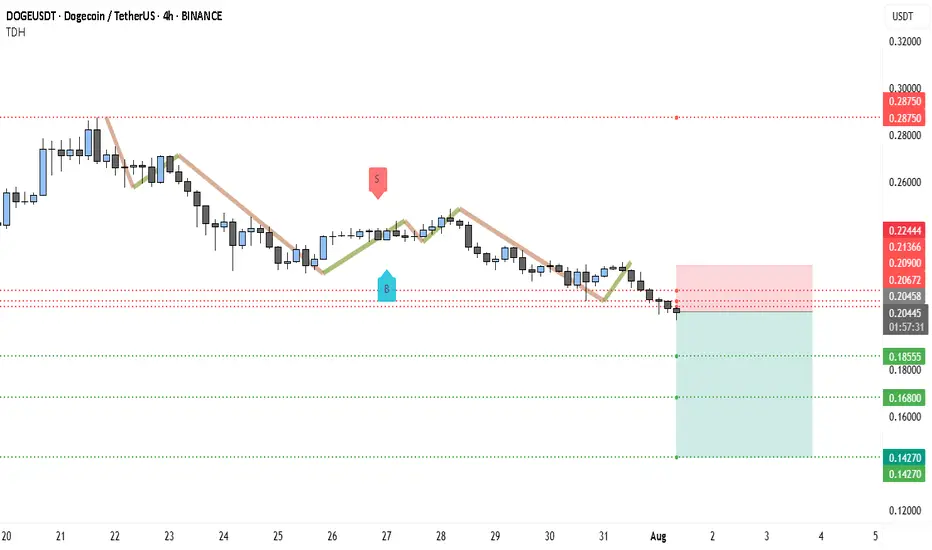
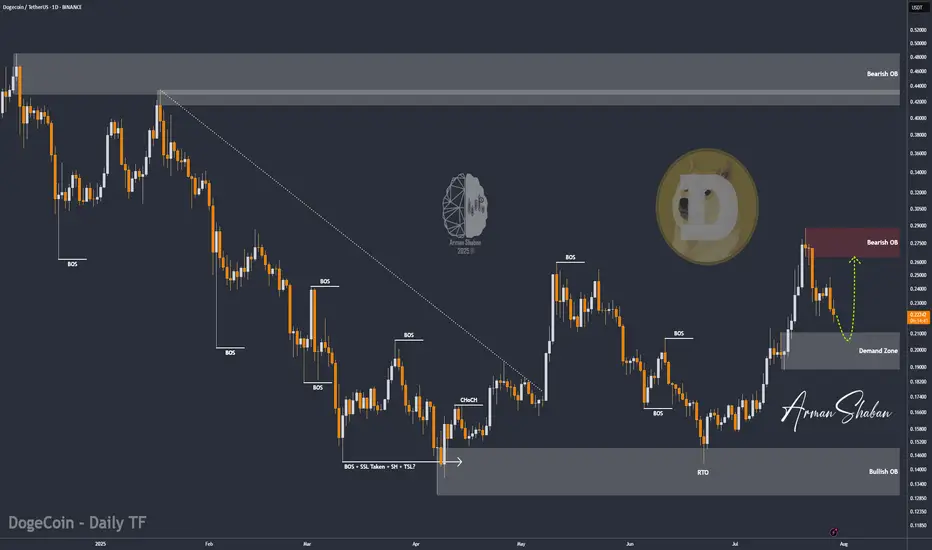
Bears Target $0.14 DOGE — Is the Trend Your Friend?DOGEUSDT has been in a clear downtrend since late July, printing consistent lower highs and lower lows. The current market structure shows sellers firmly in control, with every bullish bounce quickly fading. The recent rejection near $0.2244 and the inability to sustain above the $0.21 zone highlight persistent selling pressure.
At the moment, DOGE is hovering around $0.2043, just under a short-term resistance band between $0.2067 and $0.2090. This area has acted as a rejection point in the last few sessions, suggesting that unless bulls can break above it with strong volume, the path of least resistance remains downward. Below, the first major support sits at $0.1855. If that breaks, the selling could accelerate toward $0.1680, a level that aligns with a previous consolidation base from June. In an extended decline, $0.1427 comes into view as a long-term support level that previously acted as a strong demand zone.
The chart also shows an active short trade setup in play:
• Entry: $0.2043
• Stop-Loss: $0.2244
• Targets: TP1 at $0.1855, TP2 at $0.1680, and TP3 at $0.1427
From a risk-reward perspective, this setup remains attractive, especially if the price breaks below $0.1855. However, traders should watch for any bullish invalidation signs — a close above $0.2136 could challenge the short bias, while a sustained break above $0.2244 would signal a possible trend shift. Until then, the broader technical picture still favors the bears.
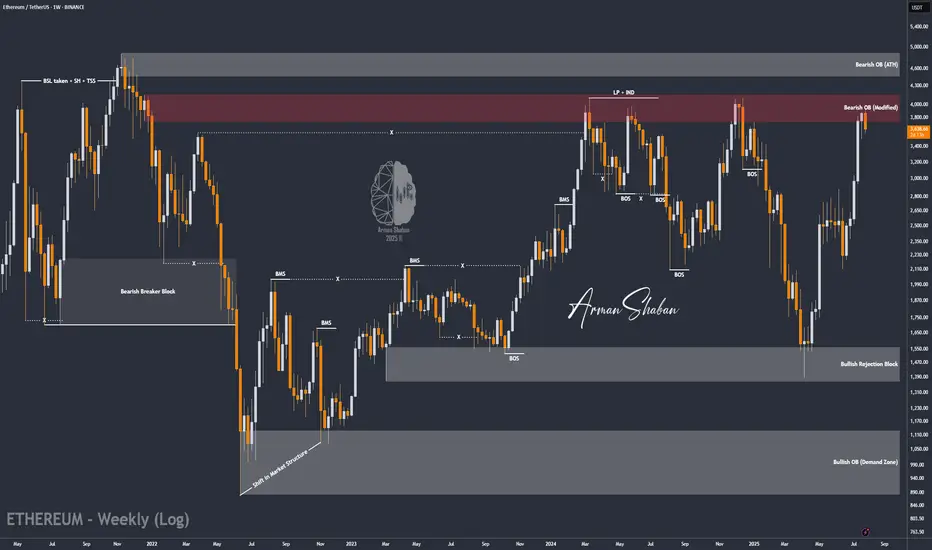
ETH/USDT | ETH Under Pressure – Watch $3500 Support!By analyzing the Ethereum chart on the weekly timeframe, we can see that after reaching the $3940 zone, ETH faced selling pressure and is now trading around $3540. If the price fails to hold the key $3500 support, a deeper decline is likely, with potential targets at $3040 first and possibly $2680 as the second bearish target.
Please support me with your likes and comments to motivate me to share more analysis with you and share your opinion about the possible trend of this chart with me !
Best Regards , Arman Shaban
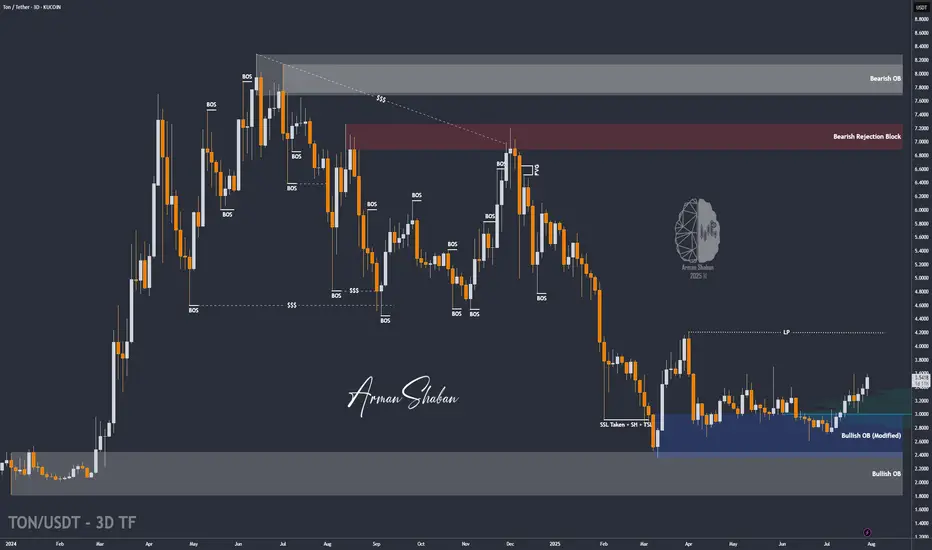
TON/USDT | Surges 18% – Eyes on $3.63, Then $4.20 and $4.68!By analyzing the Toncoin chart on the 3-day timeframe, we can see that after a pullback to the $3 area, strong demand kicked in, and within just one week, the price surged over 18%, reaching above $3.5. Toncoin is currently trading around $3.53, and I expect it to hit the $3.63 target soon. The next bullish targets after that are $4.20 and $4.68.
Please support me with your likes and comments to motivate me to share more analysis with you and share your opinion about the possible trend of this chart with me !
Best Regards , Arman Shaban
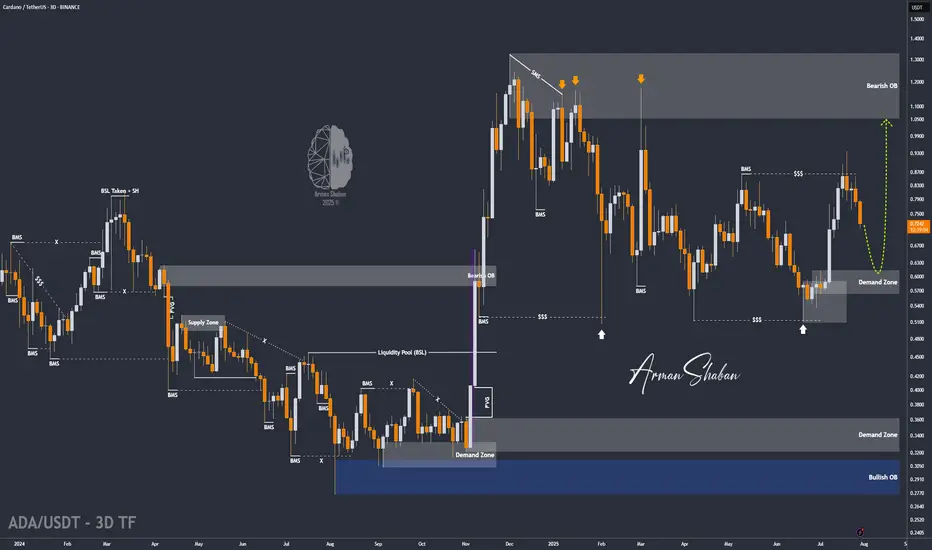
ADA/USDT | ADA Slips Below Support – Watching $0.61 for Support!By analyzing the Cardano chart on the 3-day timeframe, we can see that the price failed to hold above the $0.75 support and is currently trading around $0.72. Given the current momentum, a deeper correction for ADA seems likely. If the price fails to stabilize above $0.69, we could see a sharp drop toward the $0.61 zone. If ADA reaches this key support area, keep a close eye on it — a strong bullish reaction could lead to the next big upside move!
Please support me with your likes and comments to motivate me to share more analysis with you and share your opinion about the possible trend of this chart with me !
Best Regards , Arman Shaban
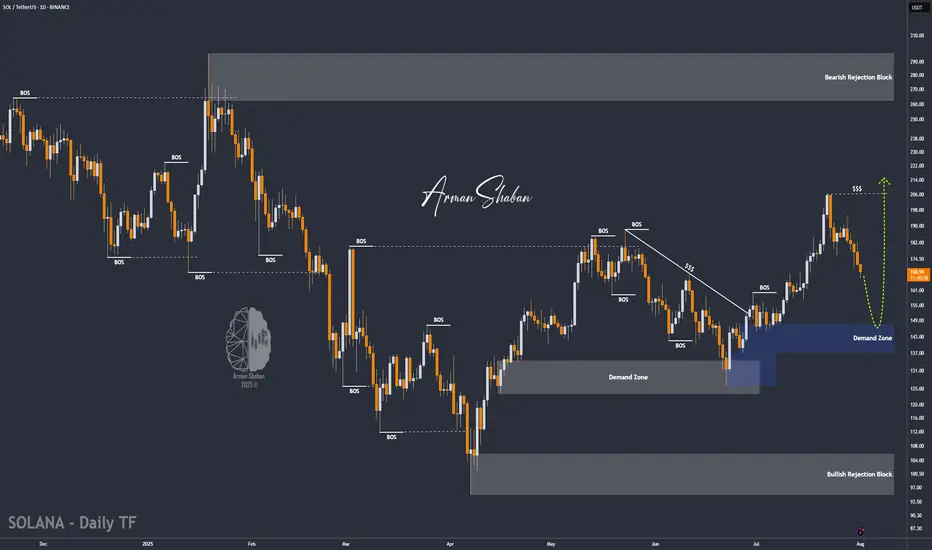
SOL/USDT | NFP Volatility Could Trigger Drop Toward $154!By analyzing the Solana chart on the daily timeframe, we can see that the price is currently trading around $169. If it fails to hold above the $168 level, a deeper drop could follow. With the upcoming NFP data release, increased volatility is expected across the markets. If Solana begins to decline, the potential correction targets are $163, $157, and $154. Watch the $145–$154 zone closely for a possible bullish reaction and buy opportunity.
Please support me with your likes and comments to motivate me to share more analysis with you and share your opinion about the possible trend of this chart with me !
Best Regards , Arman Shaban
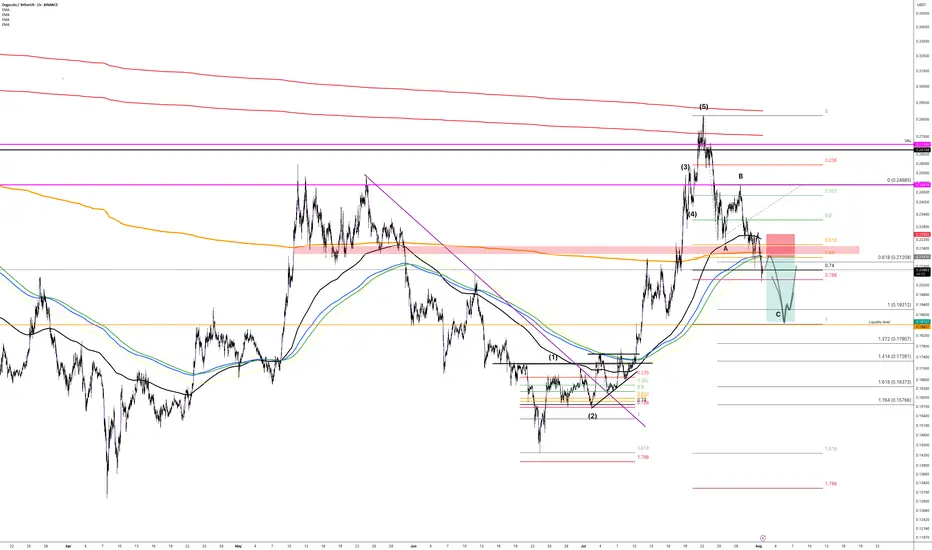
DOGEUSDT|Pullback Confluent Support -cup&handle next ext. +80%DOGE - retraced at the confluent support zone, high potential pullback buy position:
- SMA50 Dynamic support—often attracts mean-reversion buys.
- cup & handle support retest Price retested prior breakout zone—flips resistance to support.
- key 38% Fib “sweet spot” pullback level after corrective moves.
- Previous Change of Character marks shift from bearish to bullish structure—support confluence.
Potential Entry & Risk Management
Entry Zone
- Aggressive: immediate handle breakout support
- Conservative: Wait for liquidity pattern and re-bounce confirmation candle above SMA50
Stop-Loss
-Below Cup Handle low -10% larger position prior swing high RR:2.5/1
-Suggested SL: previous low -0.17 USDT - 5% below entry
Initial Targets
-Key resistance 61.8% Fib retracement — 0.217 USD
-100% Prior swing high — 0.26 USD
-162% Next extended target - 0.35 USD
Trade Rationale
-Mean-reversion into SMA50 and Fib 38.2% zone aligns multiple buyers.
-Pattern support: Cup & handle retest confirms breakout strength.
-Structure flip: CoCh zone indicates bullish regime shift.
Watch-Outs
-Rejection below 0.188 USD erodes support cluster—invalidates setup.
-Rising volume on bounce is crucial—low-volume lifts often fail.
-Beware broader market sell-offs impacting altcoins.
Next Steps:
-Monitor 4-hour candlestick close inside entry zone.
-Check volume spike on reversal candle.
-Adjust risk dynamically if price gravitates toward upper channel resistance.
Always trade with affordable risk and respect your stop..
DOGE (Y25.P3.E1). More lows to come before a longHi traders,
My thoughts on taking a short trade on Doge
why?
confluence on … 200 D ema, Avwap , previous support, etc
All the best,
S.SAri.
DOGE/USDT | Eyes Bounce from Key Support – Next Targets Ahead!By analyzing the Dogecoin chart on the daily timeframe, we can see that after reaching the $0.29 area, the price entered a correction and is now trading around $0.22. If DOGE dips into the key support zone between $0.19–$0.21, we could expect a strong bullish reaction. The next potential targets are $0.287, $0.32, $0.41, and $0.70.
Please support me with your likes and comments to motivate me to share more analysis with you and share your opinion about the possible trend of this chart with me !
Best Regards , Arman Shaban
Phemex Analysis #101: Is Dogecoin (DOGE) Ready to Moon Again?Dogecoin ( PHEMEX:DOGEUSDT.P ), the original meme cryptocurrency, is once again capturing investor attention, fueled by impressive bullish movements. Currently trading around $0.2245, DOGE surged approximately 70% in July, decisively breaking the key resistance at $0.22 and challenging the next resistance level near $0.28.
With whale accumulation intensifying, renewed retail investor enthusiasm, and heightened speculation surrounding possible ETF approvals, Dogecoin appears poised to potentially sustain or even amplify its recent gains. But the key question remains: is DOGE truly ready to moon again, or is caution necessary following such rapid price movement?
Let’s carefully explore a few potential scenarios to inform your trading strategies:
Possible Scenarios
1. Bullish Continuation—Targeting Higher Levels
After successfully breaking above the crucial $0.22 resistance, Dogecoin could maintain its upward momentum if buying pressure remains strong. In this bullish scenario, DOGE might swiftly retest the immediate resistance at $0.25, then target higher levels near $0.28, and potentially surge toward the significant resistance at $0.39.
Pro Tips:
Entry Signals: Watch for a confirmed breakout above $0.25, especially if accompanied by rising trading volume, as a potential bullish entry point.
Profit-Taking: Strategically secure partial profits at resistance zones around $0.28 and $0.39.
Risk Management: Implement tight stop-loss orders just below the key support at $0.20 to guard against unexpected reversals.
2. Retest and Accumulation—Neutral Scenario
Given DOGE’s rapid price rise, a short-term pullback towards previous resistance-turned-support at $0.22 or even $0.20 is plausible. Such retracements, particularly on decreasing volume, might signal healthy consolidation, setting the stage for future bullish momentum.
Pro Tips:
Buying Opportunities: Look to accumulate DOGE if a low-volume pullback occurs toward support zones around $0.22 or $0.20.
Monitor Volume: Observe closely for decreasing trading volume during retracements, which typically indicates positive consolidation rather than a bearish reversal.
3. Bearish Scenario—Deeper Correction Possible
Should overall market sentiment shift negatively or DOGE fail to hold crucial support at $0.22, bearish pressure could escalate, potentially pushing Dogecoin down to deeper support levels around $0.198, and possibly as low as $0.15 or $0.13.
Pro Tips:
Risk Management: Consider reducing or exiting positions if DOGE decisively breaks below $0.22 on increased selling volume.
Long-Term Accumulation: Long-term holders may strategically accumulate DOGE at historically strong support levels ($0.15 or $0.13) once price stabilization occurs.
Conclusion
Dogecoin (DOGE) stands at a pivotal point, balancing bullish enthusiasm against the possibility of a correction. Traders should carefully monitor resistance at $0.25, the critical support at $0.22, and closely observe volume dynamics. By strategically aligning their trades with these outlined scenarios and employing disciplined risk management, traders can confidently navigate DOGE’s volatility and potentially capitalize on its next significant move.
🔥 Tips:
Armed Your Trading Arsenal with advanced tools like multiple watchlists, basket orders, and real-time strategy adjustments at Phemex. Our USDT-based scaled orders give you precise control over your risk, while iceberg orders provide stealthy execution.
Disclaimer: This is NOT financial or investment advice. Please conduct your own research (DYOR). Phemex is not responsible, directly or indirectly, for any damage or loss incurred or claimed to be caused by or in association with the use of or reliance on any content, goods, or services mentioned in this article.
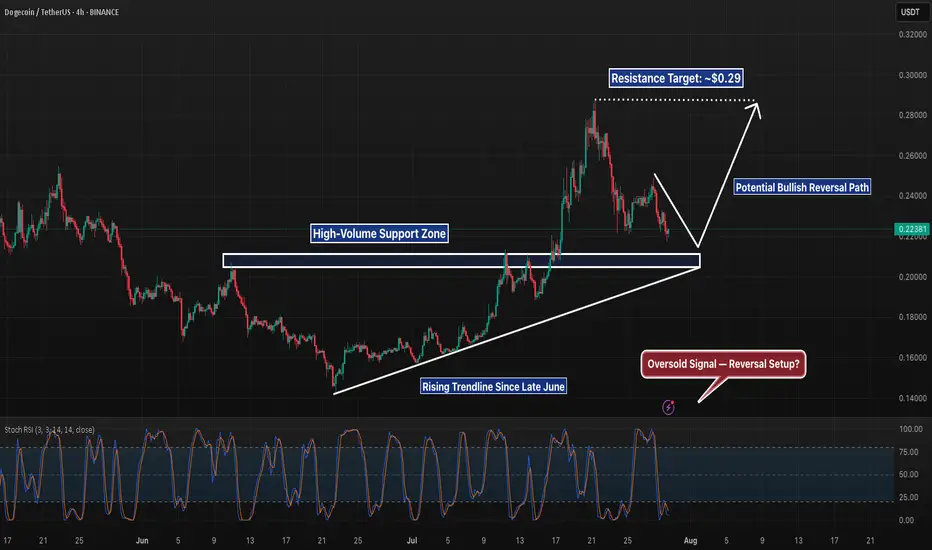
DOGE 4H – Strong Support Test Before Alt-Season??DOGE is approaching a pivotal support zone on the 4H chart — the same area that acted as the breakout base in mid-July before price surged nearly 40% higher. This horizontal level is now being tested again, offering a potential opportunity for trend continuation if bulls can defend it.
The support zone also aligns with an ascending trendline that has been respected for nearly a month, creating a key confluence point. Combined with an oversold Stochastic RSI reading, the setup is beginning to show early signs of a potential reversal — but confirmation is still needed.
Price structure remains technically bullish unless this area breaks. A clean bounce here could trigger a new wave toward the prior high at $0.29. On the flip side, a breakdown of this confluence zone would invalidate the current trend structure and likely target the $0.19–0.20 region.
📊 What I’m Watching For:
– Bullish price action (e.g., hammer candle, engulfing) off this zone
– Higher low confirmation with volume
– Trendline retest and hold
– Momentum alignment with RSI/Stoch flip
DOGE remains one of the more technically clean charts among majors — but holding here is key. Watching closely.
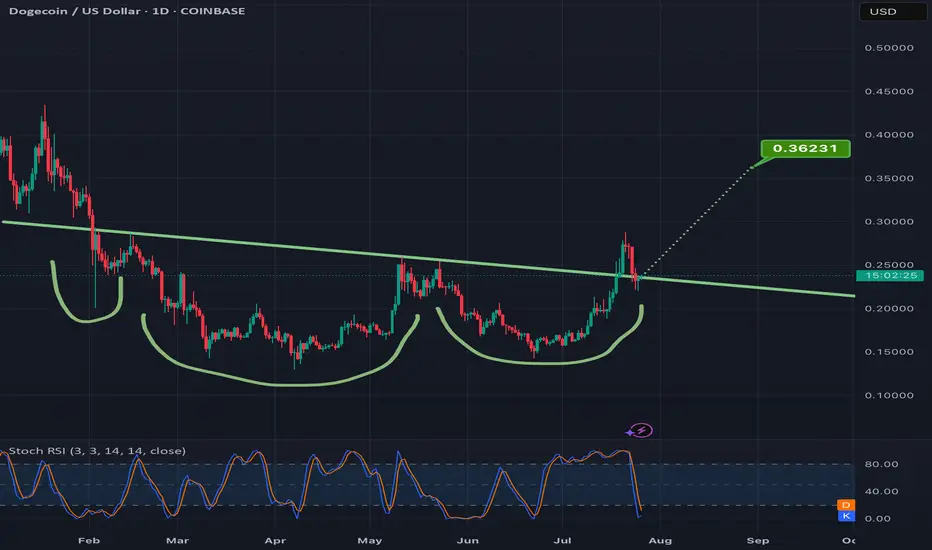
Dogecoin - It is all totally expected!🐶Dogecoin ( CRYPTO:DOGEUSD ) will break out soon:
🔎Analysis summary:
Just this month, Dogecoin perfectly retested a significant confluence of support and is starting the expected rejection. With bullish momentum picking up, there is a very high chance that Dogecoin will break the all time high in the near future.
📝Levels to watch:
$0.5
🙏🏻#LONGTERMVISION
SwingTraderPhil

DOGE Looking Strong as Support HoldsDOGE Looking Strong as Support Holds
🔹 1. Support Zone Validated
The chart shows Dogecoin retested the lower boxed region around $0.221–$0.223, and bounced sharply from that zone. Given the heavy spike in volume during the retest, this suggests aggressive buying and accumulation—a hallmark of bullish conviction.
CryptoRank
The Tradable
🔹 2. Fibonacci 0.618 Support Bounce
On the 4‑hour timeframe, DOGE held firm above the critical Fibonacci 61.8% retracement level, and delivered a strong rebound—indicating technical significance and buyer interest at this level.
Blockchain News
🔹 3. Double-Bottom + Trendline Breakout
Analysts have identified a classic double-bottom formation, with price clearing the neckline (~$0.230–$0.231) and then retesting it successfully. Holding this retest confirms a breakout, suggesting more upside ahead.
Crypto Basic
🔹 4. Whale Activity & Accumulation
On-chain data shows $250 million in Dogecoin accumulation by whales, especially around the support zone—creating a structural demand base and reinforcing the bullish setup.
CoinCentral
🎯 Price Targets & Key Levels
Scenario Levels Rationale
Bullish continuation $0.239–$0.241 union resistance First resistance zone—price must reclaim to continue bullish momentum
$0.260–$0.280 Reclaiming $0.241 could open room toward mid‑channel resistance or prior highs
$0.300+ Potential target if momentum sustains and broader breakout occurs
Bearish invalidation $0.223 support Invalid break below suggests fading momentum—risk of correction to $0.215–$0.218
$0.215–$0.218 Secondary support zone if expansion of sell side continues
⚙️ Trade Setup for a Bullish Bias
Entry Focus: Consider entering long near $0.223 if price retests and holds, with a tight stop just below support.
Stop-Loss Zone: Slightly beneath $0.221 to account for volatility.
Targets: Scale out around $0.241, with larger targets at $0.260–$0.280, and possibly $0.30+ on sustained strength.
Confirmation: Watch for rising volume, break and close above resistance zones, and bullish indicator alignment.
⚡ Market Sentiment & Broader Themes
Momentum Shift: A bearish retrace reversed quickly amid accumulation, suggesting strong buyer commitment.
CryptoRank
The Tradable
AInvest
Double Bottom Status: Analyst commentary supports a reversal setup, with targets toward $0.310–$0.46 if the neckline holds.
Crypto Basic
AInvest
CryptoRank
Macro View: DOGE remains within a bullish channel; some forecasts project
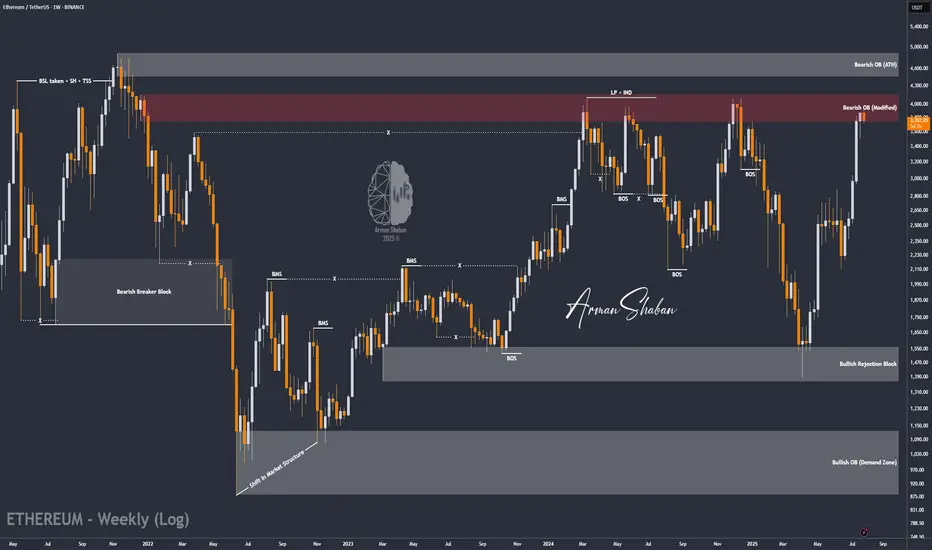
ETH/USDT | at a Crossroads – Hold Above $3440 or Sharp Fall!By analyzing the Ethereum chart on the weekly timeframe, we can see that after reaching $3940 and touching the key supply zone, ETH entered a slight correction and is currently trading around $3756. The key question now is whether it can hold above $3440 by the end of the week and push past $4000. If it does, we can expect another bullish leg toward $4100 and $4470. However, if the $3440 support fails, a sharp decline may follow — so this level is critical.
Please support me with your likes and comments to motivate me to share more analysis with you and share your opinion about the possible trend of this chart with me !
Best Regards , Arman Shaban
Thief Strategy Unlocked: DOGE/USDT Swing Robbery🐕💸 "DogeCoin Heist Plan: Swipe the Vault Before the Bark Bites!" 💥🔐
🌍 Hi! Hola! Ola! Bonjour! Hallo! Marhaba! 🌍
🎩 Welcome back, Money Makers & Market Robbers! 🏴☠️
💥 This is your DOGE/USDT (Dogecoin vs Tether) Crypto Market Heist Plan – fully loaded with Thief Trading Style tactics combining technical firepower 🔥 and macro intel 📊 for a high-voltage entry!
💣 Plan of Attack: The Robbery Blueprint 📈
🎯 Entry Point:
🟢 The vault's wide open! Enter LONG at any price—pullback is your sneak path in.
Set your BUY LIMIT orders using 15m or 30m timeframes at the recent swing zones.
Layer them like a pro 💹 with DCA (Dollar Cost Averaging) precision.
🛑 Stop Loss (SL):
👂 "Listen up!" Don’t slap a stop loss before the pullback confirms—it’s like triggering the alarm too early!
📍 Thief's SL placed only after pullback occurs—use the 4H swing low around 0.19000.
✍️ Adjust SL based on your risk appetite, lot size, and number of entries.
🏁 Target Zone:
🎯 Aim for 0.28000, or make a stealthy exit before the escape door shuts.
💰 Special Note for Scalpers:
Only go LONG—this market’s barking up, not down!
Big pockets? Straight in.
Smaller stack? Join the swing crew and rob with patience.
Use a trailing SL to secure the loot 🏆.
📊 Market Overview:
Currently bullish bias due to:
Macro inflows
Risk sentiment shift
Volume surge
On-chain support
Check 📡: Fundamentals | COT | Intermarket | Sentiment | Price Action.
⚠️ Heist Hazard - News Alert:
📰 Don’t enter new positions around high-impact news.
Set trailing SLs to guard your open trades during these volatile spikes.
💖💬 Robbers' Call to Action:
💥 Hit that BOOST Button on the idea 💥
Not just for likes—it fuels our squad’s energy and signals more Thief Heist Plans are coming 🐱👤💸
Let’s rob these charts—strategically, smartly, & silently.
📌 Stay Tuned for more explosive trade setups from the vault of Thief Trader.
🤑🛸 Trade smart. Trade bold. Trade like a Thief.

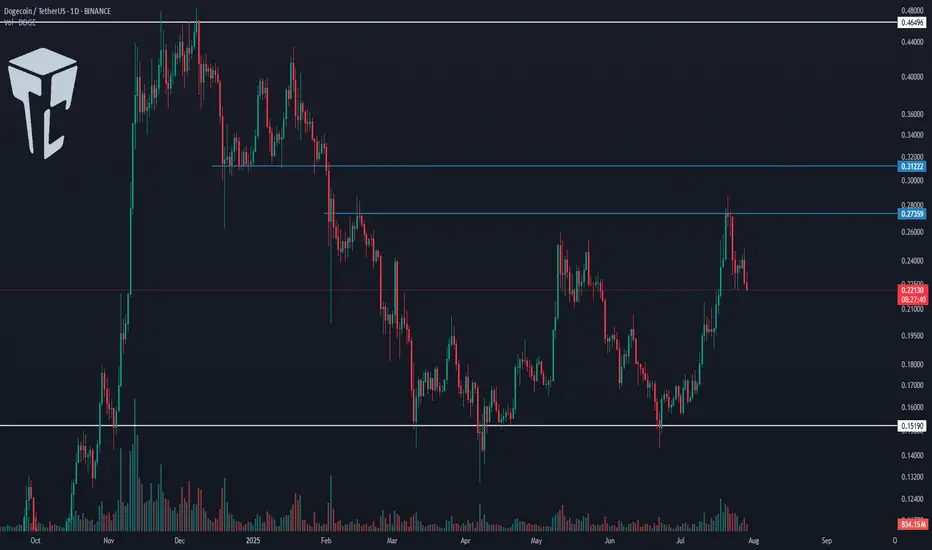
TradeCityPro | DOGE Faces Resistance with Altseason Tailwinds👋 Welcome to TradeCity Pro!
In this analysis, I want to review the DOGE coin for you. One of the first and most popular shitcoins in crypto, which managed to attract a very strong market cap during the previous bull run due to the hype around Elon Musk.
🔍 Currently, this coin has a market cap of $34.06 billion and ranks 8th on CoinMarketCap.
📅 Daily Timeframe
In the daily timeframe, this coin has created a very strong support level at 0.15190, and now after a bullish leg, it has formed a top at 0.27359.
📊 The buying volume increased nicely during this bullish leg, and the price moved up to the 0.27359 resistance.
✔️ Now, after the first touch, the price has started a slight correction and is moving downward. If further touches occur, we can open a long position after breaking the top.
📈 Breaking 0.27359 could be one of those positions that stays open all the way up to 0.46496, and we can buy this coin in spot using the profit from that trade. I will try to have a position open after breaking 0.27359, aiming for 0.46496.
💥 The next trigger we have is the break of 0.31222, but the price should first form some structure after reaching that area, and only after confirmation should we open a position. Just entering based on that break doesn’t seem logical to me.
🔽 If a correction and drop happen, as long as the price stays above 0.15190, there’s no problem for the trend to continue. But if the price stabilizes below that level, a trend reversal might occur.
📝 Final Thoughts
This analysis reflects our opinions and is not financial advice.
Share your thoughts in the comments, and don’t forget to share this analysis with your friends! ❤️
Doge(based on NEo wave)confirmation of finishing the E wave of triangle is here now.
it takes about 400 days for all targets to pass.
see the related last chart of doge.

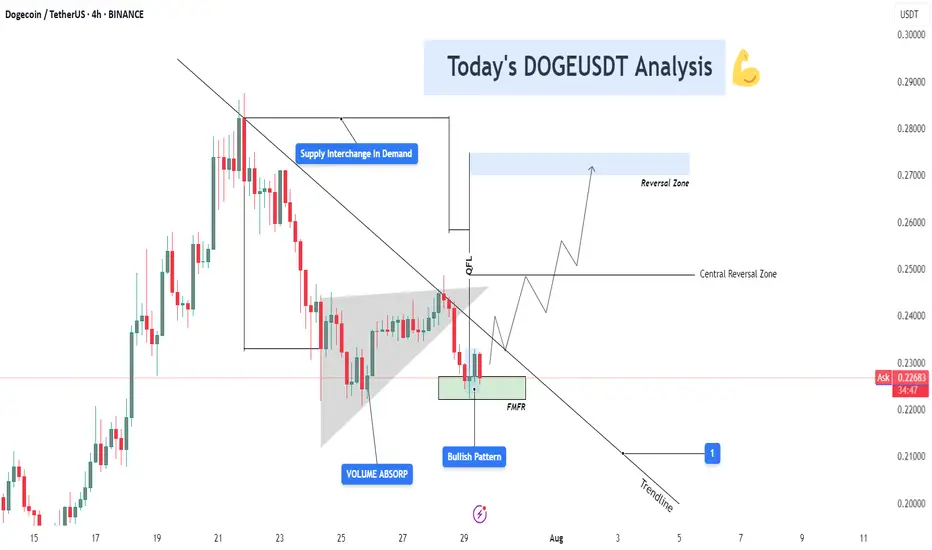
DOGEUSDT 4H – Bullish Reversal Building from FMFR Zone📊 Chart Context & Market Maker Concept Breakdown
DOGEUSDT on the 4H timeframe is setting up for a potential trend reversal, following a structured retracement into a strong demand zone that aligns with multiple smart money confirmations: QFL base, trendline break, volume absorption, and FMFR (Final Move Final Reaction). Let’s dive into the technical layers of this setup:
🔻 1. Downtrend Phase & Structure Setup
After peaking near $0.29, DOGE entered a controlled downtrend, respecting a descending trendline and forming a consistent lower-high structure.
Each rejection from the trendline reflects institutional distribution, gradually pushing price into lower demand levels where value buyers can step in.
🔄 2. Supply Flips into Demand (S/D Flip Zone)
A key level near $0.225 – $0.230 initially acted as a supply zone — but following QFL logic and smart money reaccumulation, it is now showing signs of demand activation.
The chart highlights “Supply Interchange in Demand”, which means that this zone has been repurposed — from distribution to accumulation — another MMC footprint.
📌 Interpretation: This is where large players flip their position bias and start loading for the next leg up.
🔵 3. Volume Absorption Confirmed
Prior to the current bounce, a strong volume absorption phase was detected within a falling wedge or triangular base, shown on the chart.
Despite sell-side pressure, buyers continued to absorb orders — a sign that selling is weakening, and accumulation is underway.
📌 Clue: Volume absorption often precedes an explosive breakout, especially when aligned with FMFR or QFL patterns.
🔁 4. Final Move Final Reaction (FMFR)
Price tapped into the green box zone one final time, marked as FMFR (Final Move Final Reaction) — a key MMC reversal signal.
This occurs when market makers fake a breakdown (creating panic) and then sharply reverse, trapping breakout sellers and scooping up liquidity.
A small bullish candle formation (Bullish Engulfing / Pin Bar) can be seen within this zone — the “Bullish Pattern” label marks this.
🧠 Smart Money Logic: Institutions want liquidity. FMFR fakes weakness to attract retail shorts, then reverses to ride liquidity to the upside.
🔗 5. QFL Base + Break of Structure Setup
A QFL (Quick Flip Level) pattern is forming. This represents a market structure flip, where price first drops from a base, reclaims it later, and continues in the opposite direction.
Breaking this base and confirming above it would mark a true reversal in structure.
🛠️ Technical Confluences at Work
Element Insight
🔹 QFL Structure Base level reclaim in play (structure shift)
🔹 Volume Absorption Smart money soaking up sell pressure
🔹 FMFR Reaction Final stop hunt before the rally begins
🔹 S/D Flip Supply turned to demand near $0.225 zone
🔹 Bullish Pattern Early confirmation of reversal
📈 Projection Path & Reversal Zones
Two projected zones are mapped for price behavior:
🔸 Central Reversal Zone (~$0.250):
First significant resistance where price may pause or react.
Ideal partial profit level or re-entry after pullback.
🔹 Main Reversal Zone (~$0.270–0.275):
Target area for a full liquidity sweep.
This was a previous high-volume supply zone.
If price reaches here, expect potential rejection or distribution unless momentum is strong.
🎯 Trade Setup Strategy (Based on Your Chart)
Entry Area: $0.225 – $0.229 (FMFR Reversal Zone)
Stop-Loss: Below $0.221 (beneath FMFR low)
Take Profit 1: $0.250 (central zone)
Take Profit 2: $0.270 – $0.275 (main reversal zone)
📐 Risk-to-Reward:
TP1: 1:2
TP2: 1:3+ depending on entry timing
🧠 Psychology Behind the Setup
This DOGE setup is engineered to trap emotional traders:
Retail sellers enter late near the bottom.
Smart money waits at FMFR zone, absorbing liquidity.
Volume builds quietly.
Market reverses explosively, catching retail off guard.
By recognizing this setup early, you’re aligned with Market Makers, not against them.
Dogecoin · Risk of Much Lower is MinimumWe start the process by looking at a few charts. We start with the big projects in order to gain a perspective of the bigger picture. After reviewing 10-20 charts, we start to get an idea, but we don't form any picture in our minds, we just continue reading; reading the articles and reading the charts.
After just 10 days, we have anywhere between 80 and 100 articles/charts. Now we have a better picture of the market. We know how each sector is doing and this further helps us develop our bigger picture, the one that will help us call the shots.
After we review 150 to 200 charts and trading pairs, we get the pulse of the market. Where the energy flows, our attention goes and sometimes our attention reaches before the energy and this gives us an entry prize.
It will continue to work in this way. If you look at the market daily, read open to accepting new information, accepting always that I can be wrong, we can continue to develop a sense of what is really happening.
Dogecoin is making a minor pause after weeks of sustained growth. It is normal, if the market is going to be growing for months, everything cannot happen in a day. Five steps forward, three steps back.
Namaste.
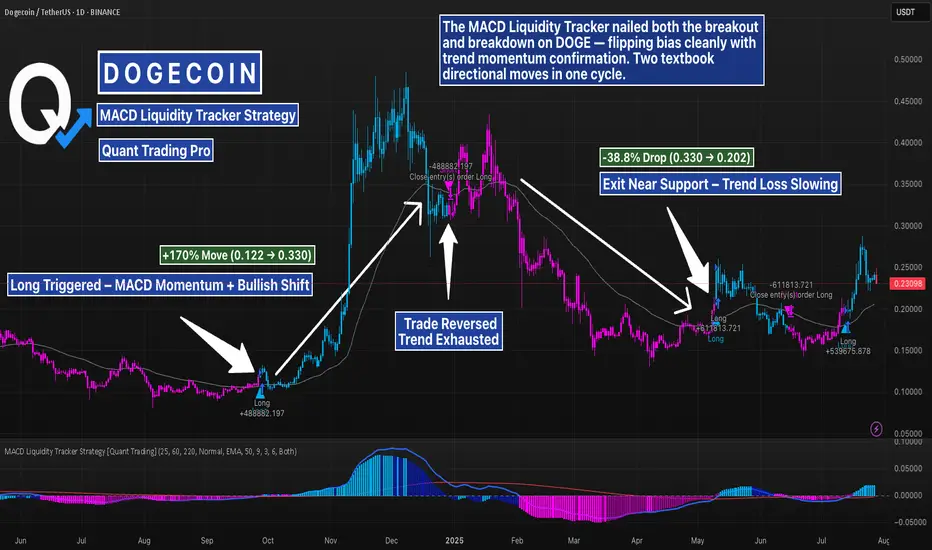
DOGE MACD Liquidity Tracker Strategy – Trend Flip & Breakdown 1DThis DOGE 1D chart highlights two key directional shifts caught by the MACD Liquidity Tracker Strategy — a bullish breakout near $0.12 and a clean reversal near $0.33. The system flipped long once MACD momentum aligned with trend structure, and later rotated bearish as the trend exhausted.
Both moves were captured without guessing — using dynamic trend coloring and a momentum-backed entry logic. Visual bias (blue/pink) helps contextualize the trend at a glance, and the EMA filters reduce chop during sideways conditions.
To explore this setup yourself, search for the strategy by name and run your own backtests to refine inputs per asset and timeframe.
📊 Strategy Name:
MACD Liquidity Tracker Strategy
This is one of several strategy visualizations — more incoming.
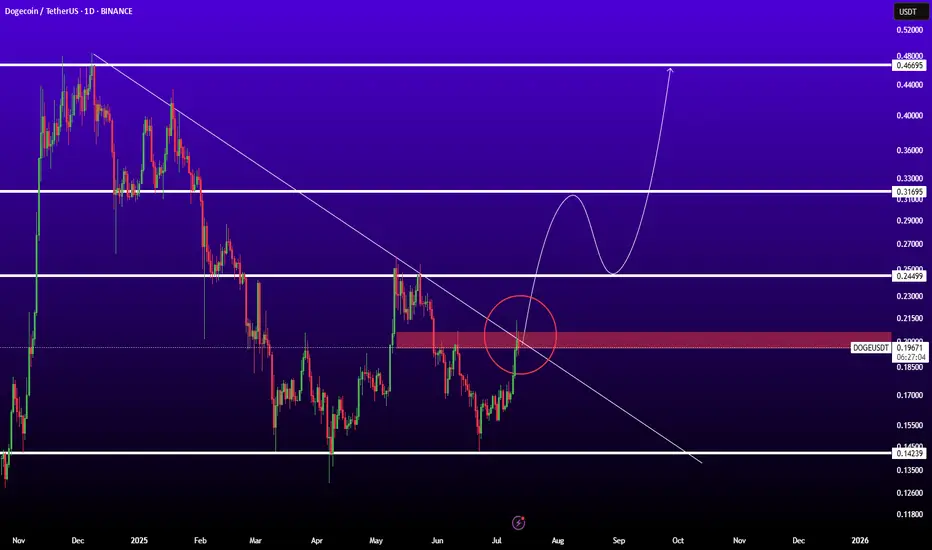
DOGEUSDTBINANCE:DOGEUSDT is in good level for pump because if breaked trendline and resistance 0.200$ ready for sharp movement to next levels.
Resistances: 0.25 - 0.32 - 0.45
Support: 0.15
Confirming the breakout of this invh&s on doge can = 50% gainsAlready went above the neckline once and the current daily candle is currently back above the neckline for a second time. Hitting the full target would mean a good 50% gain from current price. *not financial advice*
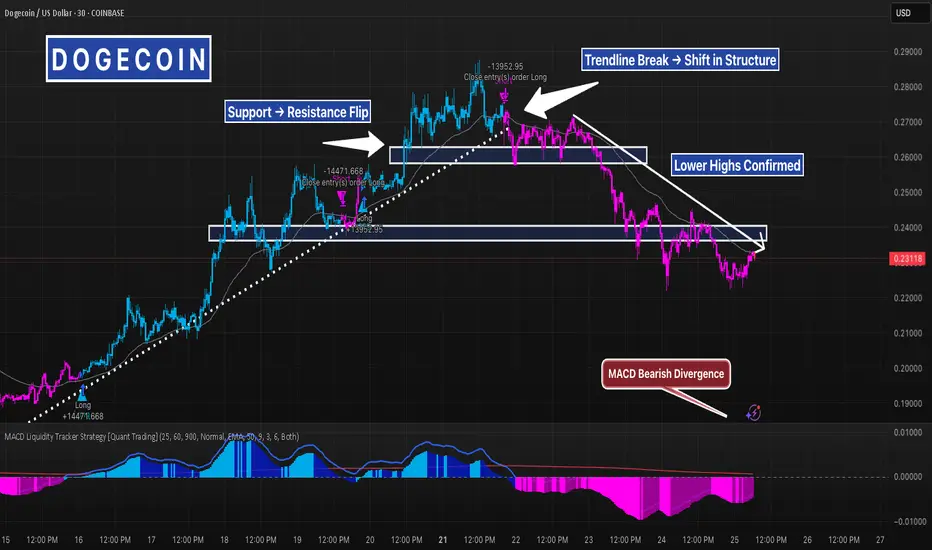
DOGE 30m – Trendline Break + Bearish Divergence = Clean ReversalThis DOGE 30-minute chart offered a textbook reversal sequence:
Price was riding a clean ascending trendline with support from moving averages and strong bullish structure. But things shifted fast.
We saw:
– A clear MACD bearish divergence (momentum fading as price pushed higher)
– A trendline break and lower high, signaling loss of bullish control
– Former support flipped into resistance, confirming the structure shift
– Price now consolidating near the last major demand zone
If this zone breaks, expect continuation lower. If it holds, this could become a temporary bounce area — but momentum is clearly in the bears’ hands for now.
Zoom out for confluence and track price behavior around this zone for your next move.
#DOGE #CryptoTrading #TechnicalAnalysis #MACD #ReversalSetup #TrendlineBreak #SupportResistance #QuantTradingPro