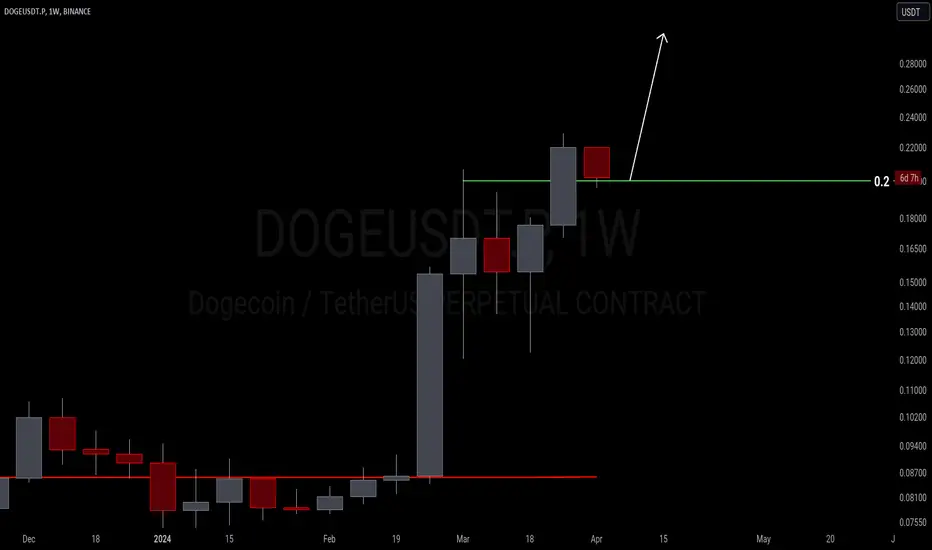
🚀🌕 Dogecoin Long Opportunity: Entry at Demand Zone and FVG💰Hey traders! 🎩💼 I trust you're all doing well. Here's an enticing trade proposition for BINANCE:DOGEUSDT (DOGE/USDT), offering not one but two potential entries.
1st Entry: 0.18157
We're initiating our first entry based on the presence of a demand zone (SMC). This strategic entry point presents a promising opportunity to capitalize on potential bullish momentum.
2nd Entry: 0.17400
Our second entry is triggered by a Fair Value Gap (FVG), adding another layer of confidence to our position. This secondary entry reinforces our conviction in the trade setup.
(before reading further, follow, like and comment what you think about this idea...)
Stop Loss (SL): 0.17058
To mitigate risk, our stop loss is set at 0.17058. This level acts as a safeguard against adverse price movements, ensuring prudent risk management.
Target: $1 (Long-term Vision) 🎯
Now, our target is set at $1. But hey, we're not just staring at the stars here; we're ready to sell before the biggest TP hits if needed.
(....and share)
However, it's essential to exercise flexibility and consider taking profits earlier, albeit retaining a portion of DOGE. Elon Musk's tweets have historically influenced DOGE's trajectory, potentially propelling it "to the moon."
This signal is based on SMC strategy...
You also want to learn SMC strategy? Great, right it down in the comments!
Dogecoin
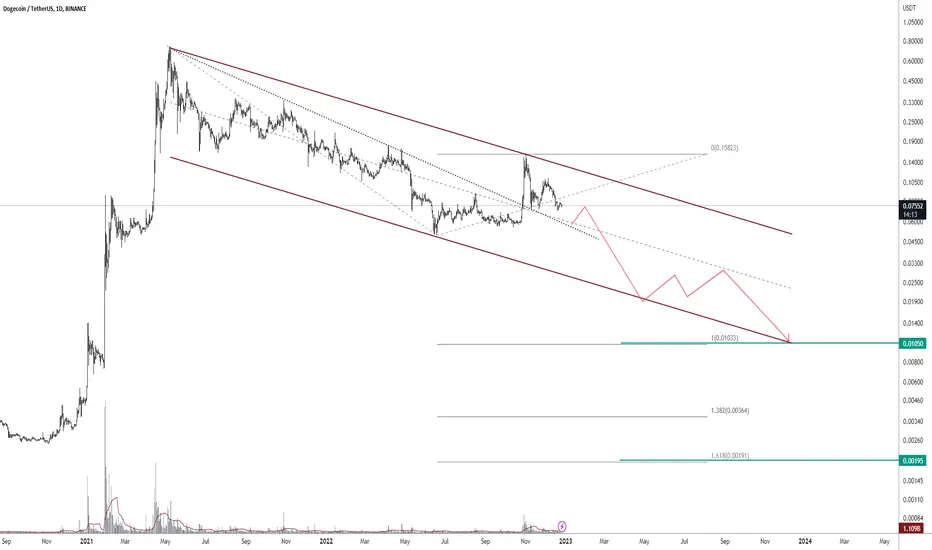
DOGEUSDT.1DAlright, let's dissect this Dogecoin (DOGE) to Tether (USDT) daily chart on the Binance exchange from my perspective as a technical analyst.
The chart is striking, showcasing Dogecoin's price volatility. Initially, I notice a significant spike in price, followed by what appears to be a consolidation pattern. The price is well below the Ichimoku Cloud, which traditionally suggests that we are in a bearish trend. The Cloud's future projection also appears to be widening downwards, potentially signaling a continuation of the bearish trend.
The Ichimoku Cloud components are also indicative of this sentiment. The Conversion Line (blue) below the Base Line (red) generally implies bearish momentum. Moreover, the price is under the Base Line, further solidifying the bearish bias.
We can see the marked pivot point levels, with R1 and S2 illustrated. The price is currently hovering above the S2 support level. If this level fails to hold, we may see a further decline towards lower historical support zones. If a reversal were to occur and the price moves upwards, the R1 level will act as resistance.
The Relative Strength Index (RSI) is showing an overbought condition with a reading above 60, which is intriguing given the price is not showing bullish momentum. This could imply that a corrective move or consolidation may follow as traders potentially take profits from the recent spike.
The Moving Average Convergence Divergence (MACD) is almost negligible in movement, with the MACD line just above the signal line but both hovering around zero. This suggests a lack of strong momentum in either direction currently, which can often be the case after a large price movement as the market digests the change.
In summary, while Dogecoin has experienced a significant price increase, the current setup on the daily chart suggests bearish momentum as indicated by the Ichimoku Cloud and the consolidation pattern following the spike. The RSI's overbought signal does not match the price action, indicating that traders should proceed with caution. Any trading decisions should be approached with a clear risk management strategy, considering the possibility of a false signal given the mixed messages from the RSI and MACD indicators. A break above the Base Line of the Ichimoku Cloud could be used as an early indication of changing sentiment, while a fall below the S2 level could signal further declines. As always, patience and confirmation are key.
DOGEUSDT: Bears in ControlDOGEUSDT printed a double top pattern followed by a series of Lower Highs and Lower Lows along with Shooting Star candles on the previous Lower Highs which suggests continuation of downward momentum. Using the Fib tool, an Entry Price, Stop Loss and Profit Levels are defined with 1:1 Risk Reward Ratio.

Just matter of time for DOGEEverything is good for DOGE. As i shared in my previous ideas, DOGE dropped and reached support zone. I can't exclude it could drop more, but till it's above the trendline, all is ok. I think it reached a strong support zone and should bounce here. First target $0.24, stop below local bottom
Dogeeeee going downguys this is terrible, all the options will be sold, doge is going to 0.10$
50% down
half of investments
Dogecoin short term analysisIt could be Elliot Wave Expanding Flat correction as well as Wedge. In the first case buy out target ~ 0.1, in the second case - 0.137. According to oscillators i anticipate the both figures will work out: 1) EWI Expanded Flat 2) Wedge.
If uptrend is too much powerful we will see the price bump out on the level where wave A started ~0.17

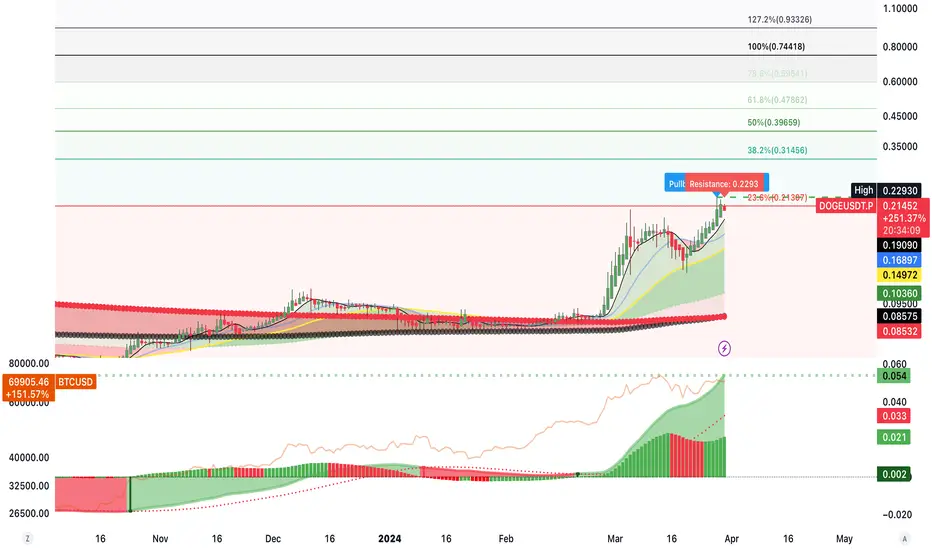
💎 BTC/USDT - Bull or Bear ? (READ THE CAPTION)As you can see, after the last Bitcoin analysis, the price was able to grow from FWB:67K to $71.7K, and today this cryptocurrency fell by more than 7% and is currently trading in the range of $66,500! The first important demand level in front of Bitcoin is $59,000 to $63,000 and the second important demand level is $38,800 to $43,700! As you know, there are only 18 days left until the Bitcoin halving, and the closer we get to this date, the more severe the fluctuations of Bitcoin will be!
Please support me with your likes and comments to motivate me to share more analysis with you and share your opinion about the possible trend of this chart with me !
Best Regards , Arman Shaban
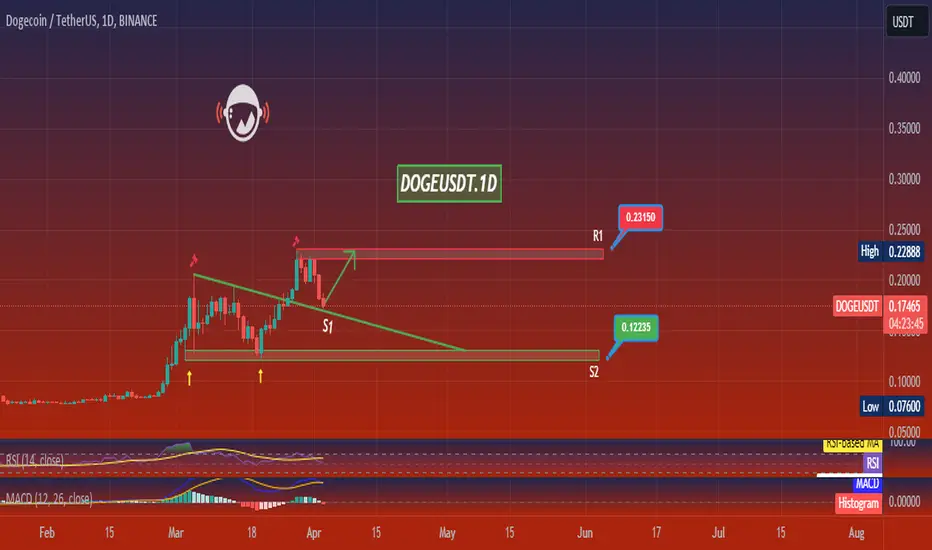
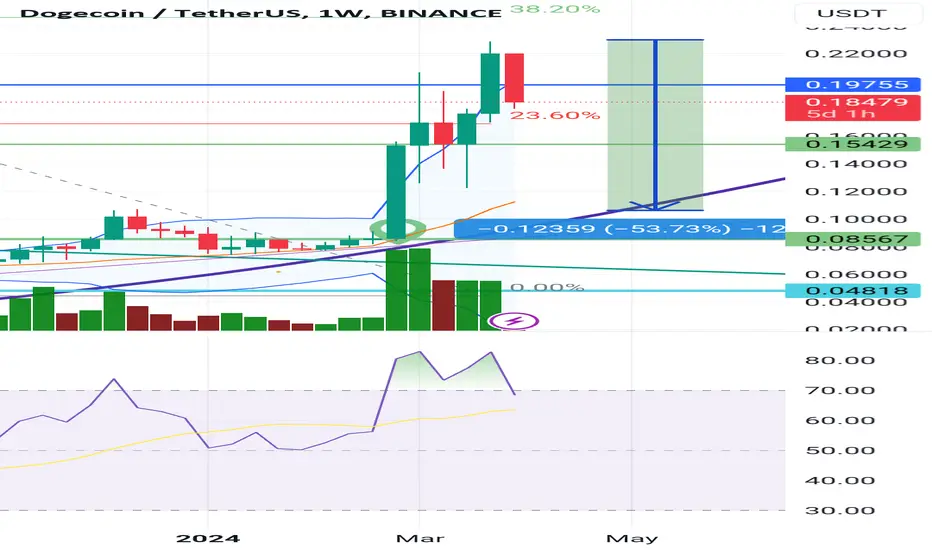
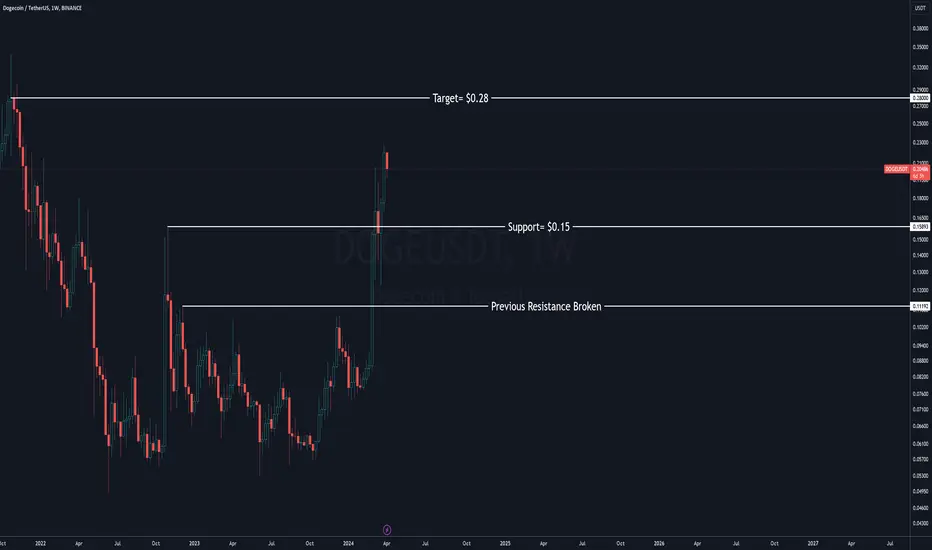
Dogecoin (DOGE) TO DA MOON! - 2024TO DA MOON!!
All jokes asides, Doge is peforming exceptionallywell, previous Resistance has been broken at: $0.11. New Level of Support has been formed at= $0.15. Not much next Resistance levels now ahead.
Current target set at= $0.28 which basically will be the "NEW" Level of Resistance until the next key levels.
Trade with caution with meme coins, expect high volatility within the ranges of the key levels I have provided shown from the chart TA.
Despite being a meme coin, DOGE has a very high Marketcap of $23Bil. Huge amount of 24hr trading volume too which is insane. It's a stable meme coin, but it's here to stay in the crypto space! :D
Riding the DOGE Wave: Buy Signal for DOGEUSD 1H - 1:3 RRRIn this trading strategy, we explore a potential long position opportunity for the DOGE/USD currency pair on the 1-hour timeframe. By combining the insights from key technical indicators such as the Exponential Moving Average (EMA) 200, Moving Average Convergence Divergence (MACD) for trend analysis, and Supertrend for entry signals, traders can aim for a favorable risk-to-reward ratio of 1:3.
Indicators:
EMA200: The EMA200 acts as a crucial indicator of the long-term trend direction. A rising EMA200 suggests a bullish bias in the overall trend, providing confirmation for potential long positions.
MACD Trend: The MACD indicator helps traders gauge the strength and direction of the trend. A bullish crossover (when the MACD line crosses above the signal line) or divergence from the price action signals potential upward momentum, aligning with our long position strategy.
Supertrend: The Supertrend indicator serves as an effective tool for identifying entry points in alignment with the prevailing trend. When the Supertrend line changes its color from red to green, it indicates a shift from bearish to bullish sentiment, presenting a potential entry signal for long positions.

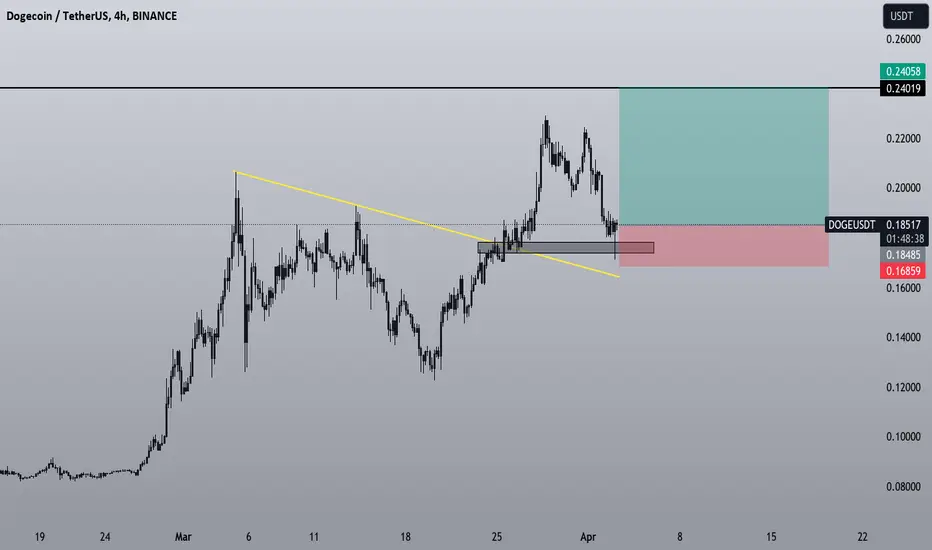
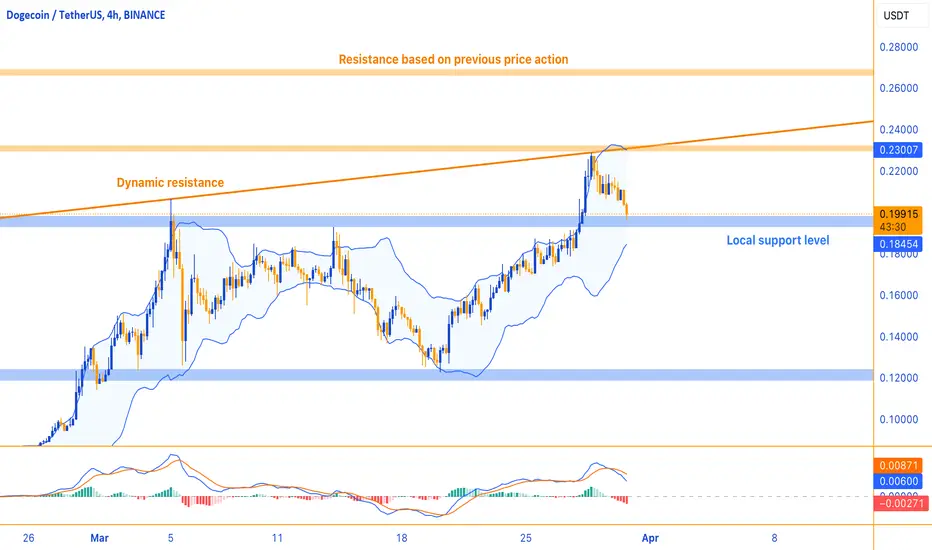
A Bounce Back or Further Dip?DOGE is currently presenting a compelling technical setup on the 4-hour chart. The price of Dogecoin has recently pulled back to 0.019944, after approaching a dynamic resistance trendline that has been guiding it for some time. The chart indicates that Dogecoin has also retreated from a resistance level that was based on previous price actions, which suggests that this area is significant for traders.
The Bollinger Bands (BB) indicate that the price has retreated from the upper band, which often acts as a dynamic resistance, and may potentially test the lower band at 0.18463 as a support level. If this level holds, it could be a sign of resilience in Dogecoin's price.
The MACD histogram shows negative momentum (-0.00266), with the MACD line slightly below the signal line, indicating a potential slowdown in the upward trend or a beginning of a short-term downtrend. Meanwhile, the Stochastic Oscillator (%K at 11.53) is signaling that the coin is currently oversold, which often precedes a potential reversal or at least some consolidation.
The RSI at 49.40 is nearly in the middle, which suggests that Dogecoin is neither overbought nor oversold in the broader context. However, the proximity of RSI to the 50 mark may indicate a lack of decisive momentum in either direction, and the RSI-based Moving Average is significantly higher, showing that the recent trend has been more positive.
Bringing these indicators together, Dogecoin is showing signs of a short-term downward pressure while still within the context of a larger uptrend. Traders may be watching to see if the local support can hold for a possible bounce back or if the price will continue to seek lower levels for stronger support. Given the oversold condition suggested by the Stochastic Oscillator, there might be an opportunity for buyers to step in, provided that broader market sentiment and volume support such a move.
DogeUSD: playing out text book so farLast week I was watching $0.12 area closely. If there was a break of this area, it could have meant a potential disaster for the holders. But just like magic, price bounced sharply from that area and made a new high, confirming a full 5 waves move to the upside. Price can go up more to hit some proper fib extensions to bolster the move, but at this point anything is a bonus. Next move to watch is the retrace. Depending on where price tops out, I would expect 0.618 fib retrace zone to hold. Worst case 0.5 fib retrace area since it is an intermediate degree wave 2 retrace. The correction could last a few weeks to a few months. I would not like price to revisit $0.10 are again, but it can happen with a deep retracement. Doge is volatile and news driven, so big price movements are not surprising. But, testing back at $0.16 - $0.17 would be a text book thing to do to confirm the breakout.
There is a longshot bearish case still lingering where the latest bull run could be a larger degree C wave. In that case, party is over friends and price is destined to go back sub $0.05. That is a long shot because a lot needs to go wrong for that scenario to play out and market as a whole need to collapse soon. For now, let's keep it in a back burner.

.75+ she’s almost ready for next lag upShe’s in a good position to push upward of .30 soon, ARE WE LOADING UP OR WHAT!!
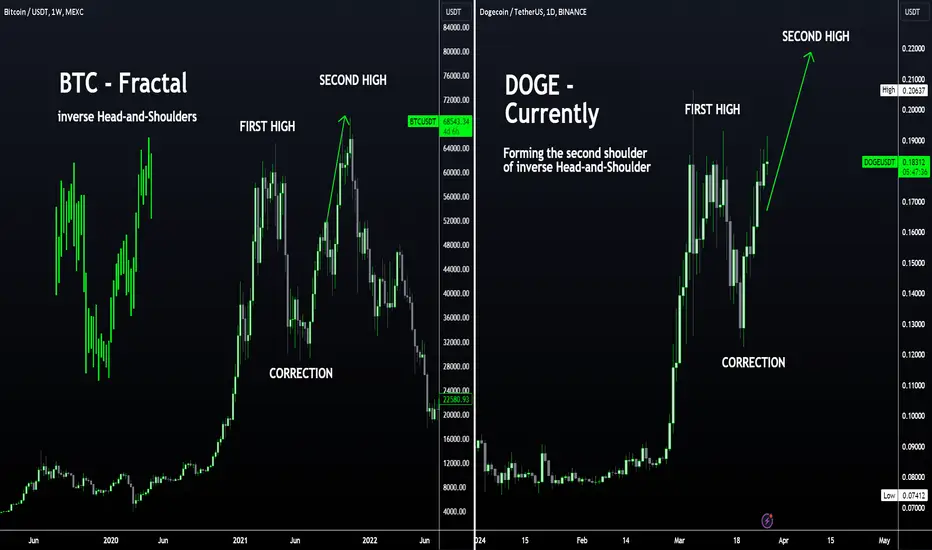
DOGE Fractal: Following THIS Pattern? 📉Hi Traders, Investors and Speculators of Charts📈
Dogecoin was one of my TOP altcoins to watch for 2024. (Find the others here):
Doge has been following an interesting pattern recently in the daily timeframe - Elliot Waves. We see the 5 impulse waves up (wave1-5) followed by the abc correction waves. Then we have a period of range bound trading finally before the next wave1-5 starts. Here's where it get's technical in terms of the wave fractal:
If you found this content helpful, please remember to hit like and subscribe and never miss a moment in the markets.
_______________________
📢Follow us here on TradingView for daily updates📢
👍Hit like & Follow 👍
CryptoCheck
BINANCE:DOGEUSDT

💎 MPC/USDT - First SHORT , Then LONG ! (READ THE CAPTION)By re-examining the MPCUSDT chart, we can see that after moving to the first target, the price started to drain the excitement caused by the previous pump because it was just listed in this exchange, and it is currently trading in the range of 31 cents., The demand range for the price is between 25 and 30 cents, so we have to wait for the price to react to this level! If the price can make a strong return from this area, we can expect growth to higher levels than the price! (Targets are on the last TA) So, wait for confirmation and a suitable trigger to enter the price! So first, I expect the price to be corrected to lower levels, and then if the price returns to above 33 cents, we can see more growth in the price!
Please support me with your likes and comments to motivate me to share more analysis with you and share your opinion about the possible trend of this chart with me !
Best Regards , Arman Shaban
Can doge reach 1$ soon ? DOGE / USD
Very interesting chart to see !
Price is showing a similar pattern from the last 2 cycles
According to previous date the price usually touch the main trendline about 3 time inorder to breakout so if we will repeat that, the big breakout should happen next months
Doge is always doing big move in bull market
Can we see Doge above 1$ this cycle ?
Best of wishes

SHIBA INU LONG SETUPSHIB broke the resistance trendline previous week, and is currently trading above the upper band of triangle, so more bullish wave could be expected once BTC does well.

DOGE - Following BTC FRACTAL?🚀📉Hi Traders, Investors and Speculators of Charts📈
Fractals are a helpful way to identify how markets have previously moved. When identifying a similar pattern, it can be useful to speculate future potential price action.
Doge has been very profitable so far. Dogecoin was one of my TOP altcoins to watch for 2024. (Find the others here):
As BTC trades sideways/rage, we can expect to see altcoins play catch-up. From a correction perspective, this was the drawback for each coin during the corrective wave:
If you found this content helpful, please remember to hit like and subscribe and never miss a moment in the markets.
_______________________
📢Follow us here on TradingView for daily updates📢
👍Hit like & Follow 👍
CryptoCheck
BINANCE:DOGEUSDT COINBASE:BTCUSD
DOGE Price Increases by 170% in Less Than 2 MonthsDOGE Price Increases by 170% in Less Than 2 Months
On February 1, 2024, the DOGE/USD rate was = 0.0783. On the last Friday of March, it rose to 0.2150. The rising price means Dogecoin is now the eighth-largest cryptocurrency in the world by market capitalization, overtaking Cardano (ADA) and Avalanche (AVAX) in recent days.
The reason for the positive sentiment is the support of the token from Elon Musk.
As the Independent writes:
→ Rumors have intensified that Elon will integrate DOGE into his social network X (Twitter), which he planned to make “an app for everything.” Musk's other companies, SpaceX and Tesla, already support payments in Dogecoin.
→ According to Elon, Dogecoin has the potential to become the main online currency due to its ease of use and efficiency.
→ The billionaire also said that DOGE could become the official currency on Mars if SpaceX can establish a permanent human colony there.
→ The price of DOGE/USD is also supported by the general bullish trend in the cryptocurrency market.
The DOGE/USD chart shows that:
→ the price moves within an uptrend (shown in blue);
→ the price of Dogecoin has overcome the psychological level of $0.2 per coin;
→ the price is near the upper border of the channel - the price action on March 28-29 can be interpreted as an attempt to break through this resistance.
But will this attempt be successful? The RSI indicator may form a bearish divergence - a warning about a possible correction. It is possible that long holders will want to take profits after the impressive growth, which will put pressure on the Dogecoin price, returning it closer to the channel median line.
*At FXOpen UK and FXOpen AU, Cryptocurrency CFDs are only available for trading by those clients categorised as Professional clients under FCA Rules and Professional clients under ASIC Rules respectively. They are not available for trading by Retail clients.
This article represents the opinion of the Companies operating under the FXOpen brand only. It is not to be construed as an offer, solicitation, or recommendation with respect to products and services provided by the Companies operating under the FXOpen brand, nor is it to be considered financial advice.
DOGE Waiting the pullbackI expect a pullback on DOGE. People are really euphoric about Dogecoin, and i expect some liquidity to come out. I think it will retrace and touch again the daily trendline. Here i will wait for a long setup to re enter

DOGE can ascend further!Hi
COINEX:DOGEUSDT
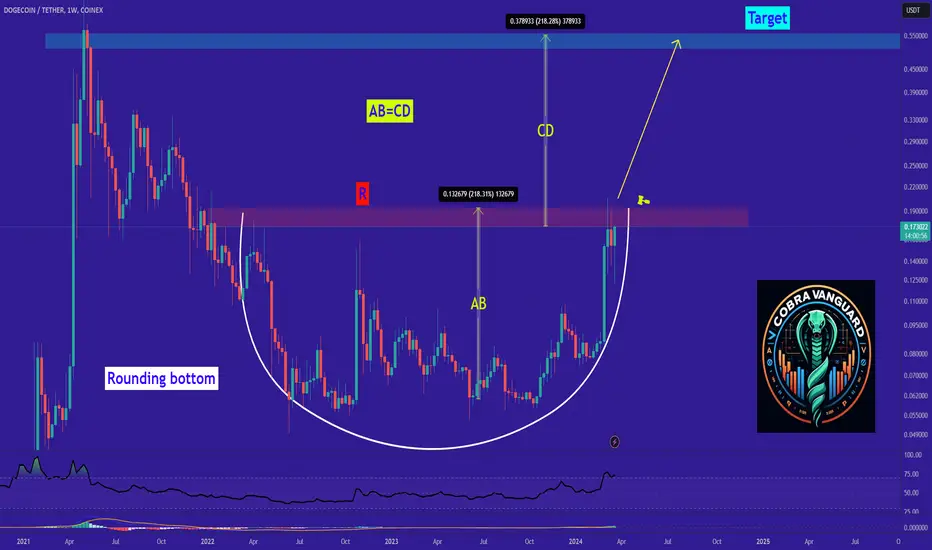
Today, I want to analyze DOGE for you in a weekly time frame so that we can have a mid-term view of DOGE regarding the technical analysis. (Please ✌️respectfully✌️share if you have a different opinion from me or other analysts).
DOGE formed a rounding bottom on weekly timeframe🤔
Up we go if we do breakout
✅ Due to the Ascending structure of the chart...
- High potential areas are clear in the chart.
- AB=CD
- Rounding Bottom
Stay awesome my friends.
_ _ _ _ _ _ _ _ _ _ _ _ _ _ _ _ _ _ _ _ _ _ _ _ _ _ _ _ _ _ _ _ _
✅Thank you, and for more ideas, hit ❤️Like❤️ and 🌟Follow🌟!
⚠️Things can change...
The markets are always changing and even with all these signals, the market changes tend to be strong and fast!!
On large time frame charts when using Fibonacci ratios...Hello traders!
If you "Follow" us, you can always get new information quickly.
Please also click “Boost”.
Have a good day.
-------------------------------------
(DOGEUSD 1M chart)
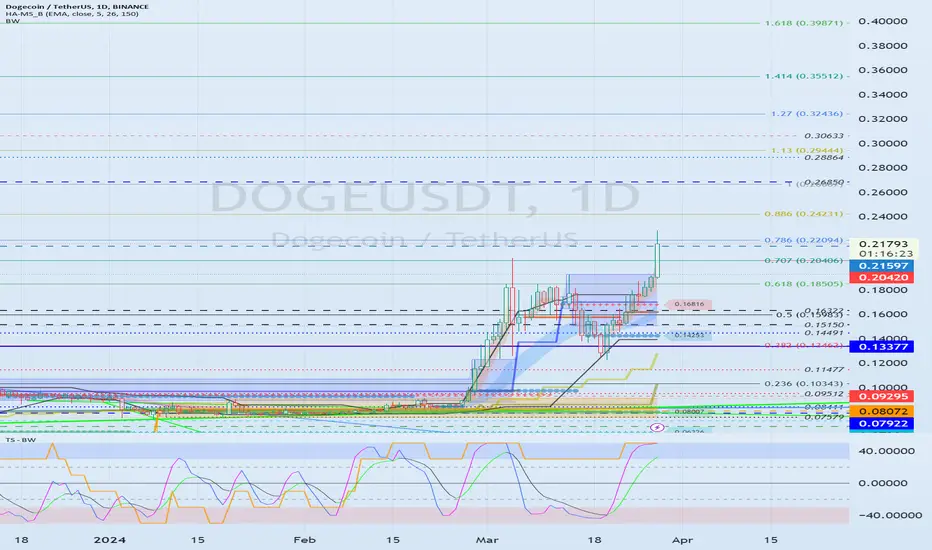
To understand the overall wave, we analyzed it using TradingView's charts.
The key is whether the price can be maintained by rising above 0.22393, which is the upper point of the box section of the HA-High indicator.
Accordingly, we need to check if it is supported and can rise around 0.707 (0.20689) to 0.786 (0.22377).
Due to this rise, it is expected that a new HA-High indicator will be created next month.
If that happens, an important question will be whether it can be supported and rise in the newly created HA-High indicator.
-------------------------------------------------
(DOGEUSDT 1M chart)
Currently, the HA-High indicator is formed at 0.13377.
(1W chart)
The area around 0.5 (0.15983) to 1 (0.26667) corresponds to the psychological resistance zone.
Accordingly, the key is whether the price can be maintained by rising above 1 (0.26667).
If it rises above 1 (0.26667), it is expected to rise to around 1.618 (0.39871).
(1D chart)
The key is whether it can receive support around 0.21597 and rise.
If not, you should check for support around 0.20420.
If it falls below 0.20420,
1st: 0.618 (0.18505)
2nd: 0.5 (0.15983) ~ 0.17001
3rd: 0.13377
You need to check whether you receive support around the 1st to 3rd positions above.
If it falls below 0.13377, it is expected to turn into a downward trend.
-----------------------------------------
Depending on whether it receives support or resistance at the Fibonacci retracement rate point, you can predict whether it will rise by two levels or decline.
Accordingly, if it meets resistance and falls near 0.786, you can expect it to fall to around 0.618 or rise to around 0.886, depending on whether it receives support or resistance around 0.707.
However, Fibonacci has the disadvantage of having to specify a selection point, so if the selection point is specified incorrectly, erroneous results may be obtained, so it is recommended to draw on a time frame chart as large as possible.
This is because I believe that only then can the waves generated by fakes or whipsaws be filtered out.
If you plot Fibonacci on a time frame chart that is too large, you may find it to be of little use due to the intervals being too large.
However, I think there is no problem at all due to the nature of the coin market, which has large fluctuations.
Rather, I think it plays a more accurate role of support and resistance.
Have a good time.
thank you
--------------------------------------------------
- The big picture
The full-fledged upward trend is expected to begin when the price rises above 29K.
This is the section expected to be touched in the next bull market, 81K-95K.
#BTCUSD 12M
1st: 44234.54
2nd: 61383.23
3rd: 89126.41
101875.70-106275.10 (when overshooting)
4th: 13401.28
151166.97-157451.83 (when overshooting)
5th: 178910.15
These are points that are likely to encounter resistance in the future.
We need to see if we can break through these points upward.
Since it is thought that a new trend can be created in the overshooting area, you should check the movement when this area is touched.
#BTCUSD 1M
If the general upward trend continues until 2025, it is expected to rise to around 57014.33 and then create a pull back pattern.
1st: 43833.05
2nd: 32992.55
-----------------