Dogecoin: Trading What You See, Not What You Hope ForThe crypto world is buzzing about the acronym D.O.G.E., with many hoping this hype will ignite a massive price explosion for Dogecoin.
However, the market has repeatedly failed to deliver. In fact, every rally this year has been met with heavy selling.
As I often say, " trade what you see, not what you dream of ." And from a purely technical perspective, what I see for Dogecoin right now doesn’t look promising.
A Look Back: The Trump Pump and the Aftermath
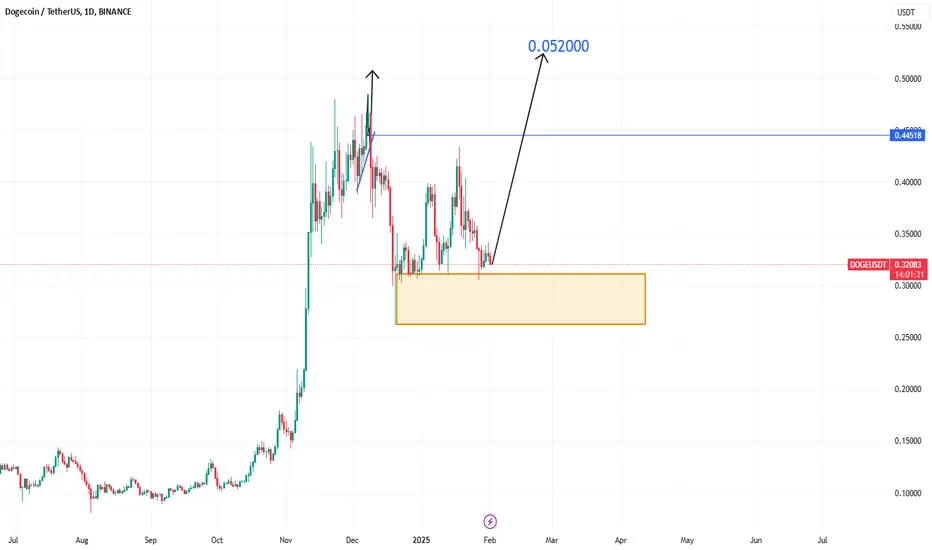
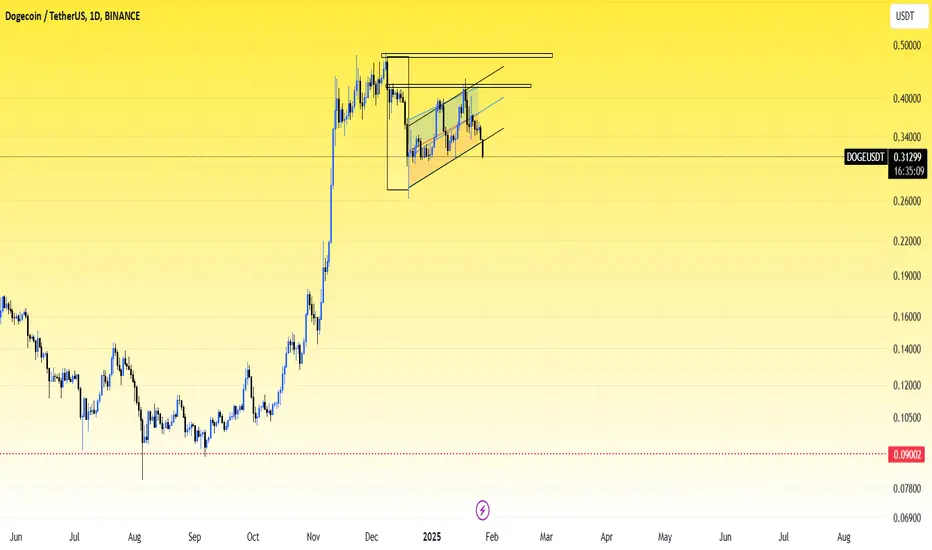
Dogecoin experienced a massive pump last year, fueled by Trump’s presidential election win. But after the initial euphoria, the market cooled down, and Dogecoin entered a correction phase.
Leading up to Christmas, the price even temporarily dipped below the horizontal support level at $0.35. While the start of 2025 brought a recovery above this support, bulls have struggled to maintain their gains.
The Current State of Dogecoin
Even the brief spike two days ago, which initially looked promising, was quickly reversed. As of now, Dogecoin has returned to this critical $0.35 support line, showing continued weakness.
What’s Next?
Given the current price action, my expectation is that this support will eventually give way. If that happens, we could see Dogecoin drop to around $0.26, a level that might offer stronger support.
The Bottom Line
Dogecoin’s technicals suggest caution, not optimism. While the D.O.G.E. hype might tempt some into dreaming of another rally, the charts tell a different story. If you’re trading Dogecoin, stay focused on the reality of the price action and be prepared for potential downside.
As always, trade wisely and stick to the facts, not the fantasies.
Dogecoinanalysis

Dogeusdt
#DOGEUSDT
The entire crypto market is currently experiencing a downturn. It's crucial to wait for confirmation before making any major decisions. Once the trend stabilizes, we can look for potential opportunities to ride the wave with DOGE.
🔹 Key Levels to Watch:
Monitor support and resistance zones for possible reversals.
Look for volume spikes and market sentiment shifts before entering new trades.
🚨 Reminder: Do NOT close any positions yet. Stay patient, manage risk, and wait for a clear breakout signal. The market can shift quickly, so be ready! 🚀🐶
#DOGE/USDT#DOGE
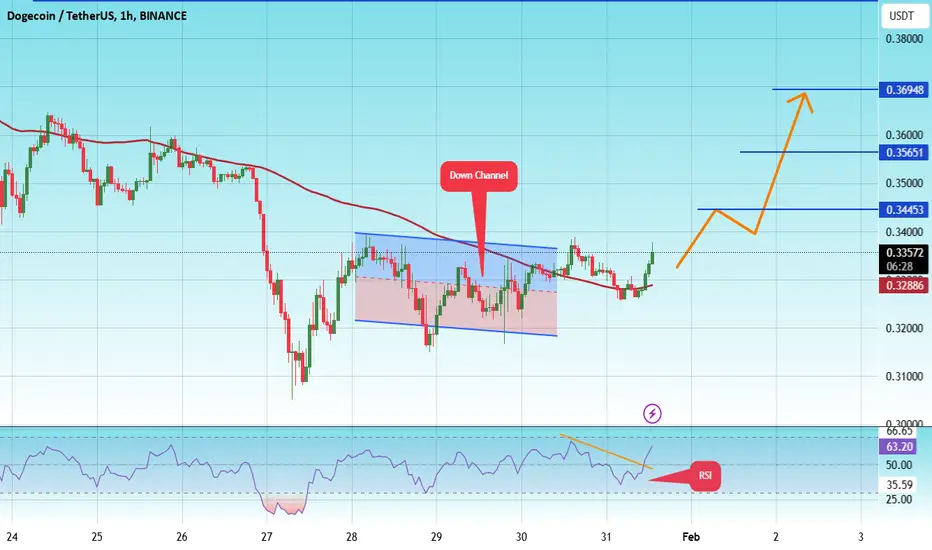
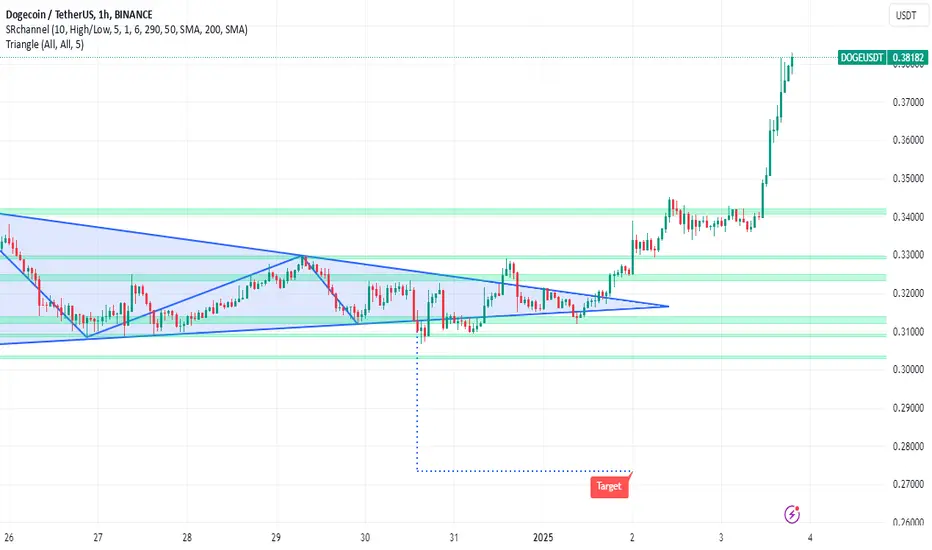
The price is moving in a descending channel on the 1-hour frame and is expected to continue upwards
We have a trend to stabilize above the moving average 100 again
We have a descending trend on the RSI indicator that supports the rise by breaking it upwards
We have a support area at the lower limit of the channel at a price of 0.3200
Entry price 0.3360
First target 0.3445
Second target 0.3565
Third target 0.3700
Dogecoin at Key Support: Trend Analysis & Next Moves for DOGE👀 👉 In this video, we dive deep into Dogecoin (DOGE) paired with USDT, examining its trend, market structure, price action, key support and resistance levels, and the impact of liquidity on the markets. At the moment, DOGE is trading near a critical support level. With the bearish break in market structure, we explore potential ways to engage if the downtrend persists. Everything is covered in detail here. Please note, this is not financial advice.

DogecoinDoge usdt Daily analysis
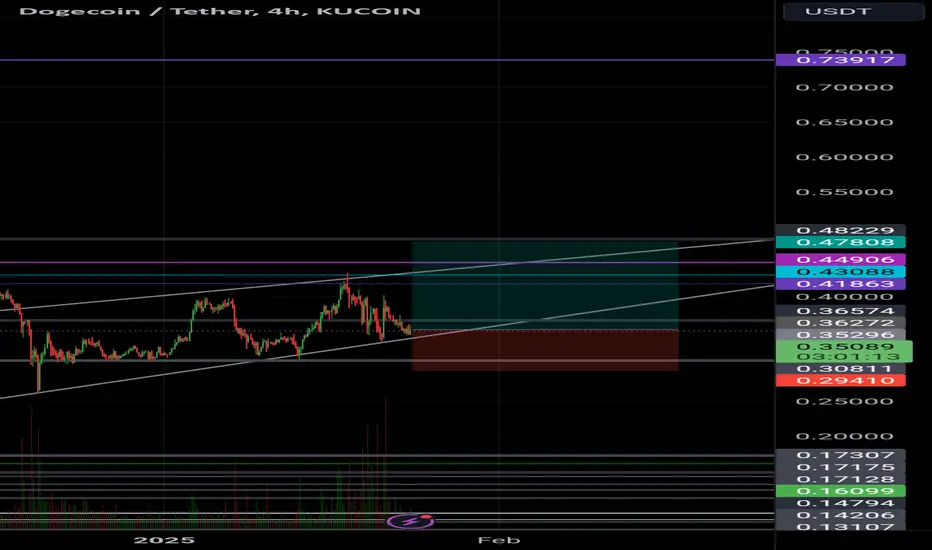
Time frame 4hours
Risk rewards ratio >2
Dogecoin always has a good volume in the market
Investors know that Musk is interested in Dogecoin, and this is a positive point for this currency. The currency was created as a joke but found its place and now Doge has drawn a clear path for itself and for enthusiasts.
The price is now fluctuating in an ascending triangle. It's very dangerous if market crashed down but I think sentiment of market is positive after Trump.
Of course we must be careful
So my target is not dreamy
I am watching the market and waiting for suitable time to enter again for higher target on 0.73 $
Will the support level of 0.31097 be broken ?Breaking the range specified in the previous analysis and correcting the price to the lower range
DogeCoin (DOGE) To Mars - The Elon Ride (Part 2)COINBASE:DOGEUSD has been loyal to me previously.
I managed to get some good Buys on #DOGE.
I aped continuously on the 7 Cents Levels.
Then cashed all my COINBASE:DOGEUSD earnings at the 42 Cents #Resistance.
* all well documented in the related idea.
What Happened To BINANCE:DOGEUSDT ?
It provided to #Correction I was predicting.
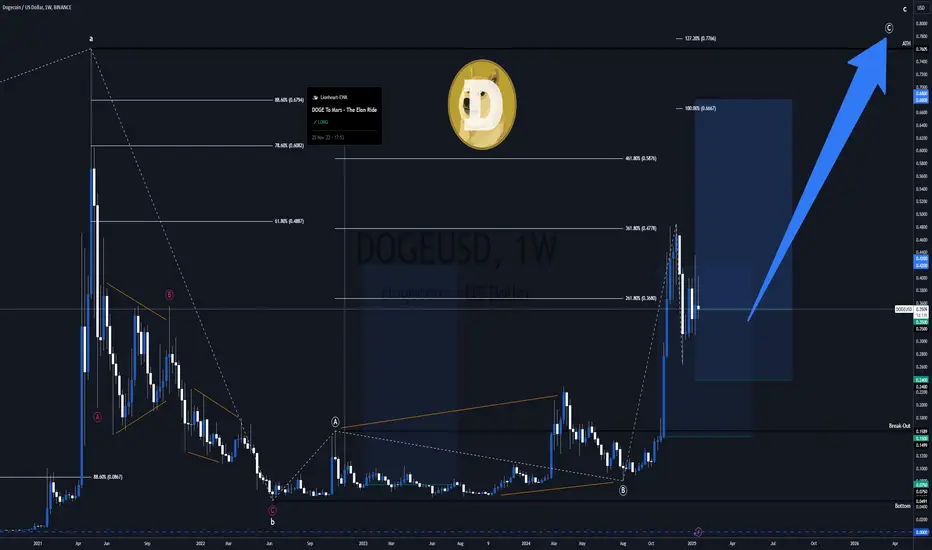
From a #Fibonacci perspective, it's enough to be considered as an #ElliottWave 2.
What's Next For BINANCE:DOGEUSDC ?
$DogeCoin follows MARKETSCOM:BITCOIN and the #Altseason.
With BITSTAMP:BTCUSD about to burst again, so will #DOGECOIN.
It might go #Bull now, or Dip and then... so please DYOR.
The #Bullish move would also be provided by CRYPTOCAP:TOTAL3 & CRYPTOCAP:OTHERS , as a new #ATH is in play.
* see related ideas for more details.
COINBASE:DOGEUSD #TechnicalAnalysis
- #ElliottWave A-B-C Sequence
- #Impulse / #MotiveWave in Primary ⓒ (white)
- #Fibonacci Retracements & Extensions Confluence
My #HODL #Long Levels For BINANCE:DOGEUSDT
I will only go #HODL for this #Crypto #Token.
Trading #Futures ( BINANCE:DOGEUSDT.P ) is not something I want to pursue with $DOGE.
Moderate Entry @ 35 Cents
Conservative Entry @ 24 Cents
TP @ 68 Cents
DOGE Analysis: Unpacking Liquidity & the Battle at Support👀 👉 In this video, we take an in-depth look at Dogecoin (DOGE) paired with USDT. We analyze the trend, market structure, price action, key support and resistance levels, and the role liquidity plays in the markets. Currently, DOGE is trading at a significant support level. On the daily timeframe, there's a case for higher highs and higher lows, while the weekly chart shows bearish pressure over the past week. The big question is: where does it go next? We unpack it all in this video. This is not financial advice.

An Educational Journey into Technical Analysis with Dogecoin/USDIn this tutorial, we'll dive deep into the art of technical analysis using the Dogecoin USD chart as our canvas. You'll discover how to blend Fibonacci tools, Elliott Wave Theory, and the Wyckoff Method to forecast potential market movements. Whether you're new to trading or looking to refine your analytical skills, this guide will provide you with practical insights into identifying entry and exit points, understanding market phases, and preparing for future trends. Let's embark on this educational journey together to enhance your trading strategy toolkit.
When in doubt, Zoom Out!
Below I was looking at Arguments for a Significant Short Position Before the Continuation of the Bullish Trend and the Pursuit of New All-Time Highs
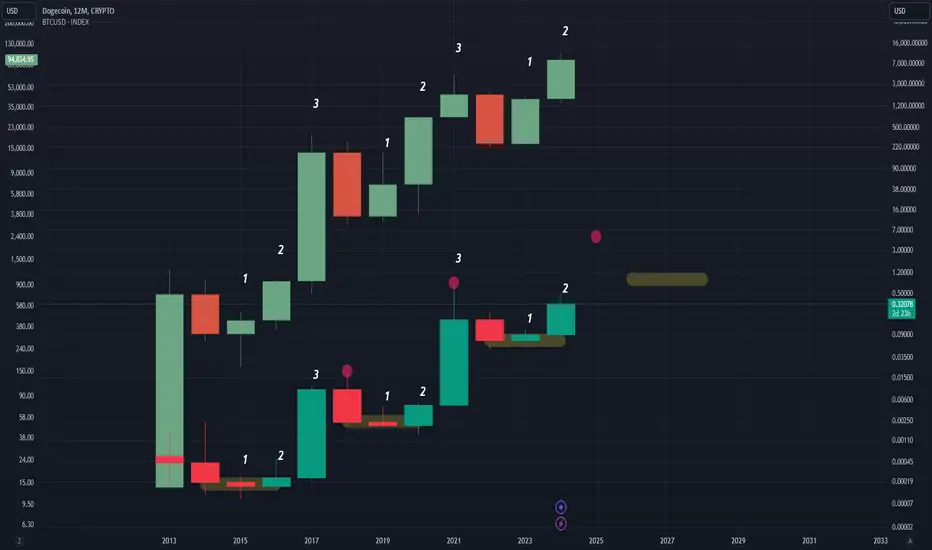
Elliott Waves: From the bear market bottom at 4.5 cents, we started wave 1 and concluded with wave 5 at the current top. Following five waves, we expect an ABC correction. Waves A and B have been completed, and we are now in wave C.
Fibonacci 1: Trend-Based Fibonacci Extension - From the all-time high (ATH) to the recent bear market bottom, then to the current 48-cent top. The 0.382 Fibonacci level suggests a target of 0.2130 for the upcoming drop, which I believe is necessary for liquidity ahead of the next upward movement.
Fibonacci 2: Regular Fibonacci Retracement - From the bottom of wave 4 to the top of wave 5, the 0.618 level is at 0.235 cents. I've marked a green box between these two targets.
See in the image below how Backtesting this strategy on the two previous cycles shows that before breaking ATHs, Dogecoin always hit this 0.382 Fib level!
I use these 2 Fibonacci targets to place the green box between them and where I expect price to go in the newxt couple of weeks.
Additional Observation: The green line below the 0.618 Fib retracement and above the 0.382 trend-based Fibonacci extension also marks a retest of the wave 3 high at 0.23 cents.
Now that we've examined the macro perspective, let's Zoom In to the current action:
Wyckoff Schematic: Check my previously published idea on Bitcoin, linked here, where Bitcoin is in a Wyckoff Distribution Schematic #1. Dogecoin seems to follow with Wyckoff Distribution Schematic #2. I've added vertical lines for phase separation, a red resistance box, and a green support box.
Link to Richard D. Wyckoff, his Method and Story www.wyckoffanalytics.com .
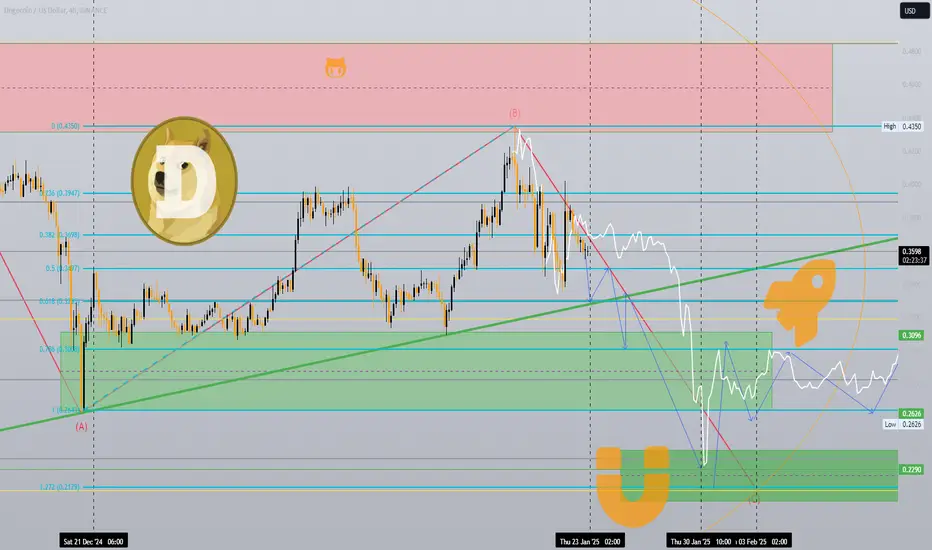
ABC Pattern: Wave A from top to bottom is exactly 0.222 cents or -45.81%, suggesting wave C should be of similar magnitude. Wave B measures 0.1724 cents and 65.65% to the upside. Using an arrow tool, the 0.222 cent drop points exactly to the 0.382 Fibonacci target from the trend-based extension we did in the macro analysis, now highlighted in yellow. Link to chart.
Zooming in on the 4-hour Chart: I've drawn another Fibonacci retracement just for wave B, colored in turquoise blue. Notably, the 1.272 Fibonacci extension aligns with our macro 0.382 Fibonacci target, now colored yellow for clarity.
Speculations for Future Moves:
Fibonacci Circle and bottom timing prediction: Drawn from A to B, this circle in orange might help us predict when we hit the green box target at the bottom. Considering that the A drop measures exactly 12 days and 4Hours I have added another vertical line now marking a timeframe of 5 days from Thursday 30 January to Monday 3 February 2025 This is speculative but worth watching. It includes also a weekend so a CME gap before weekend plus filling the week after could also be in play.
Wyckoff Phases: According to earlier discussions, we're moving through phases A to E. I've added a vertical line where the Fib circle crosses our 1.272 and 0.382 Fib levels, suggesting we'll enter phase E on January 23, 2025, potentially concluding by February 2, 2025.
Predictive Arrows: Blue arrows indicate possible future price movements based on current patterns.
After hitting our target, I'll analyze again and publish a new idea with plans for breaking the ATH and targets for the anticipated bull market.
Enough for now, as it's getting late. Give me a follow, share if you liked this analysis, and stay tuned for updates.
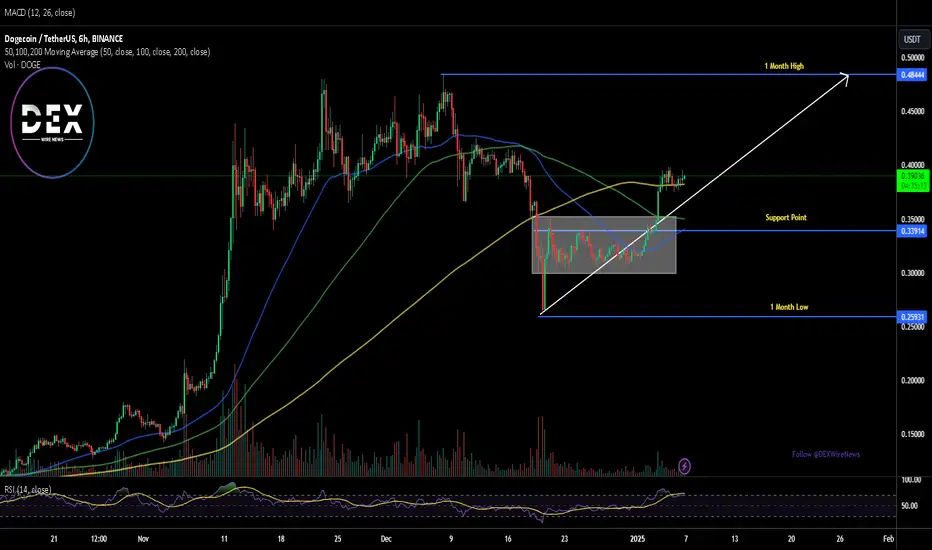
Dogecoin Set to Surge 30% Amidst D.O.G.E. Launch RumorsDogecoin (DOGE), the iconic memecoin, is making headlines once again. Recent media reports suggest that the Department of Government Efficiency (DOGE) has launched an official website, allegedly featuring the Dogecoin logo as its avatar. While unconfirmed, this development has sparked significant interest and has already caused a 10% price surge within minutes.
The Big Reveal: DOGE and the Government Efficiency Department
The purported launch of the DOGE department’s official website, (doge.gov), is a potential game-changer for Dogecoin. If true, the alignment of a U.S. government entity with Dogecoin could propel the cryptocurrency to unprecedented heights. The memecoin community is abuzz with speculation, and we predict a 30% surge, forecasting a potential climb to $1 this week, assuming favorable market conditions.
This rumor alone underscores the influence of strong fundamentals on Dogecoin’s market dynamics. The adoption of Dogecoin’s mascot by a government entity could cement its position as more than just a memecoin, bringing it closer to mainstream acceptance.
Technical Analysis:
Dogecoin’s technical indicators paint an equally bullish picture:
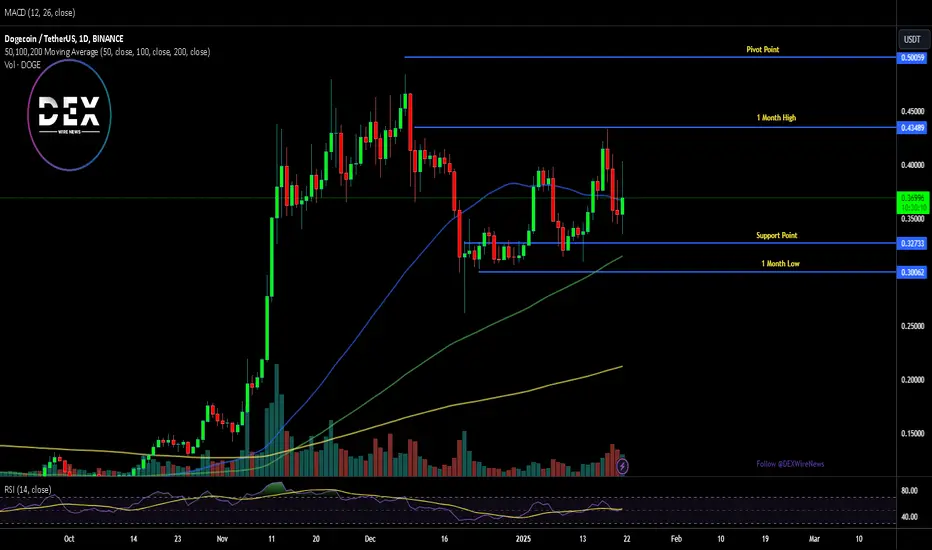
1. Relative Strength Index (RSI): Currently at 53, the RSI suggests that CRYPTOCAP:DOGE is neither overbought nor oversold, positioning it for a potential upward trend.
2. Volume Consolidation: Recent consolidation in trading volumes indicates an accumulation phase, often a precursor to a significant price movement.
3. Key Resistance Levels: A break above the one-month high of $0.43 could ignite a bullish spree, potentially setting the stage for a rally to $1.
4. Bullish Pattern: The 6% intraday price increase forms a bullish engulfing pattern, signaling strong buying momentum.
Dogecoin’s Resilience and Appeal
Dogecoin’s origins as a light-hearted, community-driven cryptocurrency have always set it apart. Created in 2013 by Billy Markus and Jackson Palmer, the Shiba Inu-themed coin quickly gained traction as a fun alternative to Bitcoin. Its accessibility and widespread appeal have made it a favorite among retail investors and crypto enthusiasts alike.
Elon Musk’s support has further amplified Dogecoin’s popularity. As a vocal proponent, Musk’s tweets often trigger significant price movements, underscoring his influence on the cryptocurrency.
Live Market Data
- Current Price: $0.374961
- 24-Hour Trading Volume: $10,393,354,812
- Market Cap: $55,387,458,154
- Circulating Supply: 147,715,336,384 DOGE
- 24-Hour Performance: Up 1.10%
Conclusion: Is Dogecoin Ready for the Next Big Leap?
Dogecoin’s recent developments and technical indicators suggest a bullish outlook. The rumored association with the Department of Government Efficiency could provide the fundamental catalyst needed to propel DOGE into a new phase of growth. Coupled with favorable technical signals, Dogecoin is poised for a trend reversal that could lead to significant gains.
Investors and traders should keep a close eye on key resistance levels and market sentiment in the coming days. If the rumors prove true, Dogecoin’s journey from a meme to a mainstream cryptocurrency may reach new heights.
DOGE Potential 40% Increase
Current Price Action:
Dogecoin is trading at a critical support zone around $0.39, which previously acted as resistance. After breaking out of a rising wedge, the price retested the support, forming a potential base for another rally.
📈 Why a 40% Increase is Possible:
1️⃣ Strong Support Levels: The $0.38–$0.39 zone shows buying interest, creating a foundation for upward momentum.
2️⃣ Key Resistance Levels: A move above $0.42 could open the path toward $0.55, representing a ~40% increase from current levels.
3️⃣ Market Sentiment: Increased trading volume and positive momentum across the crypto market could further fuel DOGE's rally.
📌 What to Watch For:
Confirmation of support holding at $0.38.
Breakout above $0.42 for bullish continuation.

Doge LMACD going above 0 on the daily Gaussian has held so far and LMACD is moving above the 0 line on the daily. Bueno

Doge's Journey to the MOON? $1.42 and Beyond Morning Trading Family
Hold onto your leashes, traders! If our 30 cents at supports holds firm, we're in for an epic ride:
First Stop: 50 cents - A nice little hop.
Next Leap: 61 cents - The momentum builds.
Gearing Up: 83 cents - We're picking up speed.
Moonshot: $1.42 - Aim for the stars!
Keep your eyes on the charts, and let's see where this meme coin takes us next!
If you found this useful: boost, share, like, and comment. I appreciate all the support! If you're struggling as a trader, I get it - I've been there myself. Jump in, send me a DM or head to my profile; I'm more than happy to help.
Kris/Mindbloome Exchange
Trade What You See

DOGE | BTC | ATH Still Coming Like ETH and SOL, DOGE hasn't exactly made the dramatic ATH that Bitcoin has made - and we're still waiting for the glorious Altseason.
Like I explained in the previous idea, this isn't a bad thing and neither does it indicate the end of the bullish season - instead, it likely points towards a multi-month playout that eventually leads the Alts to new highs.
______________________
BINANCE:DOGEUSDT BINANCE:BTCUSDT

DOGE Update - Market Structure, Key Levels & Trade Opportunities👀 👉 In this video, we analyze DOGE's recent market structure break, driven by strong momentum that hints at institutional interest. 📊 Discover crucial support and resistance zones, identify liquidity areas, and explore potential trade setups based on our findings. Whether you're a seasoned trader or just getting started, this analysis provides valuable insights to enhance your trading decisions. ⚠️ This content is for educational purposes only and does not constitute financial advice.

Dogecoin Whales Buy 140M Coins: Signals of a Price Surge?Dogecoin (DOGE), the beloved dog-themed meme coin, has once again captured the crypto market's attention. Whales, or large-scale investors, have recently acquired 140 million DOGE, sparking optimism and speculations of a significant price rally. W
The Role of Whales and Market Dynamics
In the last 24 hours, Dogecoin whales have embarked on a buying spree, amassing 140 million DOGE tokens. This large-scale accumulation has not only heightened buying pressure but also reinvigorated market enthusiasm.
Adding to the excitement, Elon Musk’s plans for X Money, a payment platform integrated with his social media platform X, have further fueled speculation. The initiative is expected to introduce cryptocurrency support, potentially including Dogecoin, Bitcoin, and Tether (USDT). While official details remain scarce, the parallels to China’s WeChat suggest a transformative use case for Dogecoin in digital payments. This development aligns with Musk’s history of influencing DOGE’s market trajectory, providing a solid fundamental backdrop for optimism.
Technical Analysis
At the time of writing, CRYPTOCAP:DOGE is trading at $0.390, marking a 2.23% intraday increase. The coin’s price action has broken out of a consolidation pattern, forming a bullish engulfing candlestick. This breakout signifies renewed upward momentum, further supported by strong technical indicators:
1. Relative Strength Index (RSI): Currently at 70.55, the RSI suggests that DOGE is in overbought territory. While this indicates strong buying interest, it also calls for caution as a potential retracement may be on the horizon.
2. Fibonacci Retracement Levels: Immediate support lies at the 65% Fibonacci retracement level. This zone serves as a critical threshold for traders, providing a foundation for potential price stabilization before the next upward move.
3. Pivot Points: DOGE’s one-month high at $0.48 is a key resistance level. A breakout above this pivot point could trigger a bullish continuation pattern, potentially paving the way for a price surge.
DOGE’s technical and fundamental landscape suggests a bullish trajectory. If whales continue their accumulation spree and Musk’s X Money initiative gains traction, DOGE could easily surpass the $0.48 resistance level. From there, the next significant target would be a 70% rally, pushing the price closer to $0.60 or beyond.
However, traders should remain vigilant. The overbought RSI indicates the possibility of short-term pullbacks, offering strategic entry points for long-term holders. Monitoring the 65% Fibonacci retracement level as immediate support and the $0.48 pivot point as resistance will be crucial in navigating DOGE’s next moves.
Conclusion
Dogecoin’s recent whale activity and promising fundamental developments signal a potentially explosive period for the meme coin. With massive gain on the horizon, driven by strong market dynamics and technical indicators, DOGE is set to remain a focal point for traders and investors alike. As always, market participants should balance optimism with caution, ensuring informed decisions in the ever-volatile crypto landscape.
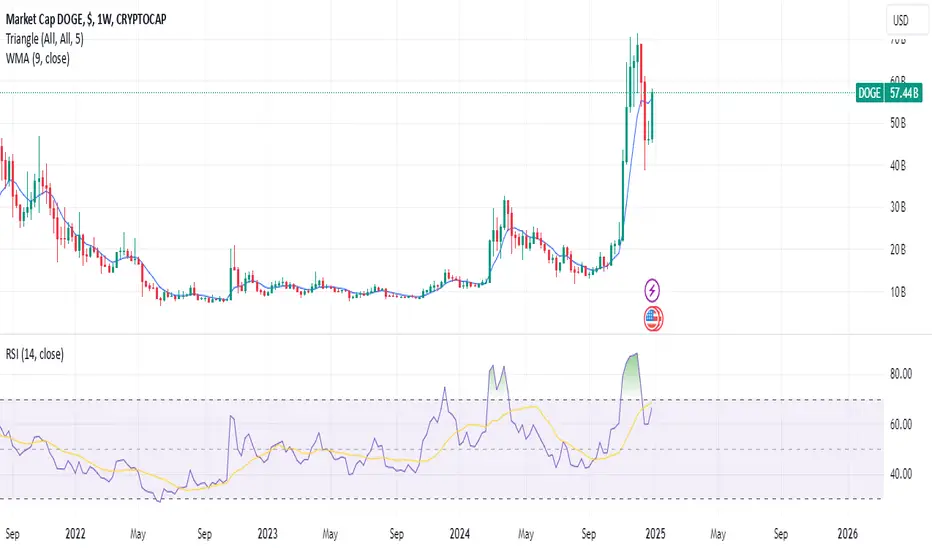
Dogecoin's Potential Resurgence: A Technical and Market AnalysisDogecoin, the meme-inspired cryptocurrency that has captured the attention of investors and enthusiasts alike, has recently shown signs of a potential resurgence. With its weekly Relative Strength Index (RSI) approaching the Moving Average (MA) line and recent price action suggesting fresh highs, the question on everyone's mind is: can Dogecoin resume its uptrend and break its all-time high (ATH) of $0.74? This article delves into the technical analysis, market trends, and underlying factors that could influence Dogecoin's price trajectory.
Technical Analysis: RSI and Price Action
The Relative Strength Index (RSI) is a momentum indicator used in technical analysis that measures the magnitude of recent price changes to evaluate overbought or oversold conditions in the price of a stock or other asset. When the RSI approaches the MA line, it often signals a potential shift in momentum. In Dogecoin's case, the weekly RSI approaching the MA line suggests that the cryptocurrency may be transitioning from a period of consolidation or correction to a renewed uptrend.
Furthermore, recent price action has been encouraging for Dogecoin enthusiasts. The cryptocurrency has shown signs of strength, with price movements suggesting the possibility of breaking through resistance levels and establishing fresh highs above $0.75. This positive price action, coupled with the RSI approaching the MA line, paints a bullish picture for Dogecoin's near-term future.
Market Trends and Influencing Factors
Several factors could be contributing to Dogecoin's recent surge and potential for further growth:
1. Increased Adoption and Utility: Dogecoin has seen increased adoption as a form of payment by various merchants and businesses. This growing utility adds real-world value to the cryptocurrency and could drive demand.
2. Social Media and Community Support: Dogecoin's strong community and social media presence play a significant role in its price movements. Positive sentiment and viral trends can lead to increased buying pressure and price appreciation.
3. Broader Cryptocurrency Market Trends: The overall health of the cryptocurrency market can also impact Dogecoin's price. A bullish trend in the broader market often lifts the prices of various cryptocurrencies, including Dogecoin.
4. Celebrity Endorsements and Influencer Marketing: Dogecoin has benefited from endorsements by celebrities and influencers, which can generate significant buzz and attract new investors.
Can Dogecoin Break its ATH?
While technical indicators and market trends suggest a positive outlook for Dogecoin, breaking its ATH of $0.74 will require sustained momentum and overcoming key resistance levels. The cryptocurrency has faced significant volatility in the past, and it is essential to consider the risks involved.
However, if Dogecoin can maintain its current trajectory, capitalize on positive market sentiment, and continue to grow its adoption and utility, breaking its ATH is a realistic possibility.
Conclusion
Dogecoin's recent price action and technical indicators suggest a potential resurgence for the meme-inspired cryptocurrency. With its weekly RSI approaching the MA line and price movements indicating fresh highs, Dogecoin could be poised for a renewed uptrend.
While breaking its ATH of $0.74 will be a significant challenge, the cryptocurrency's strong community, growing adoption, and positive market trends could provide the necessary impetus. As always, it is crucial to conduct thorough research and exercise caution when investing in cryptocurrencies, considering the inherent risks and volatility of the market.
DOGE Rally: Key Levels, Liquidity Zones & Trade Opportunities👀💡 In this video, we take an in-depth look at DOGE. The analysis reveals that DOGE has broken market structure with significant momentum, suggesting strong institutional interest. We explore key support and resistance levels, identify areas of liquidity, and discuss potential trade opportunities. As always, this content is for educational purposes only and should not be considered financial advice. 🚀

Dogecoin Price Confirms Breakout: Analyst Sets New Price Targets
Dogecoin (DOGE), the original meme coin that captured the imagination of the crypto world, has recently shown signs of a significant breakout, prompting analysts to revise their price targets.2 After a period of relative stagnation, Dogecoin has demonstrated renewed momentum, breaking through key resistance levels and signaling a potential shift in market sentiment.3 This article explores the factors contributing to this breakout, the significance of the new price targets, and the broader context of Dogecoin's place in the evolving cryptocurrency landscape.
Understanding the Breakout
In technical analysis, a breakout occurs when the price of an asset moves decisively above a key resistance level or below a key support level.4 These levels are identified by analyzing historical price data and represent areas where the price has previously struggled to move past.5 A breakout signifies a potential change in the prevailing trend, suggesting that the asset is likely to continue moving in the direction of the breakout.6
Dogecoin's recent price action has confirmed a breakout above a significant resistance level, indicating strong buying pressure and a potential shift from a bearish or sideways trend to a more bullish outlook. This breakout is a crucial development for Dogecoin holders, as it suggests that the cryptocurrency may be poised for further gains.
Factors Contributing to the Breakout
Several factors could be contributing to Dogecoin's recent resurgence. While attributing specific causes in the volatile crypto market can be challenging, a combination of influences likely plays a role:
• Renewed Community Engagement: Dogecoin has a strong and dedicated community that has been instrumental in its past successes.7 Renewed engagement and activity within the community can contribute to increased awareness and demand for the cryptocurrency. Online discussions, social media campaigns, and community-driven initiatives can all contribute to positive price movement.
• Broader Market Sentiment: The cryptocurrency market is often influenced by the overall sentiment surrounding Bitcoin and other major cryptocurrencies.8 When the market experiences a general uptrend, altcoins like Dogecoin can also benefit from the positive momentum. The current market conditions may be contributing to the renewed interest in Dogecoin.
• Potential Integrations and Adoption: While still primarily known as a meme coin, Dogecoin has seen some instances of adoption for payments and other use cases.9 Any news or speculation regarding further integrations or adoption by businesses or platforms can contribute to positive price action.
• Whale Activity: Large holders of Dogecoin, often referred to as "whales," can have a significant impact on the cryptocurrency's price. Large buy orders from whales can trigger significant price movements, contributing to breakouts and rallies.
Analyst Price Targets: A Sign of Confidence
Following Dogecoin's confirmed breakout, several analysts have revised their price targets for the cryptocurrency.10 These price targets represent predictions of where the price of Dogecoin could move in the near to medium term.11 While these targets are not guarantees, they reflect the analysts' assessment of the current market conditions and Dogecoin's potential.
The new price targets set by analysts indicate a growing confidence in Dogecoin's potential for further growth. These targets can act as psychological levels for traders and investors, influencing their trading decisions and contributing to market momentum.
The Significance of Dogecoin in the Crypto Landscape
Dogecoin occupies a unique position in the cryptocurrency world. It originated as a lighthearted joke but has since evolved into a significant player in the market.12 Its strong community, low transaction fees, and relatively fast transaction times have contributed to its popularity.13
While often dismissed as a meme coin, Dogecoin has demonstrated its resilience and ability to generate significant price movements.14 Its continued presence in the market highlights the dynamic and unpredictable nature of the cryptocurrency space.
Challenges and Future Outlook
Despite the recent breakout and positive price targets, it's important to acknowledge the challenges that Dogecoin may face. The cryptocurrency market is highly volatile, and sudden price swings are always a possibility.15 Dogecoin's reliance on community sentiment and social media hype can also make it susceptible to rapid changes in market dynamics.
Furthermore, Dogecoin faces competition from other cryptocurrencies with more advanced technology or specific use cases. Its long-term success will depend on its ability to evolve and adapt to the changing landscape of the cryptocurrency market.
However, the recent breakout and the positive price targets set by analysts suggest that Dogecoin still has the potential for further growth. The cryptocurrency's strong community and unique position in the market could contribute to its continued success.
Conclusion
Dogecoin's confirmed breakout represents a significant development for the cryptocurrency.16 The factors contributing to this breakout include renewed community engagement, broader market sentiment, potential integrations, and whale activity. The new price targets set by analysts reflect a growing confidence in Dogecoin's potential. While challenges remain, the cryptocurrency's unique position and strong community could contribute to its continued success in the evolving cryptocurrency landscape.
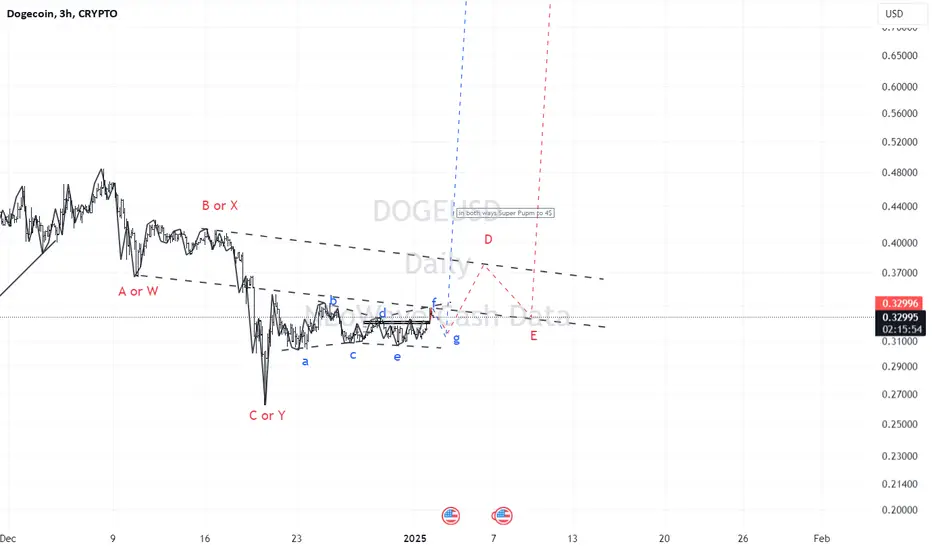
Doge(based on NEo wave)last counting failed but there is these 2 bullish scenarios for doge and I think soon we will see a dog which can fly!
one of the ways is complex corrective wave which contains WXY waves and the other one is triangle with ABCDE waves.
in short term the bow tie diametric with G wave (which is not formed yet), I prefer to buy more on G wave.
Doge above the Gaussian on the MonthlyOnce the price goes above the Gaussian channel on the monthly is an indication of the bull market phase. I will tell you once more do not find the trend!
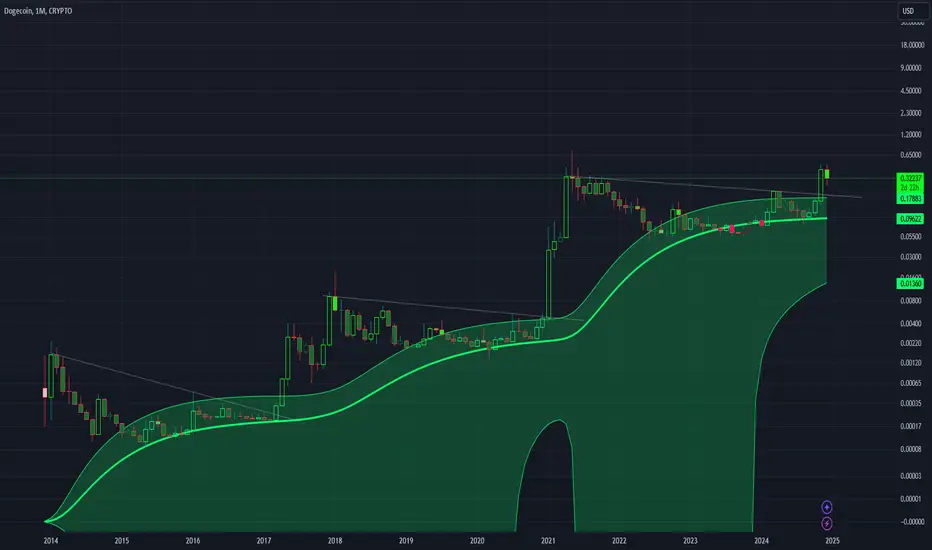
Bright times ahead folks!Dont fight the trend, dont fight gaussian. Keep accumulating you impatient people. Trying to predict Gaussian in the next months. Cheers!

May the 2025 be a great year for Doge and BTC!Happy Holidays! As you can see the next year we might be the top candle for this bull market cycle. Enjoy the ride