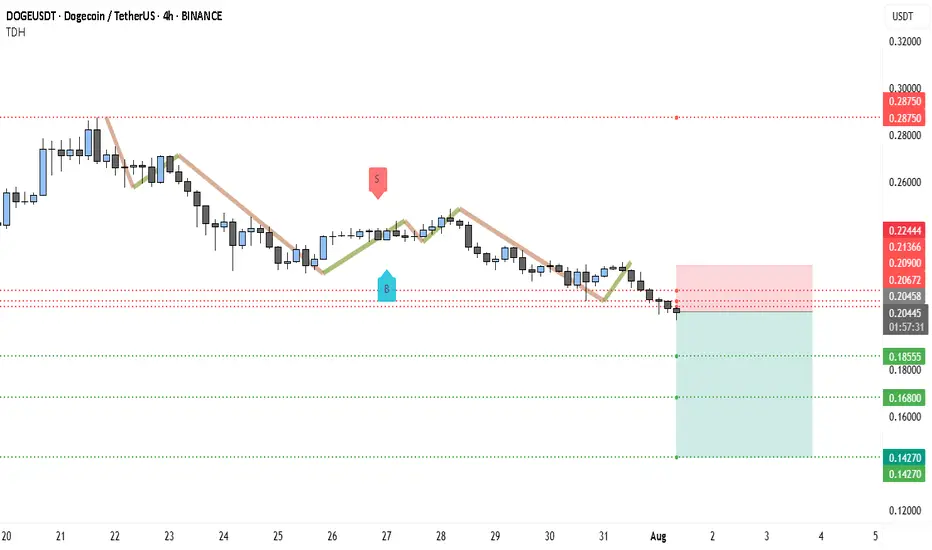
Bears Target $0.14 DOGE — Is the Trend Your Friend?DOGEUSDT has been in a clear downtrend since late July, printing consistent lower highs and lower lows. The current market structure shows sellers firmly in control, with every bullish bounce quickly fading. The recent rejection near $0.2244 and the inability to sustain above the $0.21 zone highlight persistent selling pressure.
At the moment, DOGE is hovering around $0.2043, just under a short-term resistance band between $0.2067 and $0.2090. This area has acted as a rejection point in the last few sessions, suggesting that unless bulls can break above it with strong volume, the path of least resistance remains downward. Below, the first major support sits at $0.1855. If that breaks, the selling could accelerate toward $0.1680, a level that aligns with a previous consolidation base from June. In an extended decline, $0.1427 comes into view as a long-term support level that previously acted as a strong demand zone.
The chart also shows an active short trade setup in play:
• Entry: $0.2043
• Stop-Loss: $0.2244
• Targets: TP1 at $0.1855, TP2 at $0.1680, and TP3 at $0.1427
From a risk-reward perspective, this setup remains attractive, especially if the price breaks below $0.1855. However, traders should watch for any bullish invalidation signs — a close above $0.2136 could challenge the short bias, while a sustained break above $0.2244 would signal a possible trend shift. Until then, the broader technical picture still favors the bears.
Dogeshortsetup
DOGE Short Setup in Play—Targeting $0.13258 and $0.08840The broader price structure of DOGEUSDT continues to reflect a clear downtrend, with price consistently printing lower highs and lower lows. This trend is well-respected, as shown by the descending blue trendline, which has acted as dynamic resistance since early 2025.
In late April to early May, DOGE saw a sharp rally, briefly breaking above the trendline. However, this move turned out to be a false breakout against the trend, highlighted on the chart with a label and visual marker. The breakout failed to sustain above resistance and quickly reversed, trapping bullish traders and reaffirming the bearish dominance. This type of price action often signals a bull trap, and in this case, the reversal was swift and aggressive.
The price has since declined and is currently trading around the $0.18258 region, hovering just below the local resistance and just above the initial support levels.
Key Levels Observed on the Chart
• Stop-Loss / Resistance Zone:
The red resistance area around $0.20930–$0.22643 marks a critical stop-loss zone for any short positions. This is the top boundary where the false breakout failed and where sellers previously regained control.
• Entry / Decision Zone:
Price is currently within a small neutral box (shown in light blue), indicating a potential short entry zone as price consolidates below resistance.
• Key Support Level 1 / Take Profit 1:
$0.13258 – This level has been labeled as the first major support and serves as the initial take-profit zone for short setups. Historically, this zone has held price during strong down moves, and it aligns well with past structure.
• Key Support Level 2 / Take Profit 2:
$0.08840 – The second support level is marked as a deeper profit target for continuation of the downtrend. This level is closer to multi-month lows and reflects potential bearish extension.
• Final Support Base:
$0.05000 – This level is the lowest green horizontal line on the chart, showing long-term structural support. If macro conditions worsen, this remains a plausible downside target.
Detrended Price Oscillator (DPO) Indicator
The DPO reading remains below zero at approximately –0.04, reinforcing the bearish momentum. The indicator does not show any bullish divergence, suggesting that there’s currently no sign of an upward reversal forming. The gradual downward slope of the DPO supports the probability of a continuation move to the downside.
Trade Setup (Short Bias)
• Entry Zone: $0.18258 – $0.18546 (current price range just under resistance)
• Stop-Loss: $0.20930 (above key resistance where breakout failed)
• Take Profit 1: $0.13258
• Take Profit 2: $0.08840
• Extended Bearish Target: $0.05000
Conclusion
DOGEUSDT continues to respect its long-term bearish structure, and the recent false breakout further validates the dominance of sellers. The failed attempt to reverse the trend above $0.20930 provides a well-defined stop for short setups, while the clean stair-step structure of support levels offers logical take-profit zones.
Unless DOGE manages to close above the $0.20930–$0.22643 resistance band with strong follow-through, the current bias remains bearish. Traders can monitor for short opportunities while protecting capital above the invalidation zone.

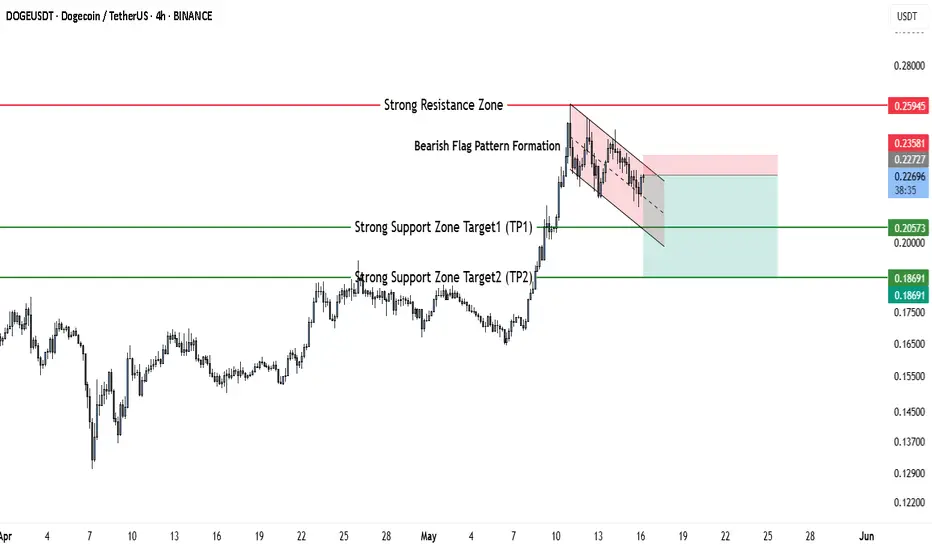
Short DOGEUSDT With Confidence – Bearish Setup + Targets🔍 Technical Analysis Summary
Pattern: Bearish Flag (Bearish Continuation)
Resistance Zone: Around 0.25945 USDT
Price Channel: Price is consolidating inside a descending flag channel after a sharp upward move.
Potential Breakdown: If price breaks below the lower trendline of the flag, continuation to the downside is expected.
📉 Trade Setup (Short Position)
Entry Point: Around 0.22534 USDT (at or just below the flag's lower trendline to confirm breakdown)
Stop Loss: Around 0.23581 USDT (above the upper flag boundary for invalidation)
Take Profit Targets:
o TP1: 0.20573 USDT (first strong support zone)
o TP2: 0.18691 USDT (second strong support zone)
✅ Risk-Reward Ratio Analysis
Entry: 0.22534
Stop Loss: 0.23581 → Risk: ~1.05 cents
TP1: 0.20573 → Reward: ~1.96 cents → RR ≈ 1.86:1
TP2: 0.18691 → Reward: ~3.84 cents → RR ≈ 3.66:1
📌 Conclusion
This bearish flag setup on DOGEUSDT presents a strong opportunity for a short position. A confirmed breakdown below the flag pattern could lead to a test of the strong support zones marked. It's a good setup with a favorable risk-reward ratio, especially if TP2 is reached.
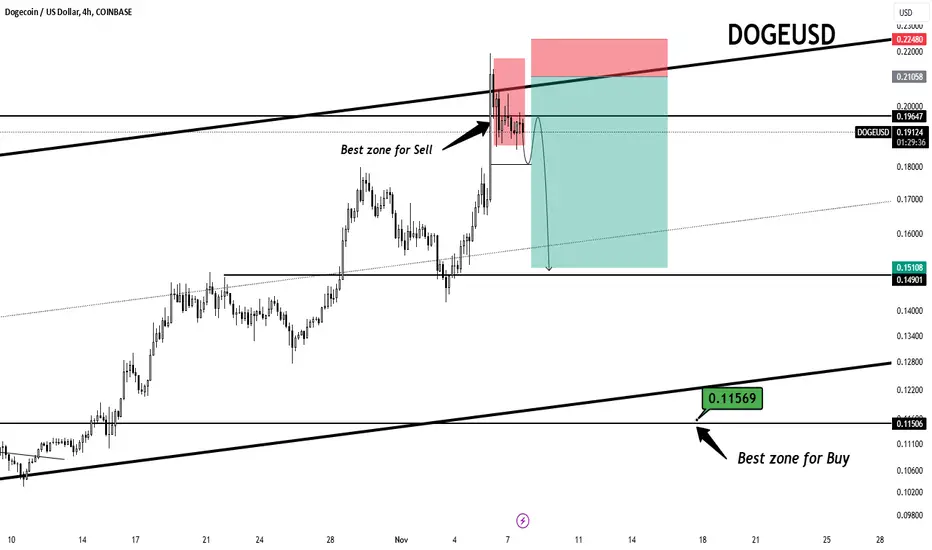
Doge SellAhmadarz analysis based on the DOGEUSD chart:
Chart Analysis:
Resistance Zone (Sell Zone): Around the $0.22–$0.23 range, there's a visible resistance level where sellers could potentially take control. The price has approached this upper zone but appears to lack momentum for a breakout. This level is marked in red on the chart and labeled as the "Best zone for Sell."
Support Zone (Buy Zone): The support zone lies closer to $0.115, with the area marked in green as the "Best zone for Buy." If the price falls to this level, it might attract buyers, providing a good potential entry point for a rebound.
Current Price Action: The price recently made an upward push but faced rejection near the resistance zone, suggesting a potential trend reversal or correction. The price is in a consolidation phase, bouncing around near the resistance line. A drop could lead the price back down toward the buy zone.
Trading Signals 📉📈
Sell Signal: If DOGE/USD continues to face resistance around the $0.22–$0.23 level, consider a sell entry in this range. Confirmation with candlestick patterns like bearish engulfing or a clear rejection might add more strength to the signal. 🎯 Target for this position could be near the next support zone around $0.15.
Buy Signal: If DOGE/USD declines towards the $0.115–$0.12 support level, this could offer a buying opportunity for a rebound. Buyers should watch for a bounce or bullish patterns near this level. 📈 Set a target around $0.15–$0.17 for potential gains.
Risk Management ⚖️
Stop-Loss for Sell: If entering a sell position near $0.22, a stop-loss around $0.23 would limit potential loss if price breaks out of the resistance zone.
Stop-Loss for Buy: For buy entries near $0.115, a stop-loss below $0.11 would be a protective measure if the price continues down.
Sell Signal 📉
Entry: $0.22 - $0.23
StopLoss: $0.235
Targets:
TP 1: $0.20
TP 2: $0.18
TP 3: $0.15
TP 4: $0.12
Conclusion 📝
This chart suggests a range-bound scenario with key levels to watch. Traders could look for sell opportunities near resistance and buy opportunities at support.
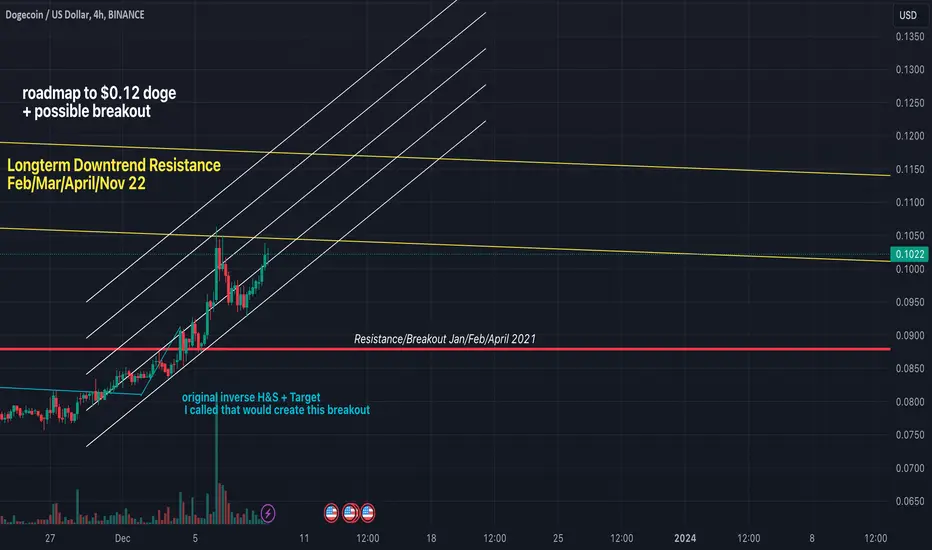
roadmap to $0.12 doge + possible breakoutLet Me First Say I called this original breakout for Doge at 8 cents
when everyone was saying short it. Over 60% of the market was short on doge at that point.
We have 3 solid confirmations on the bottom that confirms this path should take us to the top of the 2nd resistance line to attempt a breakout so follow this uptrend channel and wait for a possible breakout or short position. Keep in mind doge has be trading very similar to BTC so never look away from it to see if it knocks it off it's path.
Good luck!
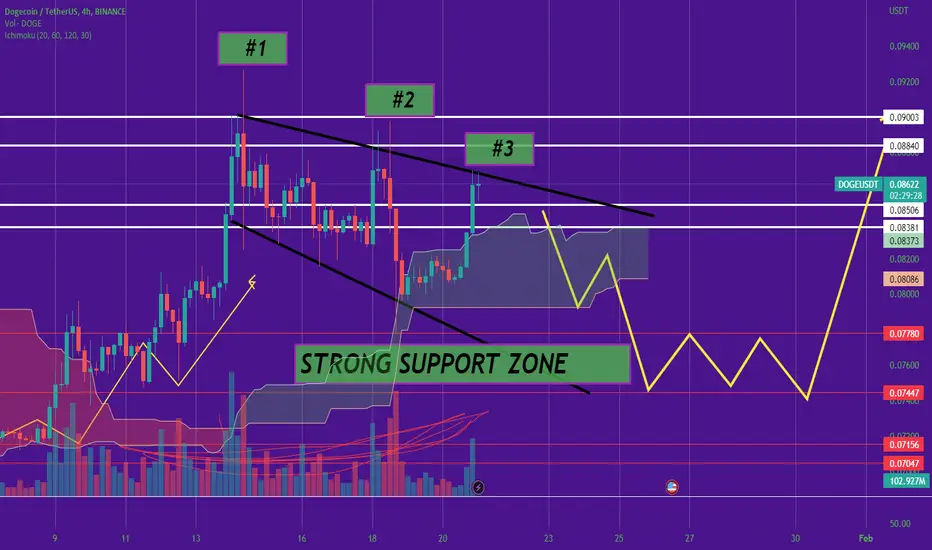
DOge Coin !! is this a trapp? DOGE Price analysis As we see here DOGE is in a downward wedge on the long-term chart where it hit the top of this trending line now #3 times! So it must go back down right? Well, this might be a great Short setup idea in my opinion .
If we loose the .08351 - .08506 LVL DOGE will most likely go back down and retest the .07780 ZONE of SUPPORT Which means The Doger woger could loose 12% from here .
Keep it tight n simple out there guys! Don't Leverage trade this market! be smart :)
Stochastics 1D RSI shows a 80% downside move is possible. Please look at previous times our 1D RSI Stoch hit overbought levels, it is incredibly high now. I opened a risky short at 3x, I think we will all go down to 0.01!
You may be angry, but please analyze the chart yourself. I highlighted the important parts.

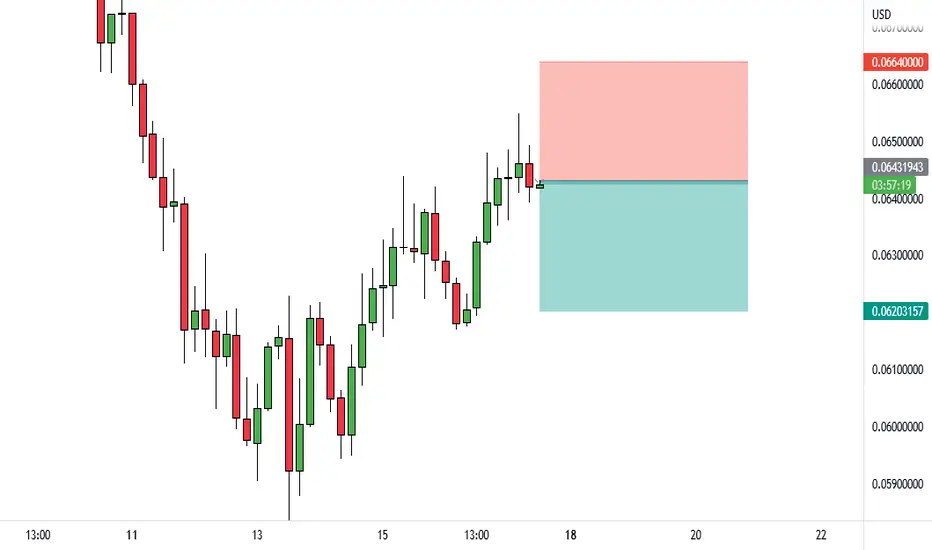
DOGE/USD ShortInto resistance on higher timeframe.
Target is a moving average so will be adjusted over time.
1:1 RR
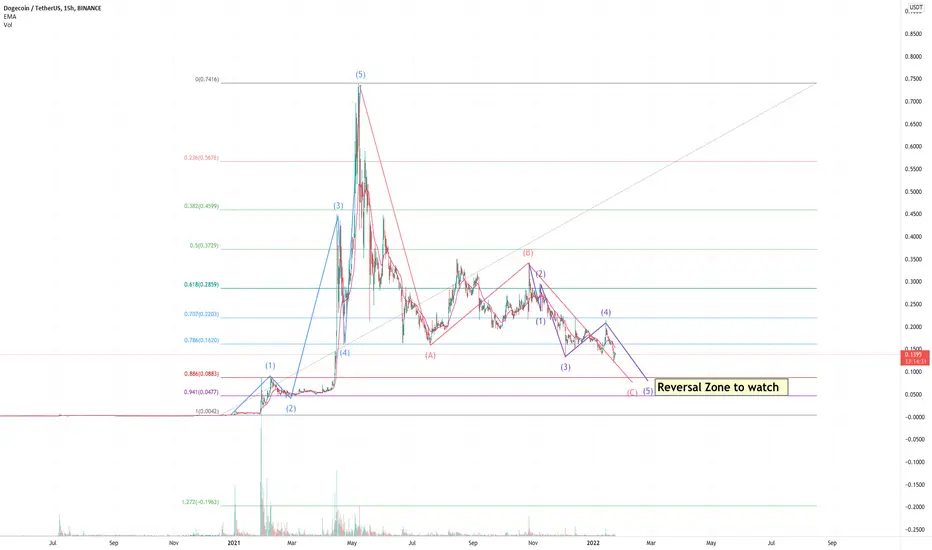
Dogecoin SHORT TO $0.08 or $0.04 Dogecoin going on an A-B-C ZIG-ZAG correction which is a (5-3-5 wave) very common after a good 5 wave impulse
Blue 5 wave Elliot wave in 2021 Jan TO May
ABC corrective wave in RED
We are now in Wave C in the ZIG-ZAG correction (PURPLE)
Wave C is going through sub wave (4) and sub wave (5), we are already going below 78.6% FIB retracement, so the next best points are 88.6% and 94.1% and they are derived by the following formulae:
88.6% price level is derived by squaring (or multiplying by itself) from the Golden Ratio, 0.618:
0.618 x 0.618 = 0.786 (78.6%)
0.786 x 0.786 = 0.886 (88.6%)
0.886 x 0.886 = 0.941 (94.1%)
88.6% retracement price is $0.08
94.1% retracement price is $0.04
I believe DOGE will still be shorted and may find the reversal at that zone
Please like and comment for feedback
DOGE Short Opportunity After Elon Musk Tweet Causes 43% PumpShort from top down to 15 cent and 12 cent price targets.

