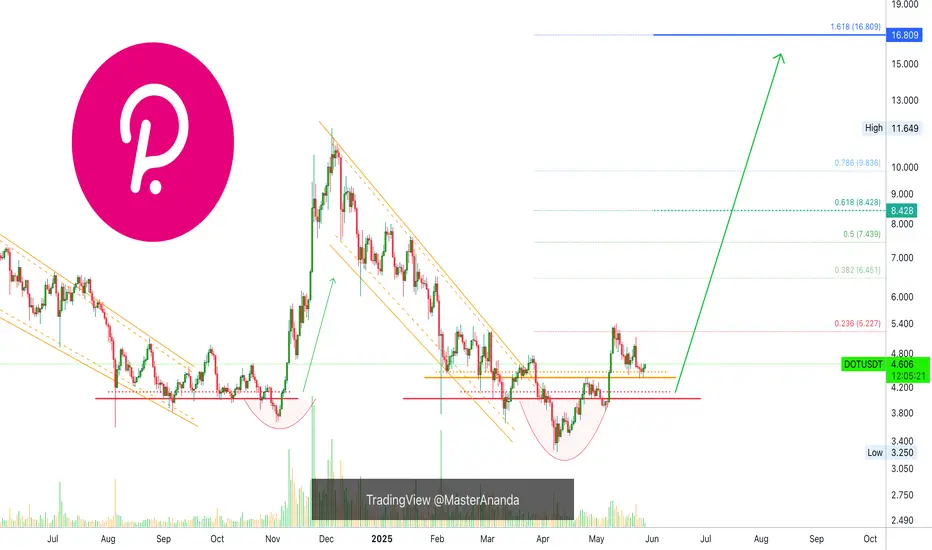
Polkadot · Trading at Bottom Prices · Bullish Scenario ExplainedThe same levels, the same prices, the same support zone. Polkadot is still trading at bottom prices. From the bottom the market tends to grow.
Good morning my fellow Cryptocurrency trader, I hope you are having a wonderful day. Notice the brown lines on the chart. We have the 7-April low, the June 22 low and also the low in March and yesterday, 1 August. This is a bottom range and this is the buy zone.
Polkadot (DOTUSDT) has been trading near this range since February 2025, six months ago. This is a very long—and strong—consolidation period. This much accumulation is surely the preparation for a major market change, a change of trend. A new uptrend. An event that has not happened since 2021.
I think the most important part is to truly understand that a bullish wave develops only from low prices. Notice the peak from December 2024. As soon as prices are high, the market seeks balance and starts to decline. But, when prices are low, an accumulation period develops and afterward a wave of growth. That is what I see happening right now across the market and with this chart. It already happened to hundreds of projects, literally. They all had the same chart.
These projects grew in late 2024, November-December. Then they went into correction in early 2025 until recently. The current low as witnessed on DOTUSDT led to massive growth. Some of these pairs are trading at new all-time highs while others have grown 500% or more. Those trading at the bottom are still early and next in line to move when the market does.
We will be bullish within days, as soon as Bitcoin ends its retrace. I shared in another publication why I believe Bitcoin will recover in the coming days.
Thank you for reading.
Namaste.
DOT

DOTUSD H4 | Bearish dropDOT/USD has rejected the sell entry and could drop lower to the take profit, which acts as a multi-swing low support.
Sell entry is at 3.702, which is a pullback resistance.
Stop loss is at 4.128, which is a potential pullback resistance.
Take profit is at 3.143, which is a multi-swing low support that is slightly above the 161.8% Fibonacci extension.
High Risk Investment Warning
Trading Forex/CFDs on margin carries a high level of risk and may not be suitable for all investors. Leverage can work against you.
Stratos Markets Limited (tradu.com ):
CFDs are complex instruments and come with a high risk of losing money rapidly due to leverage. 65% of retail investor accounts lose money when trading CFDs with this provider. You should consider whether you understand how CFDs work and whether you can afford to take the high risk of losing your money.
Stratos Europe Ltd (tradu.com ):
CFDs are complex instruments and come with a high risk of losing money rapidly due to leverage. 66% of retail investor accounts lose money when trading CFDs with this provider. You should consider whether you understand how CFDs work and whether you can afford to take the high risk of losing your money.
Stratos Global LLC (tradu.com ):
Losses can exceed deposits.
Please be advised that the information presented on TradingView is provided to Tradu (‘Company’, ‘we’) by a third-party provider (‘TFA Global Pte Ltd’). Please be reminded that you are solely responsible for the trading decisions on your account. There is a very high degree of risk involved in trading. Any information and/or content is intended entirely for research, educational and informational purposes only and does not constitute investment or consultation advice or investment strategy. The information is not tailored to the investment needs of any specific person and therefore does not involve a consideration of any of the investment objectives, financial situation or needs of any viewer that may receive it. Kindly also note that past performance is not a reliable indicator of future results. Actual results may differ materially from those anticipated in forward-looking or past performance statements. We assume no liability as to the accuracy or completeness of any of the information and/or content provided herein and the Company cannot be held responsible for any omission, mistake nor for any loss or damage including without limitation to any loss of profit which may arise from reliance on any information supplied by TFA Global Pte Ltd.
The speaker(s) is neither an employee, agent nor representative of Tradu and is therefore acting independently. The opinions given are their own, constitute general market commentary, and do not constitute the opinion or advice of Tradu or any form of personal or investment advice. Tradu neither endorses nor guarantees offerings of third-party speakers, nor is Tradu responsible for the content, veracity or opinions of third-party speakers, presenters or participants.

Price floor: The opportunity to buy has arrived.Hello friends🙌
According to the decline we had, you can see that the price has reached its historical low, which has given good profits whenever it reaches this low. Now, with capital and risk management, we can buy within the limits of the low and move with it to the specified targets.
🔥Follow us for more signals🔥
*Trade safely with us*
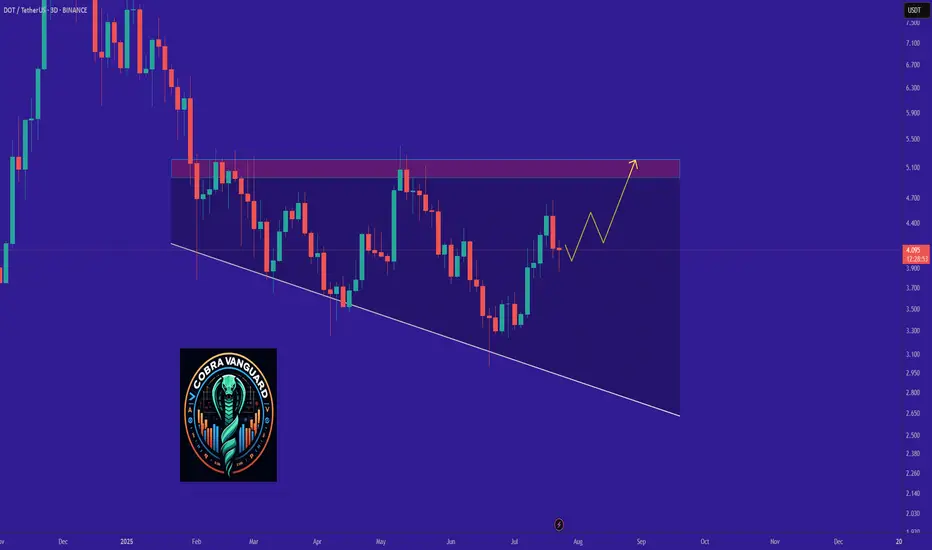
DOT It will grow soon...The DOT will increase $1 and reach to the top of the wedge in the coming weeks .
Best regards CobraVanguard.💚
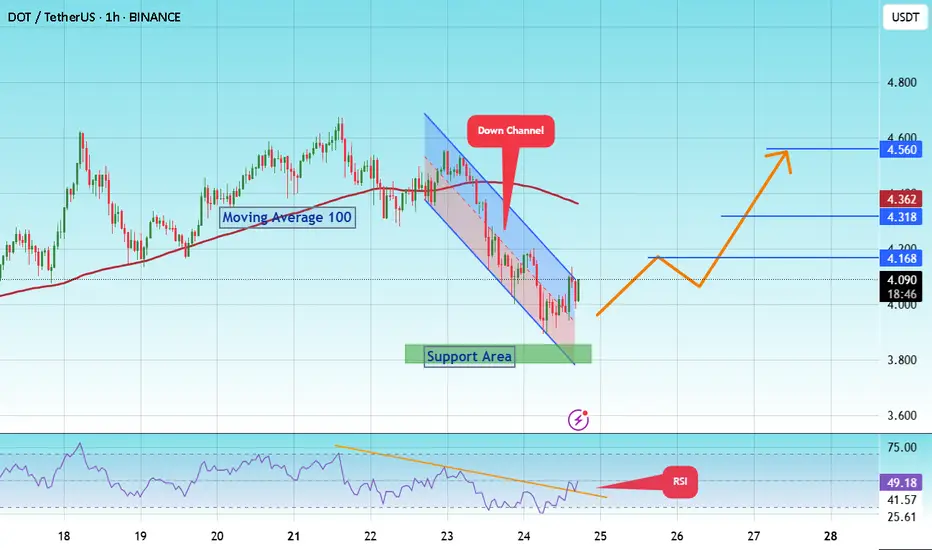
#DOT/Eyes 15% Rally, Targeting Key $ 4.560 Resistance Level#DOT
The price is moving within a descending channel on the 1-hour frame and is expected to break and continue upward.
We have a trend to stabilize above the 100 moving average once again.
We have a downtrend on the RSI indicator that supports the upward break.
We have a support area at the lower limit of the channel at 3,870, acting as strong support from which the price can rebound.
We have a major support area in green that pushed the price higher at 3,800.
Entry price: 4.084
First target: 4.168
Second target: 4.318
Third target: 4.560
To manage risk, don't forget stop loss and capital management.
When you reach the first target, save some profits and then change your stop order to an entry order.
For inquiries, please comment.
Thank you.
DOT Eyes 15% Rally, Targeting Key $5 Resistance LevelHello✌
Let’s analyze Polkadot’s upcoming price potential 📈.
BINANCE:DOTUSDT has broken above multiple daily resistance levels and is now consolidating near a key support zone. With this bullish structure in place, I'm targeting a minimum 15% move to the upside, with $5 as the main take-profit level. 🚀📈
✨We put love into every post!
Your support inspires us 💛 Drop a comment we’d love to hear from you! Thanks , Mad Whale 🐋

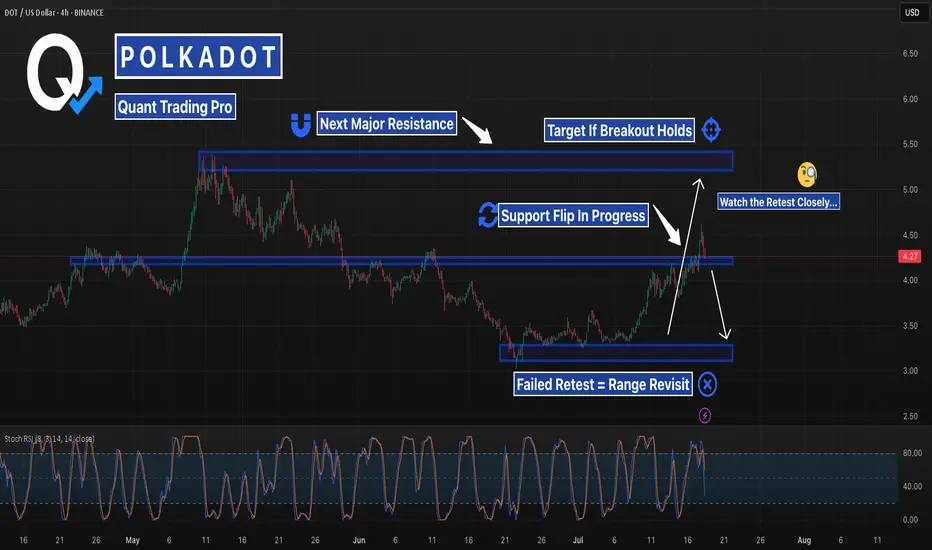
DOT Mid-Level Retest — Setup for the Next LegDOT is testing a key breakout level that previously capped the rally. If buyers defend this zone, the next major target sits around $5.50 — but failure here could send it back into range. High reward, high risk setup forming.
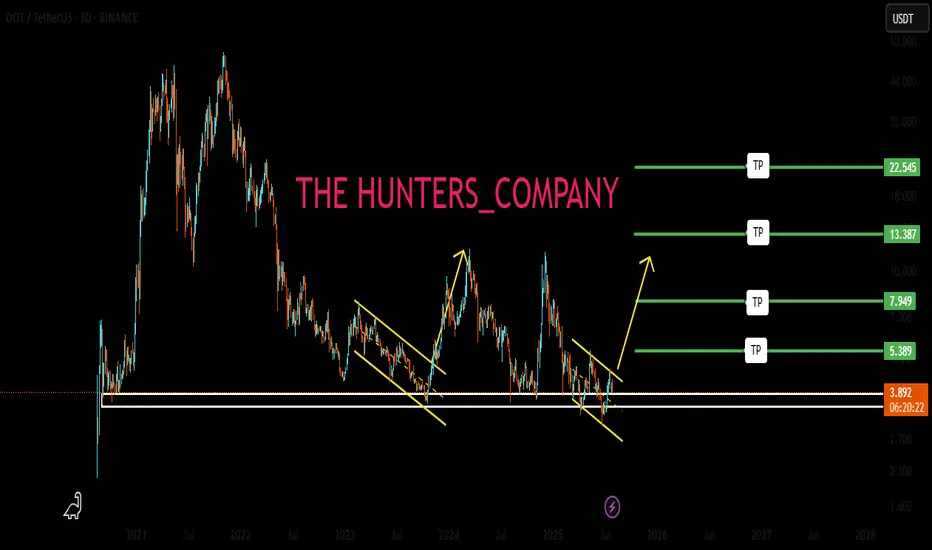
DOTUSDT - A Sleeping Giant in the Bull Market?Polkadot (DOT) has always been one of the leading assets during bull markets
A $10 target now seems inevitable after a clean breakout above the main trendline, followed by a successful retest.🎯
This $10 level has historically acted as a major resistance zone, often manipulated during each bull cycle — price touches it, then sharply pulls back.
But the big question is:
Will DOT break this psychological barrier this time?
Why not?
With many investors losing faith in the crypto market and considering leaving altogether, this might actually be the perfect setup for a massive price explosion.
Historically, the craziest pumps tend to come when confidence is at its lowest.🚀
Best regards Ceciliones 🎯

Polkadot Opportunity Buy Zone · Near Bottom · 2025 Bull MarketThis is what I mean: Opportunities are endless in this market. Compare Polkadot to say, Solana or Cardano which I shared just recently. Can you notice the huge difference?
First, Polkadot is still trading below EMA89 and MA200 weekly. Not to be taken as a bearish signal but instead to be interpreted as the pair being very early in its bullish cycle.
While Solana is trading ultra-high, super-strong, one of the strongest pair, which is bad if you want to go LONG (high risk with a small potential for reward), Polkadot is trading within the opportunity buy zone, very close to its bottom (low risk vs a high potential for reward).
I am a buyer. I am a Cryptocurrency fan. I am a bull.
So I want low prices and that is why low prices are good.
This is an opportunity, DOTUSDT. It is trading low now but it won't be trading this low for long, not even weeks. It is likely to start advancing within days. Once the bottom is gone it is gone forever. These altcoin projects will be the new tech giants and they will rise long-term. This is your chance. This is your opportunity for long-term trading success. Once you catch the bottom, you can't go wrong.
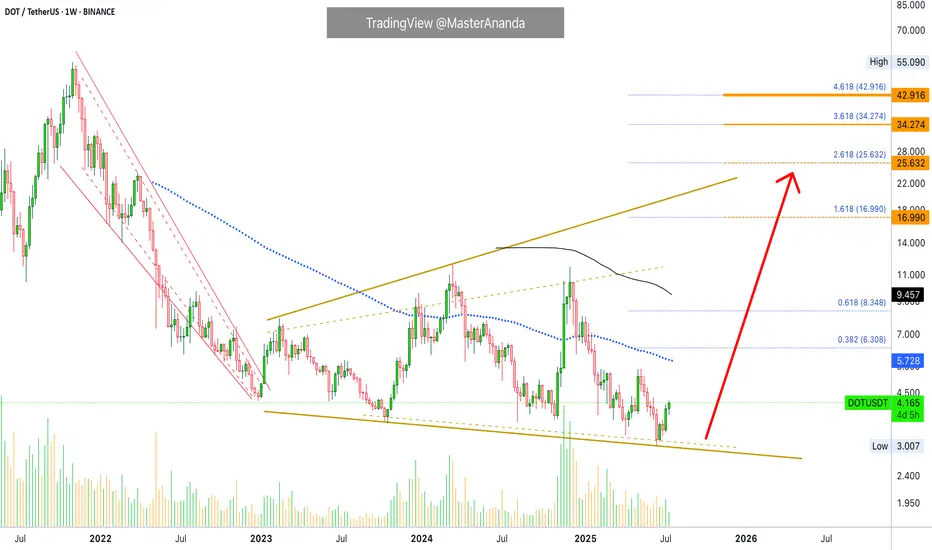
The chart is showing a long-term broadening channel. This is part of the transition period, from bearish to bullish, the consolidation phase. While the channel looks pretty big, the swings, if you activate the linear chart you can see the truth. Perspective. You will see a true bottom on the chart. From the bottom we grow.
When the action challenges the lower boundary of the channel, support; the market reverses, in this case Polkadot will start to go up. It is already growing. Several weeks rising. The upper boundary is the minimum giving us more than 425%. But we are not aiming for the minimum, we want high in the least, we want the maximum, so let's go for a new all-time high or just below the last one.
Namaste.
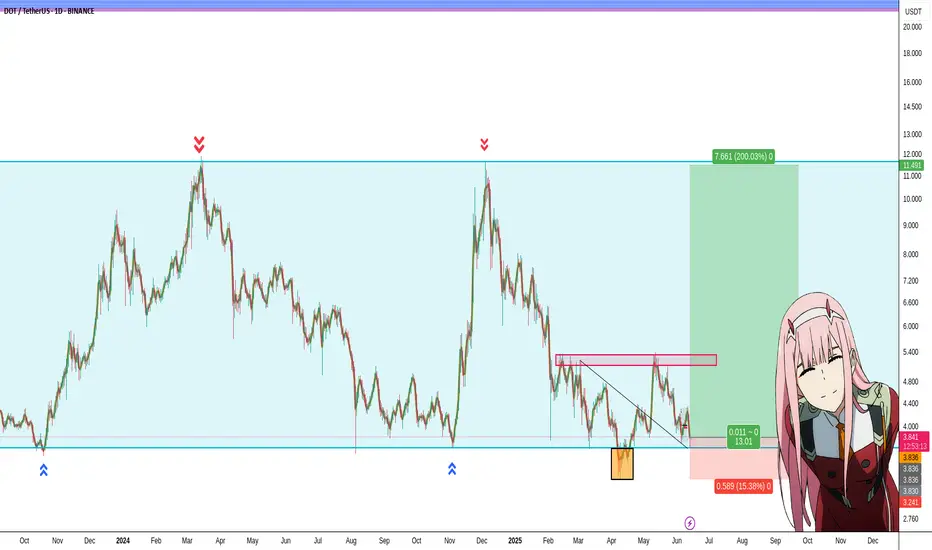
DOT Reloading for Takeoff ?CRYPTOCAP:DOT has been following a textbook Wyckoff cycle — moving from markdown into accumulation, followed by a sharp markup, then another markdown, and once again settling into a fresh accumulation zone.
After retesting the major support at $4 and holding above it, DOT is showing early signs of bullish momentum. If this structure continues, we could be preparing for another markup phase with potential targets at the $6, $10, and even $11 resistance zones.
This setup mirrors the previous cycle — will history repeat itself?
📍 Key Levels:
Support: $4.00 & $3.00
Resistance: $6.00, $10.00, and $11.00
Let me know your thoughts in the comments 👇
📚 Always follow your trading plan regarding entry, risk management, and trade management.
Good luck!
All Strategies Are Good; If Managed Properly!
~Richard Nasr

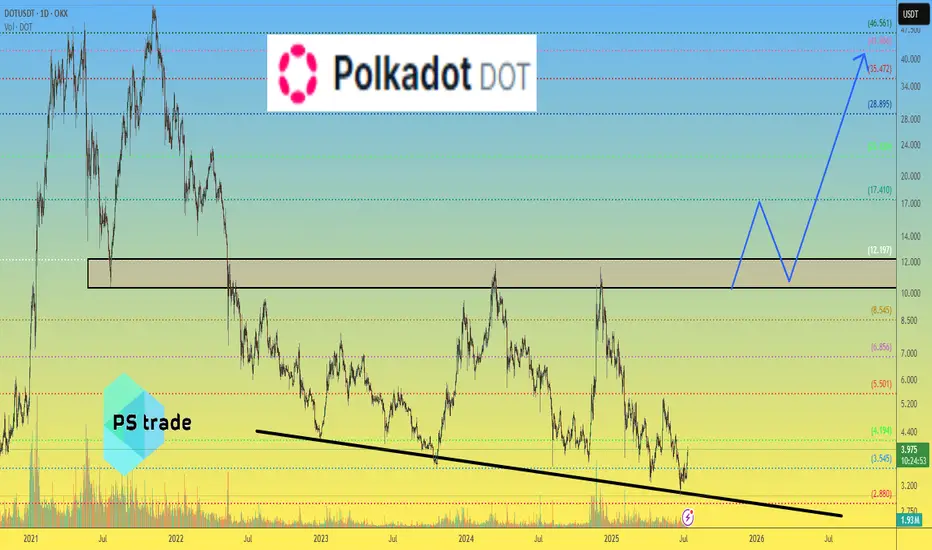
Polkadot DOT price analysisAt night, only CRYPTOCAP:BTC impressively updated its ATH, while the rest of the altcoins... haven't really woken up yet after many months, if not years, of hibernation.
For example, if memory serves, in 2020, CRYPTOCAP:DOT was buying at $1.7-1.9 during the presale (please correct me in the comments if I'm wrong). Now, the price of OKX:DOTUSDT is not that far from the initial price.
🤪 It seems that no one believes in the ultra-fashionable #Polkadot “parachain” fairy tales anymore, and that is why if the price of #DOT rises again to $11-12, it will be super happiness and luck.
✈️ Well, dreams that #DOTUSD will cost $42 again can only be included after the price has firmly consolidated above $12, and with the current price dynamics, this is something at the level of fantasy.
_____________________
Did you like our analysis? Leave a comment, like, and follow to get more
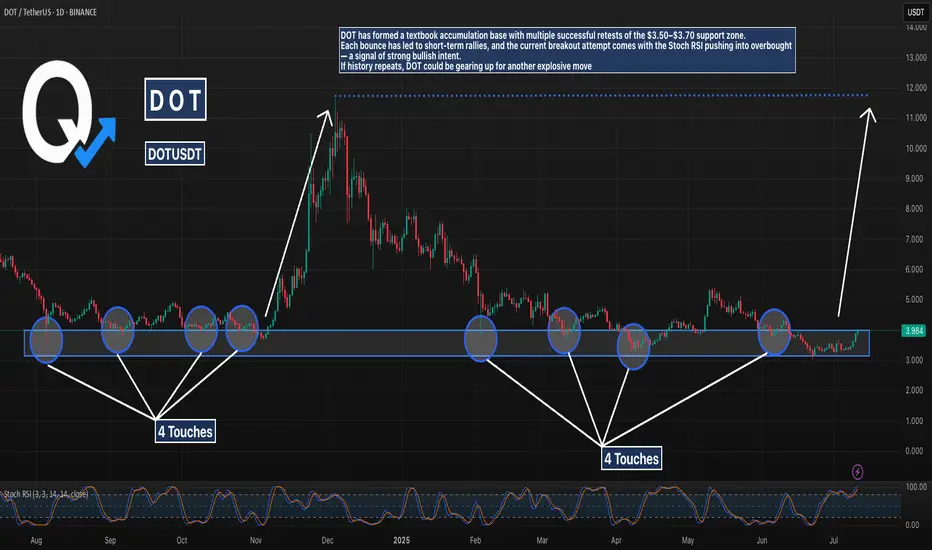
DOT’s Accumulation Zone Holding — History Rhymes?Polkadot (DOT) has respected the same support range for nearly a year, forming a long-term base around $3.50–$3.70. Previous bounces from this level have resulted in aggressive upside moves. With Stoch RSI now pointing up again and price pushing higher, DOT may be gearing up for another breakout attempt — potentially echoing its last major run.
#DOT #Polkadot #Accumulation #CryptoChart #QuantTradingPro #TradingView
DOT/USDT Weekly Accumulation or Annihilation?📌 Overview & Market Context
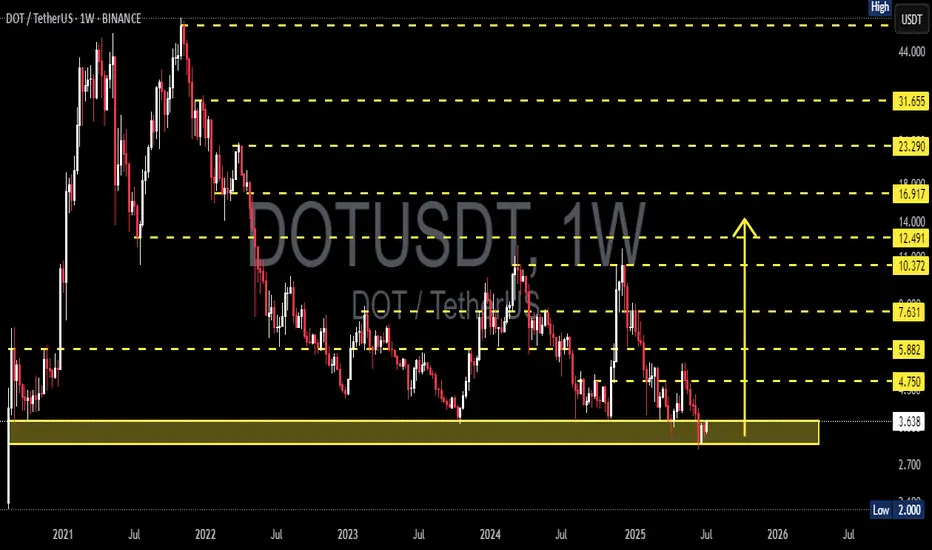
Polkadot (DOT) is currently testing one of the most critical technical zones in its price history. Price action is revisiting a multi-year demand zone between $2.70 and $3.60, which has previously served as the springboard for explosive upward moves — including the 2021 rally to all-time highs near $55.
This weekly chart reveals that DOT may be transitioning from a prolonged downtrend into an accumulation phase, often seen before major bullish expansions.
🧱 Historical Support Zone & Technical Validation
🔹 The yellow demand zone ($2.70–$3.60) has acted as a strong support multiple times since 2020.
🔹 Price has once again bounced from this area, forming a potential triple bottom or accumulation base pattern, consistent with Wyckoff Accumulation Theory.
🔹 A confirmed bullish candlestick (e.g., bullish engulfing, hammer, or long-tail doji) on the weekly timeframe could signal early institutional accumulation and a potential macro trend reversal.
🟢 📈 Bullish Scenario: Strong Reversal Potential
If DOT successfully holds this support and forms a higher low, we could see a multi-leg bullish breakout, targeting the following resistance levels:
🎯 Target Price Level Significance
TP1 $4.75 First structural breakout
TP2 $5.88 Minor historical resistance
TP3 $7.63 Previous consolidation zone
TP4 $10.37 Major weekly resistance
TP5 $12.49–14.00 Extension zone during strong rallies
🧠 Note: A move from the current level to $14 represents a potential 250%+ upside — a major opportunity if confirmed by momentum and market sentiment.
🔴 📉 Bearish Scenario: Breakdown from Historic Support
A clean break below $2.70 with high volume would invalidate the bullish setup and signal:
Breakdown from a multi-year base structure.
Possible entry into a new bearish price discovery phase.
Next psychological support at around $2.00 or lower.
This scenario could materialize if:
Bitcoin or broader crypto markets turn bearish.
Macro factors worsen.
No strong demand appears from long-term holders.
⚖️ Strategy & Investor Insights
Swing Traders: Consider aggressive entries near current levels with tight stops below $2.70.
Mid-Term Investors: This is an ideal zone for DCA (dollar-cost averaging), with attractive long-term risk-reward.
Confirmation Needed: Watch for structure breakouts above $4.75 and momentum from RSI/volume indicators.
🧠 Market Psychology: Fear Breeds Opportunity
DOT is currently in what can be described as the “boredom phase” — the stage in market cycles when most traders have given up, and smart money quietly accumulates.
As Warren Buffet famously said:
> “Be fearful when others are greedy, and greedy when others are fearful.”
#DOTUSDT #Polkadot #CryptoReversal #AltcoinSetup #TechnicalAnalysis #SmartMoneyMoves #AccumulationPhase #SupportZone #BullishCrypto #BearishBreakdown
Dot have potential to catch move like EthereumBullish trend making HH may go down for HL
Rsi divergence
Reversal pattern falling wedge
Manage your risk before entering position in real account.
DOT ANALYSIS (3D)Polkadot appears to have reached a fresh and significant support zone, which is potentially where the corrective wave C may come to an end.
If wave C completes here, the price could begin a strong recovery. However, it’s important to note that this is a higher time frame setup, so reaching the targets may take some time.
As long as the green support zone holds, the price can move toward the mentioned targets. The targets are marked on the chart.
A daily candle closing below the invalidation level will invalidate this analysis.
For risk management, please don't forget stop loss and capital management
When we reach the first target, save some profit and then change the stop to entry
Comment if you have any questions
Thank You

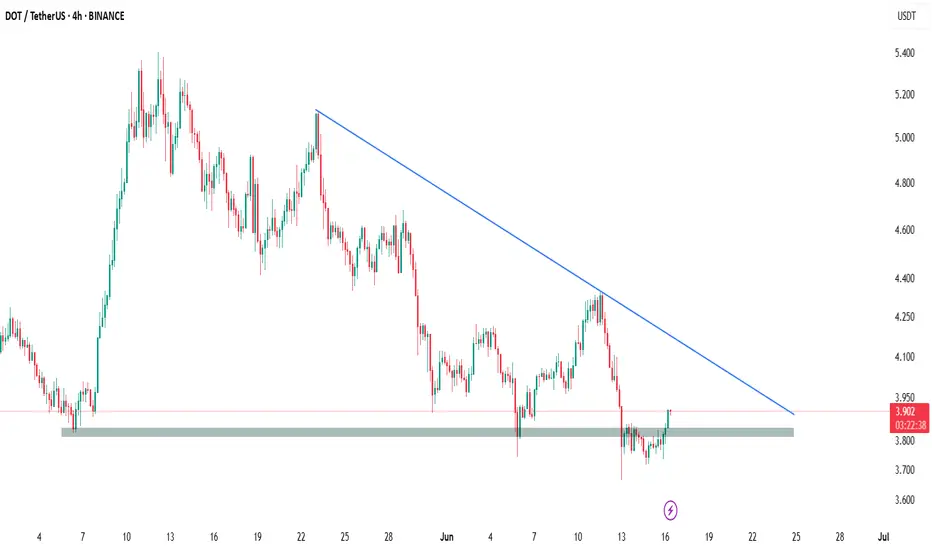
DOT/USDT - Bullish On the 4-hour chart, DOT/USDT has shown a clear bullish rejection from its significant horizontal support zone around $3.80 - $3.85. This strong bounce indicates robust buying interest at this critical level, signaling a potential reversal and a buying opportunity. The price action here underscores the validity of this support, suggesting diminishing selling pressure.
While a descending trendline remains overhead as dynamic resistance, the current rebound sets the stage for a potential challenge to this overhead barrier. A confirmed break above this trendline would further strengthen the bullish outlook. Traders may consider long positions with a prudent stop-loss placed below the $3.80 support to manage risk effectively.
DOT Will Pump 200% Next Few MonthsWe are headed to 12$ - 11$ over this year - Profiting 200%
STOP LOSS : Dailly Close Bellow 3.30$ (-15%)
Low Risq Big WIN!
Not Financial Advice , But I'm in Baby ;)
CRYPTOCAP:DOT BINANCE:DOTUSDT COINBASE:DOTM2025 BYBIT:DOTUSDT.P BYBIT:DOTUSDT COINBASE:DOTUSDT BINANCE:DOTBTC
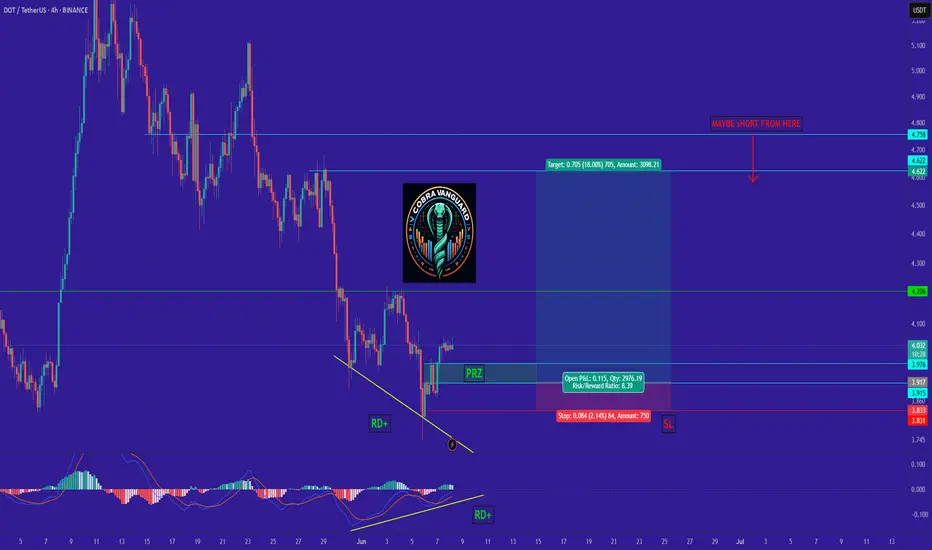
DOT.Give me some energy !!!What I currently expect is that the price could correct slightly, as shown on the chart, and then pump by about 18% from the PRZ (Price Reversal Zone). This signal is strengthened by the presence of strong positive divergence. In summary, the PRZ is a good entry point, derived from the confluence of touchlines and pivots. However, if the price ignores this zone and drops below it, my analysis will be invalidated.
Best regards CobraVanguard.💚
DOT/USDT About to Explode or Crash?Yello Paradisers! Are you ready for DOT's next explosive move, or will you be caught in the trap again? Right now, #DOTUSDT is sitting at a key decision point inside a textbook ascending channel — and what happens next could either print profits or wipe out the unprepared.
💎After respecting both the ascending resistance and support lines with high precision, it has now pulled back into a crucial area of interest: the Fair Value Gap (FVG). If DOT continues to hold above this level, the probability of a bullish continuation increases significantly. The area around $3.90–$3.95 is aligning perfectly with the demand zone, adding to the confluence and giving bulls a strong foundation to build on.
💎However, the real test lies ahead. POLKADOT must clear the immediate resistance around $4.10–$4.30 for the bullish momentum to gain traction. A successful break and retest of the $4.30 level would likely open the doors to a fast move toward the high-value resistance zone at $4.50 and above.
💎But here’s the twist: if DOT fails to defend the demand zone and instead closes below $3.683, the entire bullish setup becomes invalid. Such a breakdown could trigger a deeper correction, targeting the $3.40 region and possibly flushing out the overleveraged players in the process.
Stay focused, Paradisers. Be the hunter, not the hunted
MyCryptoParadise
iFeel the success🌴

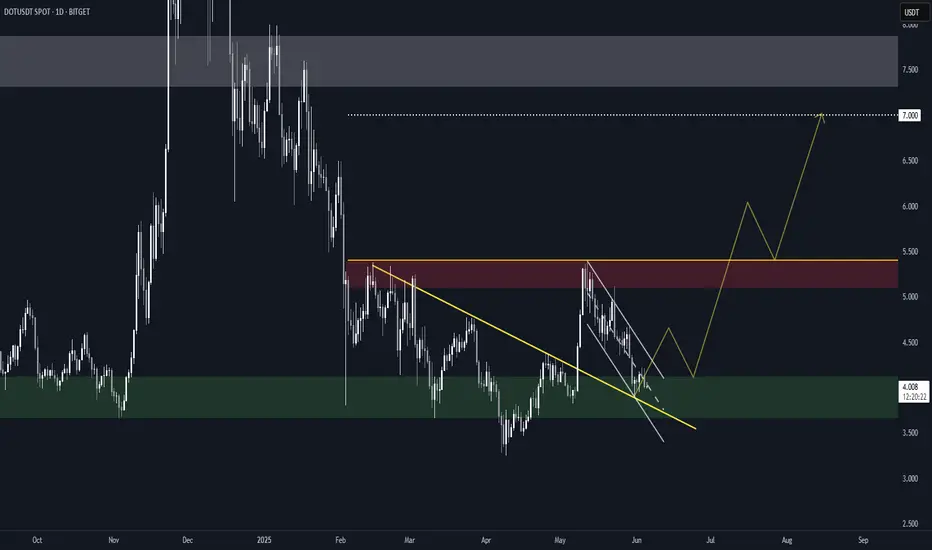
PolkaDot (DOT) Structure Analysis (1D)BITGET:DOTUSDT is showing signs of strength after a deviation below the long-standing $3.70–$4.10 demand zone.
Key Levels
• 🟢 Demand Zone: $3.70–$4.10, respected since October 2023
• 🟡 Broken downtrend resistance, retested as support
• ⚪ Current falling channel (compression) following range high retest
• 🟥 Sell Order Block: $5.10–$5.40
• 🟧 Range Resistance: $5.40
• 🎯 Target on breakout: ~$7.00, potential extension to ~$7.50
Thesis
• The recent breakdown was quickly reclaimed, hinting at a possible spring/fakeout. After retesting the range high, price is now compressing within a descending channel, building energy just above demand.
• A breakout from the channel followed by an S/R flip of the $4.40–$4.60 region could trigger a rally toward the upper range.
Watching for
• Channel breakout with volume
• Clean break above $5.40 to confirm range expansion
Invalidation
• Sustained break below the $3.70–$4.10 demand zone
#DOT/USDT#DOT
The price is moving within a descending channel on the 1-hour frame, adhering well to it, and is heading towards a strong breakout and retest.
We are experiencing a rebound from the lower boundary of the descending channel, which is support at 4.120.
We are experiencing a downtrend on the RSI indicator, which is about to break and retest, supporting the upward trend.
We are heading towards stability above the 100 Moving Average.
Entry price: 4.170
First target: 4.220
Second target: 4.246
Third target: 4.323

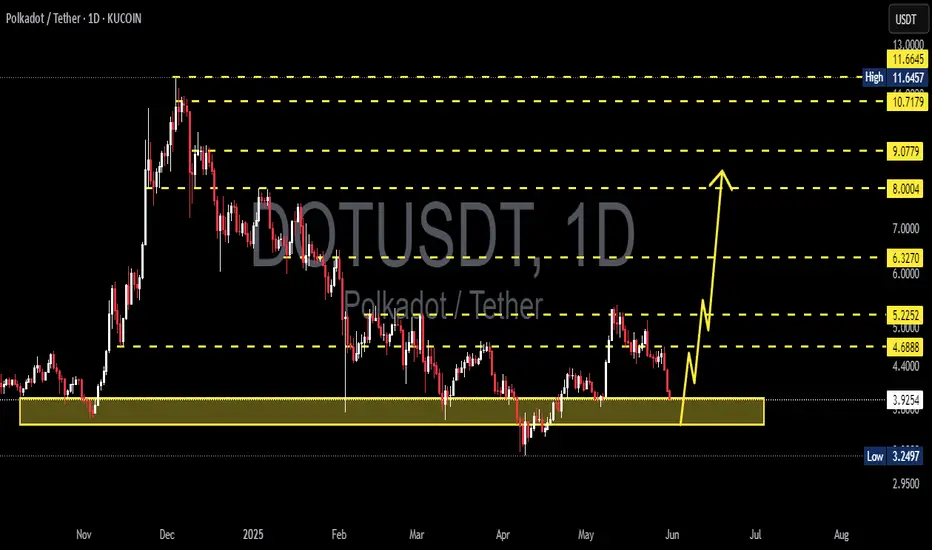
DOTUSDT 1D AnalysisDOT ~ 1D Analysis
#DOT Maybe you can consider this support block to start buying back from here with a short term target of at least 10%+, long term target $11.5
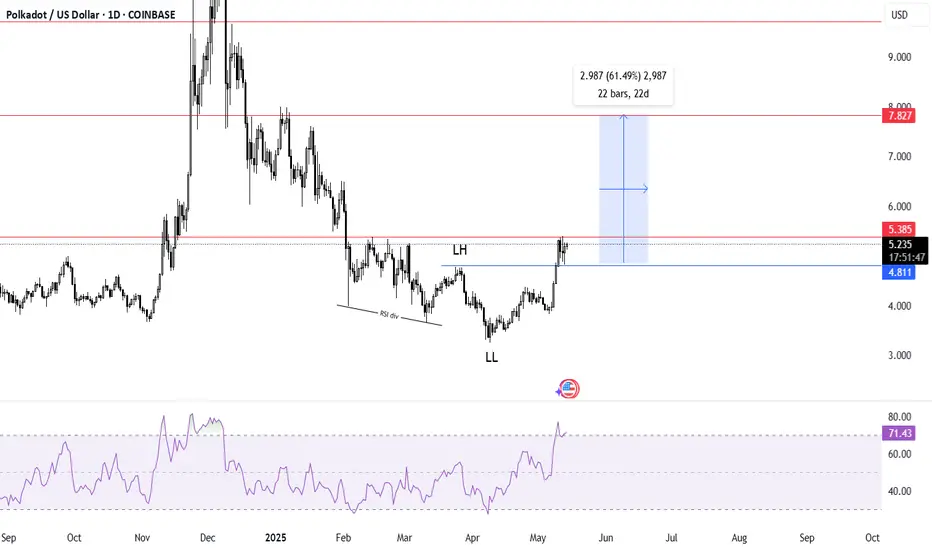
Polkadot —Higher Low & Bullish ContinuationThis one is time sensitive. Polkadot (DOTUSDT) is about to produce a bullish continuation. The higher low is in and the action just turned green.
The first advance ended 12-May, it's been 16 days. There is almost no retrace, very small but it lasted more than two weeks. This is all normal price action.
The retrace ends in a higher low and the higher low evolves into a new advance or higher high. The next rise will last much longer than the previous one, say, 30 days straight up. This can be the minimum as it can go for longer.
After this advance, which will be a big one, there can be a correction followed by the bull run phase. It is hard to know the specifics because we will have six months of growth with a correction in-between. The correction can last 1 month just as it can last 3 months but no more. Most likely around 2 months, the big one.
This correction will end in a higher low followed by additional growth until we get the cycle top.
Prices are still low. It is still early.
But after the current move that is developing now, it won't be early anymore. Everybody entering the market after the start of this continuation will be late. There will be plenty of room available for growth, but bottom prices will be forever gone.
Namaste.