DOT\USDT Bearish ChannelIn the daily time frame, the price is above the bearish channel and also in the range of the important bearish order block.
If this analysis is confirmed in lower time frames, enter the short position with more confidence.
You can move the stop loss during the trade to get more profit.
DOT

DOTUSD Futures ( DOTUSD03G2023 ), H4 Potential for Bullish RiseTitle: DOTUSD Futures ( DOTUSD03G2023 ), H4 Potential for Bullish Rise
Type: Bullish Rise
Resistance: 6.705
Pivot: 6.326
Support: 6.030
Preferred case: Looking at the H4 chart, my overall bias for DOTUSD03G2023 is bullish due to the current price being above the Ichimoku cloud, indicating a bullish market. Expecting price to retest the pivot at 6.326, where the 38.2% Fibonacci line is before continue heading towards the resistance at 6.705, where the previous swing high is.
Alternative scenario: Price could head back down to retest the pivot at 6.326, where the 38.2% Fibonacci line is, before heading towards the support at 6.030, where the previous swing low is.
Fundamentals: There are no major news.

$Neer next move! $Nuum. $dot $ksmAs I mentioned before (NEER successfully won a parachain crowadloan by Kusama and marked a record high of participants.. I expect this project to do very well in the short and long run.)
(Circulating Supply: 22.6M)
(Mcap: 5-6 M)
Team is delevering and working on more deliverables according to the plan, they are also working on $nuum which is somthing you need to look up if you are interested in this project. #Bitcounty #Pionner are doing well.
Technical part:
It looks like it is forming a giant Adam and Eve pattern. I think it is worth looking at.
Good luck.

DOT / USDT 1D CHART - Resistance and SupportHello everyone, I invite you to review the DOT chart in pair to USDT on a one-day timeframe. Let's start by marking the downtrend line, which the price has broken above, and we are currently moving above the uptrend line.
Let's move on to denoting the resistances that the price must overcome, and here we see that the first resistance is at $7.14, the second resistance is at $8.06, the third is at $8.96 and the fourth is at $10.24.
Looking the other way, we can similarly determine the places of support. And here we have the first support at $6.23, the second at $5.85, then we can mark the support zone from $5.55 to $5.20, and the second support zone from $4.78 to $4.20.
As we can see, the EMA Cross 10 and 30 indicate an uptrend, the CHOP index indicates entering a local downtrend, while the RSI shows a rebound and a downtrend.

DOTUSD Futures ( DOTUSDT), H4 Potential for Bullish ContinuationTitle: DOTUSD Futures ( DOTUSDT), H4 Potential for Bullish Continuation
Type: Bullish Continuation
Resistance: 7.222
Pivot: 6.539
Support: 6.201
Preferred case: Looking at the H4 chart, my overall bias for DOTUSD is bullish due to the current price being above the Ichimoku cloud , indicating a bullish market. Expecting price to continue heading towards the resistance at 7.222, where the previous swing high is.
Alternative scenario: Price could head back down to break the pivot at 6.539, where the 38.2% Fibonacci line is, before heading towards the support at 6.201 where the 50% Fibonacci line is.
Fundamentals: There are no major news.

DOT on the brink of a major breakoutHi all,
DOT is usually trading below the radars of the big cryptocurrency influencers although it is already proven to be superior with its all technical advancements and future implementation as outlined in the roadmap. But this is not a pro-Polkadot post, so I will keep it simple.
1. Long-term downtrend - broken.
2. 21-EMA - flipped
3. $6-$6.2 horizontal resistance - broken.
What is next is the $7 mark, which is where the next major multi-timeframe resistance and former support area is situated. Additionally, it is the last high the token made on the weekly timeframe, which makes it important for the mid-term bullish reversal scenario. Lastly, that level was when DOT was initially halted back in 2020 triggering a 40 percent correction, so it is a sensitive one with a lot of trading activity around it.
I'm pretty convinced a clean breakout here will result in a major push towards the $9-$10 zone.
Let me know what you think in the comments
Regards

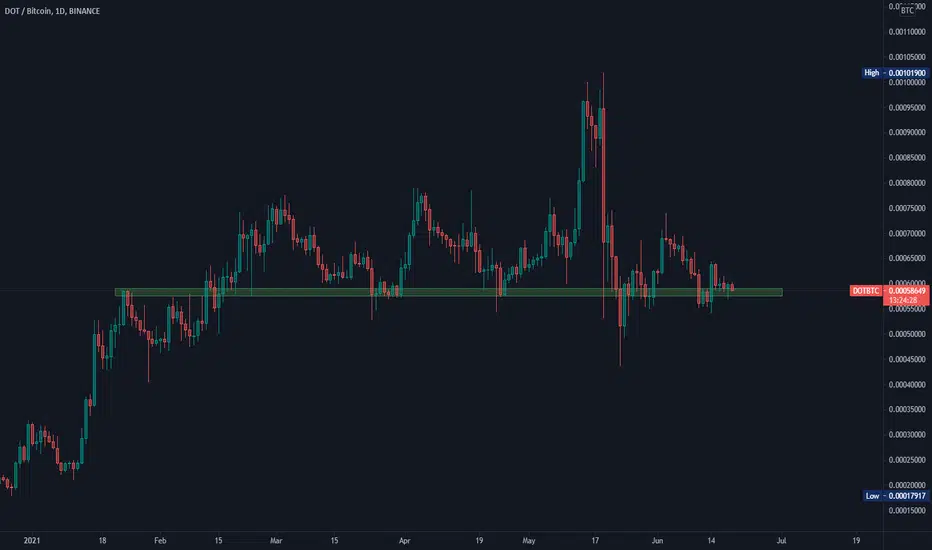
DOT/USDT also /BTCOne of the most undervalued cryptocurrencies with huge potential.
Big discount compared to last ATH.
Iam Long, HODL, stake...
NFA

buy dot for long term - i am hodl on that ;)DYOR
I bought in future with 8X but in spot i hodl for the tp3
please care about your invest
crypto is not stable market
DYOR

DOTUSD Potential for Bullish Continuation| 26th January 2023Looking at the H4 chart, my overall bias for DOTUSD is bullish due to the current price being above the Ichimoku cloud, indicating a bullish market. With price tapping into my buy entry at 6.124, where the overlap support and 23.6% Fibonacci line is, we are looking to take profit at 7.415, where the previous swing high is. Stop loss will be placed at 5.704, where the previous overlap support is.
Any opinions, news, research, analyses, prices, other information, or links to third-party sites contained on this website are provided on an "as-is" basis, as general market commentary, and do not constitute investment advice. The market commentary has not been prepared in accordance with legal requirements designed to promote the independence of investment research, and it is therefore not subject to any prohibition on dealing ahead of dissemination. Although this commentary is not produced by an independent source, FXCM takes all sufficient steps to eliminate or prevent any conflicts of interest arising out of the production and dissemination of this communication. The employees of FXCM commit to acting in the clients' best interests and represent their views without misleading, deceiving, or otherwise impairing the clients' ability to make informed investment decisions. For more information about the FXCM's internal organizational and administrative arrangements for the prevention of conflicts, please refer to the Firms' Managing Conflicts Policy. Please ensure that you read and understand our Full Disclaimer and Liability provision concerning the foregoing Information, which can be accessed on the website.

Trading Idea 022: PolkadotMarket Conditions:
- trend reversal situation
- consolidation around the resistance
- bullish sentiment in the market
Key Level and Lines:
- $6.50 resistance
- downtrend line
Trading Ideas:
- go long after consolidation below the resistance if the price moves above it
- go short if the price bounces from the resistance supported by bearish sentiment.


PolkaDOT - It has to do much more in the next bull marketPolkaDOT has undeliverd in the last bullrun on my opinion.
The project is super strong and they have one of the best dev teams there is.
Also great comunity.
It's one of my top 3 favorites.
Great ecosistem, fast network, original aproach.
Let's go DOT!
This are only my humble ideas. It's not a financial advise!
DYOR allways!
Take care of your hard worked money!
Cheers!!!
Polkadot DOT price growth is still aheadIt is very likely that the DOTUSDT price is currently in the process of forming a global reversal trend pattern - "Inverted Head and Shoulders"
Of course, the final confirmation of the pattern's formation will come after the DOT price is firmly established above $10, and buyers will need to make a lot of effort to achieve this.
Looking at the chart, we can say that the rebound of the DOTUSD price from the bottom can be called quite weak compared to other altcoins.
Buyers of Polkadot token have not broken "shorts stops" yet, which are most likely hiding above levels $7.20 and $8.20, which are the first targets for growth.
Once this target will reach - when the shorts' stops are broken - a price correction may begin.
The medium-term target for DOT price is growth to $10+.
Long-term target - growth in the range of $19-23.5
_____________________
Did you like our analysis? Leave a comment, like, and follow to get more

BTC/USD POSSIBLE CORRECTION From technical point of view we can see that price came to the upper trend line which is the copy paste of lower trend line.
From psychological point of view I see a lot of FOMO.
"bull run started"
"load your bags or stay poor"
"generational lows"
"what if I missed a bull run again. I need to buy now"
When you look at the WALL STREET CHEAT SHEET - PSYCHOLOGY OF MARKET CYCLE I see another (probably last) push lower which is the step from anger to depression. ( link to Wall St. cheat sheet psychology of market cycle therobusttrader.com )
On a long run I still think that these levels are good levels to get in but you can face at least 30% drawdown .
This is only my point of view. Do your own research and trade your own analysis.

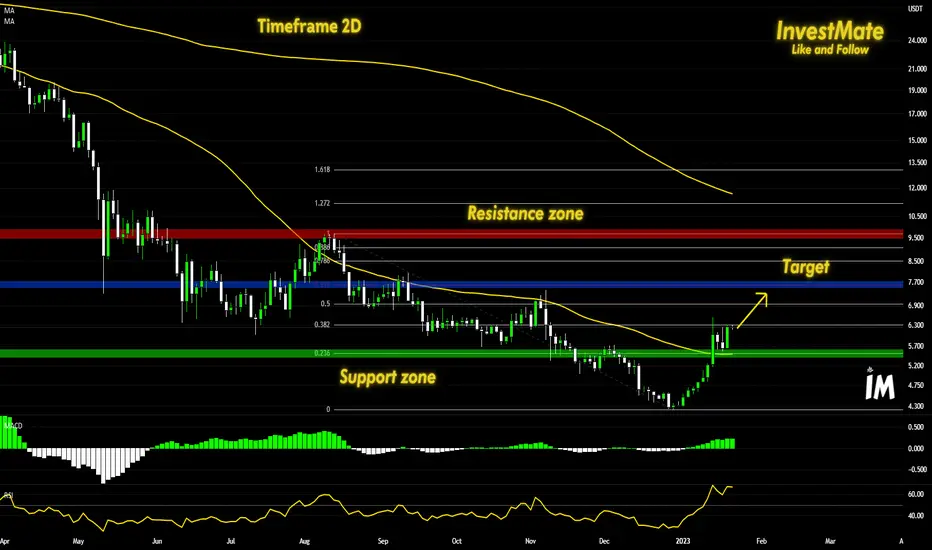
Price growth could continue to the $9.680 rangeGiven that the potential for an intraday trend reversal has emerged for DOT, if buyers can keep the price above $6.523, price growth could continue into the $9.680 range in the medium term. If the resistance of the ceiling of the descending channel is completely broken, it will be possible to reach the target of $9.680. Of course, pullbacks should not be ignored, and a return to the lows in the $5.102 - $5.374 range is possible. The last point is that if the previous ceiling at $6.523 is broken before the pullback, we can consider the $6.523 support as a safe zone for a pullback.

"DOTUSDT" SHORT NEXT MOVE!!!!!!!!!Here we can see that "DOTUSDT" in 1 day time frame has a RESISTANCE at the zone at "6.363" and it can take REJECTION from that zone. And it take correction to the zone "5.024" as there is a 0.6 fibbonachi level.
ENJOY!!!!!!!!!!!!

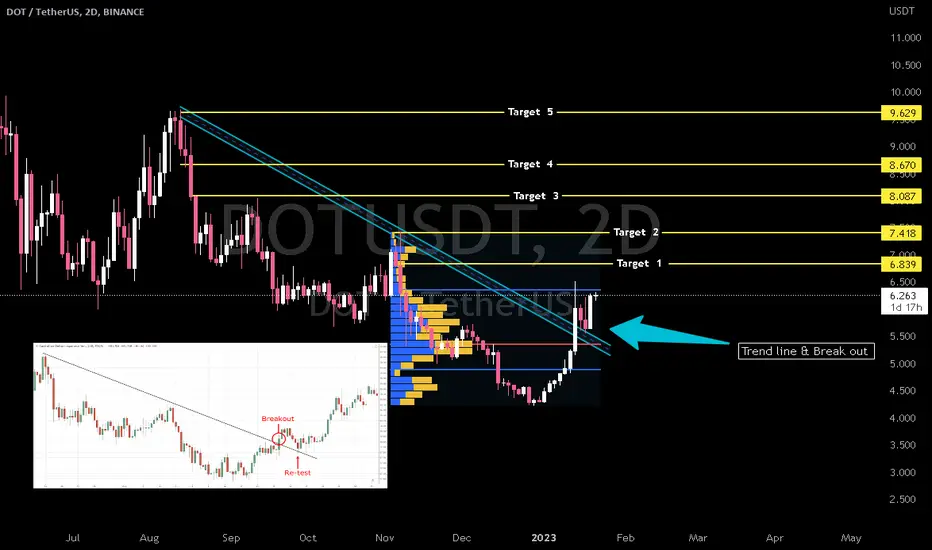
DOTUSDT | DECRYPTERS |POLKADOT Hi people welcome to Team Decrypters
We are buying DOT in spot for MID - Short term and Allocating 2% of portfolio
#Decrypters #dot #dotusdt #usdt #polkadot
Reasons :-
--A trendline breakout is a situation in which the price of an asset moves outside of a previously established trendline. This can signal a potential change in the direction of the trend and can be used as a buy or sell signal by traders
--Volume Profile is a charting technique that uses historical volume data to display the distribution of trading activity at different price levels., Traders use this information to identify areas of support and resistance, as well as to identify potential trading opportunities
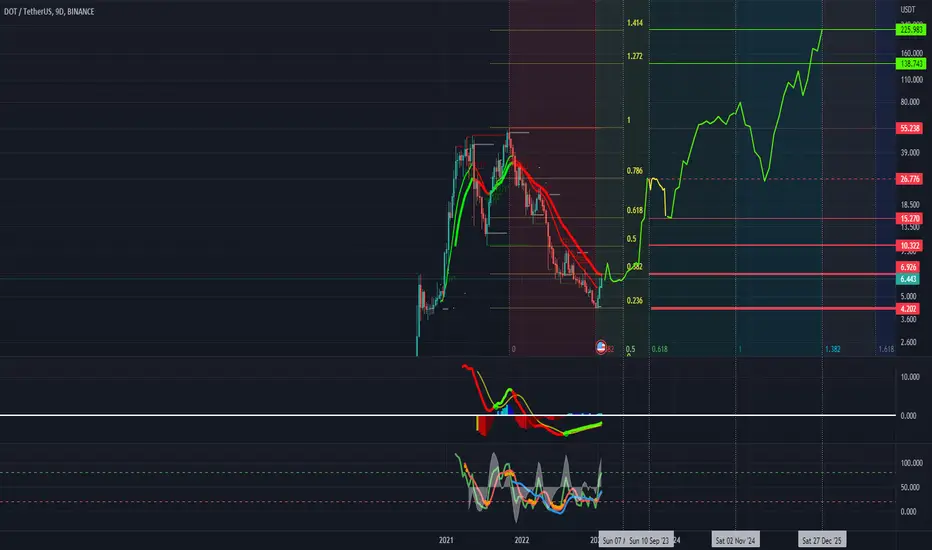
💥☃️🌲Polkadot Analyze (Road Map)!!!🗺️💥☃️🌲(+200%😱)❗️❓Today, I showed you the Polkadot road map🗺️.
Polkadot is running near the heavy support zone.
I expect Polkadot will go down a little more and then start to rise to a heavy resistance zone( about +200%)😱.
🔆Suggestion: If you want to add DOT to your portfolio, you can wait to break the downtrend line and SMA 100(Daily TF).
Polkadot Analyze ( DOTUSDT ) Timeframe Weekly⏰ (Log Scale).
Do not forget to put Stop loss for your positions (For every position you want to open).
Please follow your strategy, this is just my idea, and I will be glad to see your ideas in this post.
Please do not forget the ✅' like '✅ button 🙏😊 & Share it with your friends; thanks, and Trade safe.

💲 Dot 0.618 Within Reach 💲💲 Dot 0.618 within reach
💲 Nearest strong support zone: around the 0.236 fibo level of the downward wave.
💲 Nearest strong resistance zone: around the 0.618 fibo level of the downward wave.
💲 Technical environment:
- Moving averages: 50/50
- MACD: Uptrend
- RSI: Uptrend
💲 Price action: Dot continues its path northward bouncing perfectly from the support zone set by the fibo level of 0.236 of the downward wave. After such a quick return, there is a very high chance of seeing the 0.618 level of the downward wave in the next few days.
💲 The scenario I'm playing out is a continuation of the upside to the 0.618 area of the downward wave. I don't exclude the possibility of changing the scenario if the market situation changes abruptly. I'm aware of the possibility of a correction at any time, this should be taken into account, If the outlook changes I will publish a post with an update, so I encourage you to actively follow the profile and read the description carefully.
💲 Please do not suggest the path I have outlined with lines it is only a hypothetical scenario.
🚀 If you appreciate my work and effort put into this post then I encourage you to leave a like and give a follow on my profile. 🚀
DOT/USDT Breaking LTB After Reaction at POCBINANCE:DOTUSDTPERP
DOT is breaking the long-term LTB after suffering a price reaction in the POC of a session between August and December 2020, see that this zone remained reactive for prices.
But now it's easy to think like that since it already happened, however, here I'm going to leave a study done on May 11, 2022 where the 4.39 range was already plotted on my screen, waiting for a price reaction.
These plotted regions were reactive, some more, some less, but if you see the price reaching a certain region and consider it important, you can operate more objectively.
See how the price arriving in an area where it is interested in being traded works
Let's dissect this movement, the numbers are clear possible trades in my view.
See that on possible entry 1 it was a falling knife buy, few traders have the stomach for limit buys against the move, but the price level showed strong supply absorption and paid a great risk return.
Next we have the possible entry, number 2, see that this is already a clearer and calmer entry for many operators, either by buying limited below the last minimum, with the reading of 3 consecutive breakout failures or the purchase with a stop order at signal bar breakout with projected movement objective.
If the operator was unsure with entry number 2, he would have confirmation a few bars ahead, with an opportunity for entry number 3, with a slightly higher price and even so with a potential risk, favorable return, see that this is the entry of the late ones, it sometimes does not occur.
And finally entry number 4, which can also be a position increase, this operation 4 would be the purchase of a pullback in the price RANGE in which the buying demand managed to absorb the offer, and consequently the demand should take the market to at least a test in extreme zones where the greatest supply of assets will be found.
So the point here is, mark your charts here on TradingView in order to find the best zones where the price should show strength, be it buying or selling and trade in favor of the price reaction.
At the moment DOT/USDT is working in an area that is not very favorable for purchases, but these are the levels that I am looking to trade
Daily and 4 hours - 5.29 / 5.10 / 4.68
For those who like Fibonacci, the 5.29 and 5.00 range is also important and is confluent with the reference ranges plotted in the study.
This idea intends to find relevant zones for Pullbacks in DOT/USDT in search of a purchase for a new high Swing, if these zones do not show a reaction, it is possible that the balance of forces returns in the market and the context becomes more lateral.
🚨Disclaimer: The comments above reflect solely and exclusively my opinion, this is not a recommendation to buy or sell. Just a series of published studies, so that with the community we can discuss tactics and operational techniques.

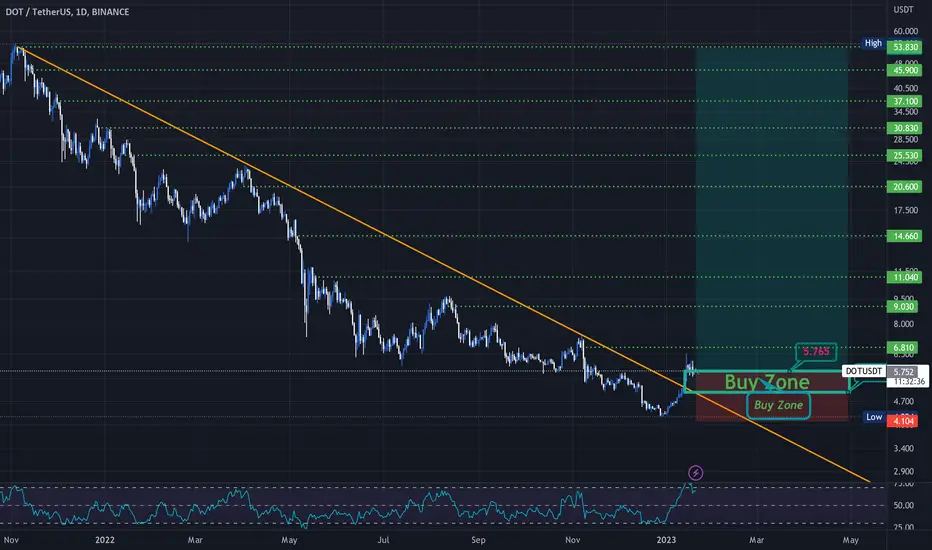
#Dot | #UsdtBuy zone $5~5.7
Targets (Midterm) : 6.81 / 9 / 11 / 14 / 20 / 25 / 30 / 37 / 45 / 53
Don't risk more than 3% of capitl.
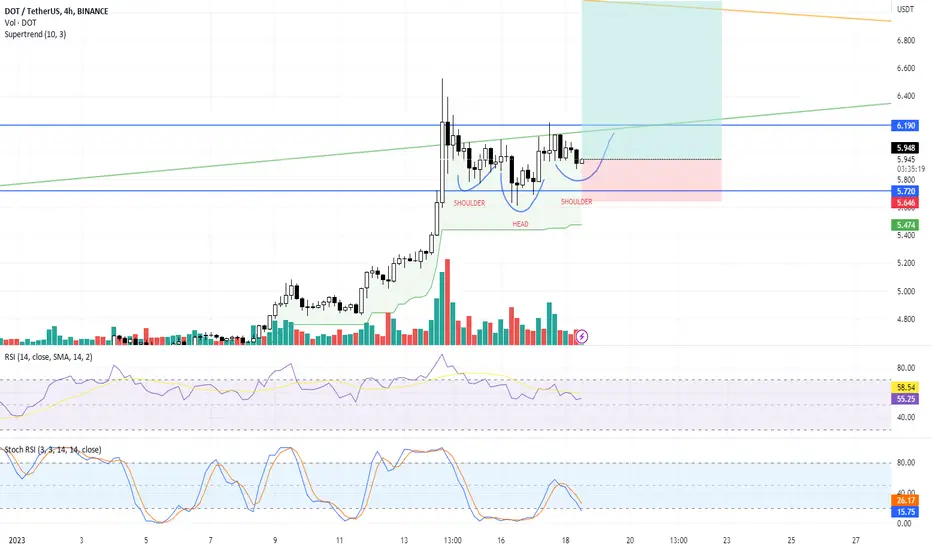
Inverse H&S could be in play (LTF)Let see if this wil play out it break out to $6,50-7,00.
$DOT
Not financial advise.