DOT/USD - Looking weakHello everyone.
On the daily chart, we can see major weaknesses in DOT, volume has been decreasing and open interest is down.
What is interesting is that the 0.236 FIB support did not hold and thus continued its break lower in the descending channel. We can see DOT is showing a bearish bias.
If the price moves below $6.15 support, we are strongly bearish in weekly trend.
In terms of macroeconomics, we have FOMC coming up tomorrow, with Powell to talk about inflation and recession concerns. The Fed's continued hawkishness is not promising for the crypto market. CPI is set to release on 13th July. If news is good, a bullish impulse could send DOT above 50 EMA resistance, and bearish momentum is invalidated.
How can we trade this?
My idea is:
SHORT @ 7.5 DOT/USD
TP: 4.15 DOT/USD
SL: 8.85 DOT/USD
Let me know your ideas below.
DOT

Polkadot Adam & Eve Bottom Pattern (90%+ Potential Profits)We have a classic pattern show up on the DOTUSD (Polkadot) chart.
The low was set 13-June;
DOTUSD continues trading above support (light blue).
Currently, we can see prices challenging EMA10, which is the first barrier to conquer for the bulls to move ahead.
As the days go by and prices grow...
We can have a massive bullish wave!
First, easy 30%...
Followed by, 90%+.
You can find more on the chart.
Remember to plan ahead.
Remember patience...
The market gives, the market takes.
Be strong.
Play safe.
Thanks a lot for your support.
Namaste.

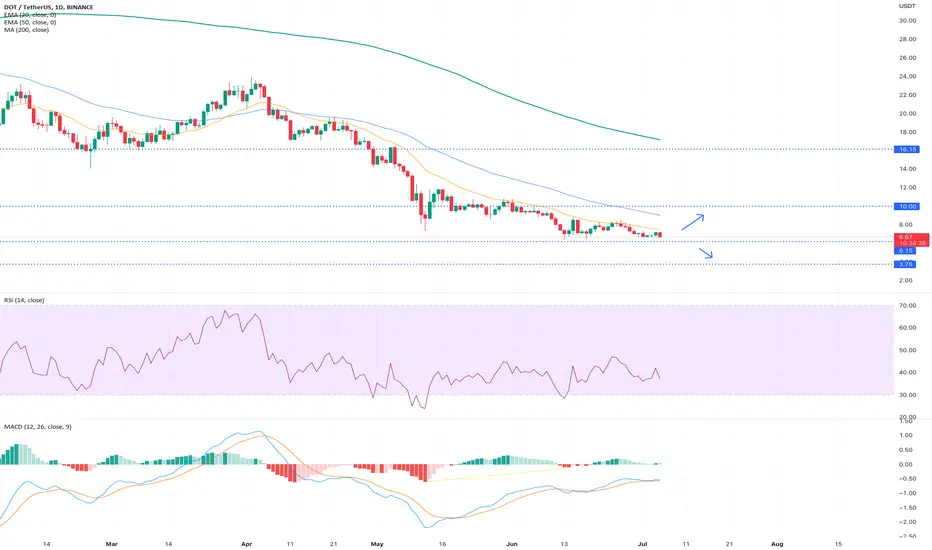
Polkadot: Daily Review and Trading IdeasMarket Conditions
We are in the bearish trend, consolidation about the support.
Valuable Areas
$6.15 is the key support right now for bears. MAs with 20 and 50 periods are key resistance lines for bulls.
Trade Opportunities
If the price moves below $6.15 support, it is a bearish signal in the direction of the main trend. The main target for bears will be $3.75 support.
If the price moves above 20MA, we may expect a correction movement with the targets around 50MA and $10.00 resistance.
For shorting, it is possible to use bearish signals from daily and lower timeframes. For buying, I would use bullish signals from hourly time frames for better risk/reward ratio.
Day traders should follow the bearish sentiment and open short positions using any pullback to valuable resistance levels and lines from the hourly time frames.
DOT symmetrical triangle#DOT/USDT
$DOT inside symmetrical triangle, possible to drop to lower line.
then decide which way to break!
I'm goin to buy more at $7, what about you?

DOT broke down symmetrical triangle#DOT/USDT
#update
$DOT broke down from lower line of symmetrical triangle.
🐻 current support zone can cause a pullback to broken trend zone to confirm it as resistance, then continue the bearish trend.
🐮 last support before $5.5 is around $6.5 that if bulls hold this zone they may change the game.

DOT reversal pattern will comingThe supply zone that we identified in last week’s analysis has once again proved to be too strong for DOT to break through. The bears came in full force near the supply zone at $8.5, causing the price to dive straight to the crucial support level at $6.50.
After approaching the support at $6.63 DOT has been trading in a very tight range. A reversal must be seen soon. Otherwise, the support will keep getting weaker, resulting in a breakdown. If this support is not held, we can expect a new 52-week low to be set by DOT. A slight RSI divergence that is hinting towards a reversal is also visible. However, the buying volumes are currently nowhere to be seen.
This is why traders should avoid buying DOT until it is able to register a strong bounce from the support level. Once a bounce is seen, we can confirm the formation of a triple bottom pattern. Traders then can set targets at the supply zone at $8.50. It is important for traders to be patient and wait for a clear reversal before buying DOT as a breakdown could still be seen.

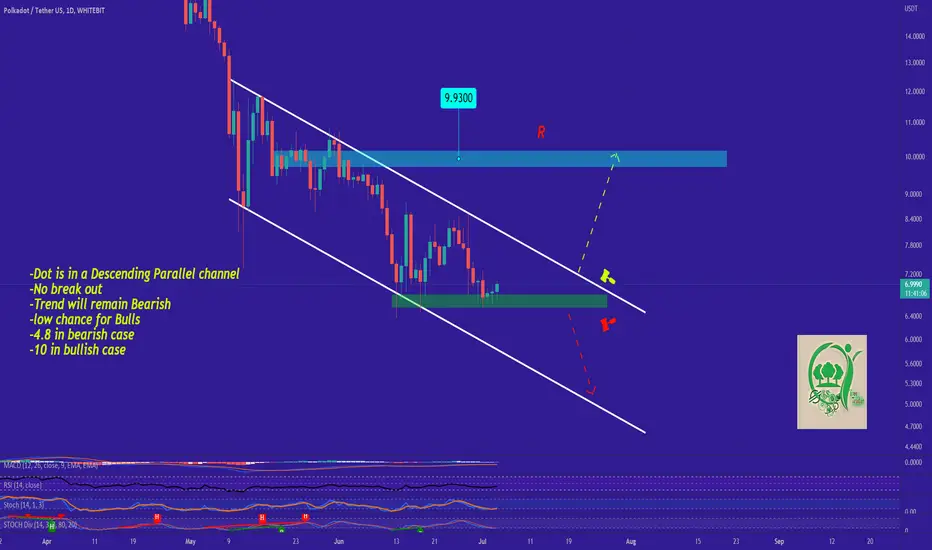
Dot's Movement PredictionDot is in a Descending Parallel channel which means the Price is gonna keep Decreasing For now! This chart and Info are Provided by our Sponsor WHITEBIT Exchange. Please Check their Exchange Using the link down below.So as you can see the Price has been in a Pretty Big Descending Parallel channel and No break out has accrued yet! So This basically means the Price will Decrease for now and there is a little chance for Bulls to take The Trend.Right now the Price is at the middle of the channel. the odds of reaching the Bottom channel is Higher Than doing a Break out but in any case the Price shall either reach 4.8 (bearish) or 10 (Bullish)
-Dot is in a Descending Parallel channel
-No break out
-Trend will remain Bearish
-low chance for Bulls
-4.8 in bearish case
-10 in bullish case
_ _ _ _ _ _ _ _ _ _ _ _ _ _ _ _ _ _ _ _ _ _ _ _ _ _ _ _ _ _ _ _ _
Thank you for seeing idea .
Have a nice day and Good luck
DOT - Go Time
End of falling wedge. Not goign to make the $5 target but we've seen 85% decline from control.
Adjusted resistance / support lines.
B, HF

$DOT long?A reclaim of the monthly level with successful breakout of the trendline might be a good long trade opportunity provided it holds the level and an easy invalidation would be the recent wick lows.
DOT/BTC Secondary TrendSecondary trend. The graph is logarithmic. Timeframe 3 days. A falling wedge is forming in this secondary trend.
The % growth / fall of the price in the event of the development of certain price movements (breakthrough / no breakthrough, fixing / not fixing) relative to key levels and zones is shown on the chart.
The same indicators on a line chart.
Main trend.
A huge harmonious pattern is formed, with impressive target.
DOT/BTC Main trend

DOT adam&eve and daily trend lines#DOT/USDT
$DOT shaped an inverted Adam and Eve pattern.
🐻 break down from support zone can drop price to daily descending trend line, around $4.5 or even lower.
🐮 holding the support zone can increase price to descending trend line and resistance zone as sideways move.

DOT/USDT IS LOOKING BULLISH!!Here's the chart of DOT/USDT. Formed a bullish bat pattren. Dot is one of the best projectes for hold term hold. Targets
Short Term : 8-11-13
Long term : 55-72-100.

MY MINIMALIST CHART ANALYSIS FOR POLKADOT06.16..22
0420H +8 SINGAPORE
Disclaimer:
The findings of the following analysis are the sole opinions of the publisher of this idea and should not be taken as a piece of investment advice.
My Published Ideas are not 100% Accurate. There are many factors at a given time that can change the forecast.
ALERT:
My Bearish Bias: I do think that It will reach the 3.7 USD ZONE as it follows the trajectory of $BTC
Based on VITAL SIGNS ( RSI, STOCH, VOL., MA VOL.) Looks healthy and about at the bottom.
1. RSI 28: about RIPE for ENTRY
2. STOCHS at the almost LOW 21.6/22, looking at a correction anytime soon this week.
3. Volume on the sell side has increased, the spike that we were looking for. This means we have a lot of supply in the market. BUYERS are coming in for this kill.
4. If it breaks the 6.6 zone, the market will try to find strong support at the 3.3 zone, If it does not break, the 7 zone a zone of capitulation will be the reversal of the trend.
5. 3 entry points marked in orange price notes.
Looking back since the beginning of the year,
the Market had amazingly moved along the TOPS and BOTTOMS of our BOXES, signifying TURNING POINTS of PRICE ACTION, and verified by major FIB levels.
Hoping that this MINIMALIST BOX CHART ANALYSIS will efficiently help you with your DYOR as we Enter a NEW SWING CYCLE.
INSTRUCTIONS:
HOW TO USE THIS MINIMALIST CHART a.k.a (Bento Box)
"Follow the white rabbit!"
Just Follow the TOPS and BOTTOMS of the BOXES as a GUIDE to where the MARKET will take you.
TARGET ZONE IDENTIFICATION:
The LARGE BOXES (Tops and Bottoms) are MAJOR turning points that will occur sometime in the future. While the SMALL BOXES (Tops and Bottoms) are MINOR turning points.
These can be entries to a BUY/ SELL POSITION, EXIT/PARTIAL EXIT/TOP-UP AREAS, as well as Support and resistance levels
Also includes MAXIMUM TARGET EXIT AREA OF VALUE - CONSERVATIVE (If price action conditions are right at that given moment.)
If it cannot break a TOP or BOTTOM of a BOX, It signifies a reversal.
NOTE:
1. That PRICE TARGETS for ENTRY and EXITS are DYNAMIC and can CHANGE from time to time.
2. Created a MONTHLY, WEEKLY & DAILY Analysis of a MARKET'S CHARACTER.
3. My Minimalist BOXES are designed for SWING TRADES at the LOWEST or START of a SWING CYCLE.
4. At times I will include a WAY BEYOND PARABOLIC PRICE TARGET, depending on The Character of the Market (CRYPTOS ONLY).
5. DYOR for your Fundamentals, Volume, Chart Patterns, Candlestick Math, FIB COILS ( ABC ), Price Action, FIB LEVELS, Market Dynamics, especially institutional and retailer trading psychology.
Wishing you all The Best Trades and Thank you all for your Appreciation and Support of My Work.
Much thanks to My 3 Mentors. They are so much of a Blessing that I also wish to share my knowledge.
Vive Le Autist!
Vive Le Diamond Hands!

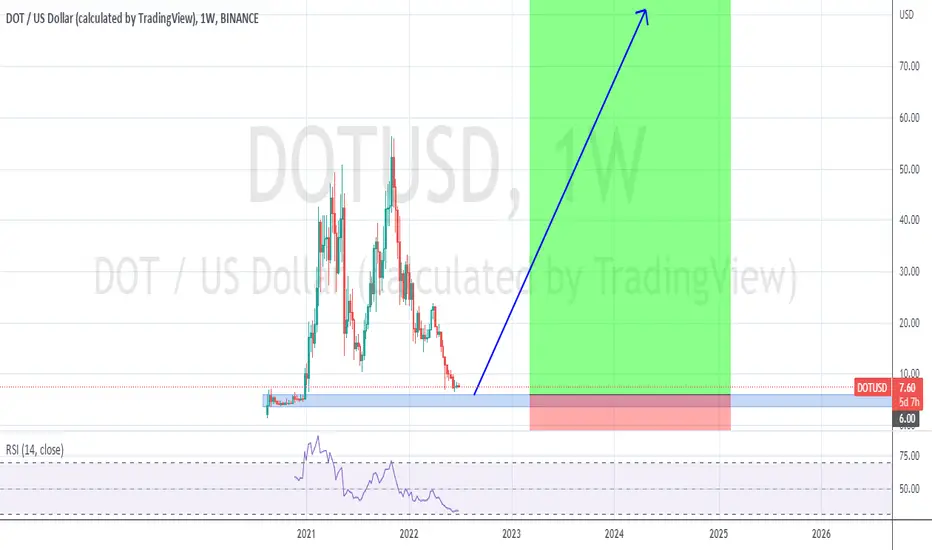
DOTUSD Long Term Bullish Projectioni am Looking #Dotcoin 80$ and 200$
Time is Money
Best regards Zeeshan Butt
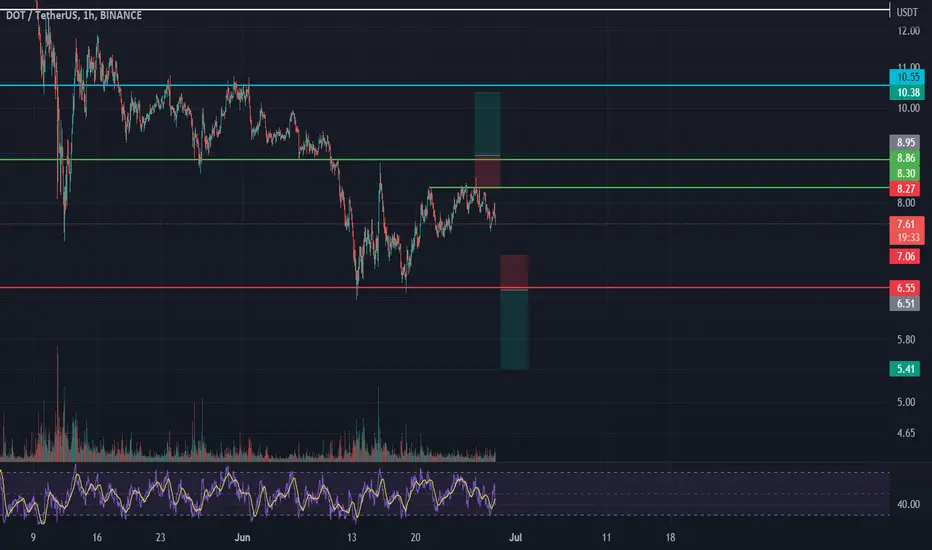
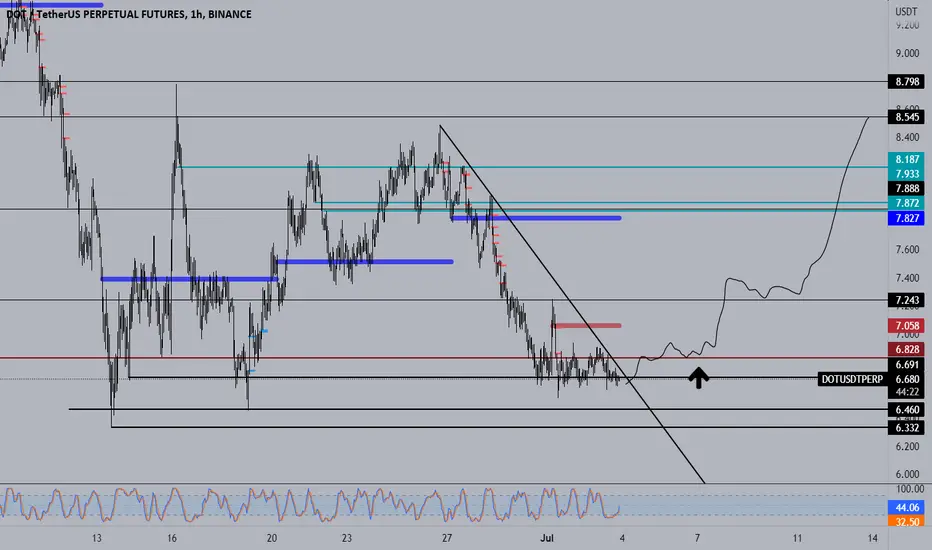
DOT
when the green line (8.86) and Confirmed by candle in 1H we can buy it with RR2
on the other hand if red line (6.55) broken and confirmed by candle in 1H we can sell it with RR2