DOTUSDTI have conducted a technical analysis of 1150 using the Janne School methodology, combining both numerical and temporal analysis. Based on my findings, I believe that 1150 is poised to reach a target price of 44 rs. My analysis incorporates various
DOTUSDT
Polkadot Dot usdt daily analysis
Time frame hourly
Risk rewards ratio =1.75
Target = 4.33 $
I expected the price to drop to $3.67 and then rise.
Now, in the short term, I’m opening a position with low risk. If this position gets closed, we’ll have to see whether the price breaks the green trendline or continues fluctuating between these two lines.

DOT is bullish now and many Traders don't see it !!The price is trapped inside a triangle, and it is currently at the triangle's bottom. If we look at previous lows, the price has typically seen strong growth after hitting the bottom. If the price follows previous trends, we should now expect a price increase.
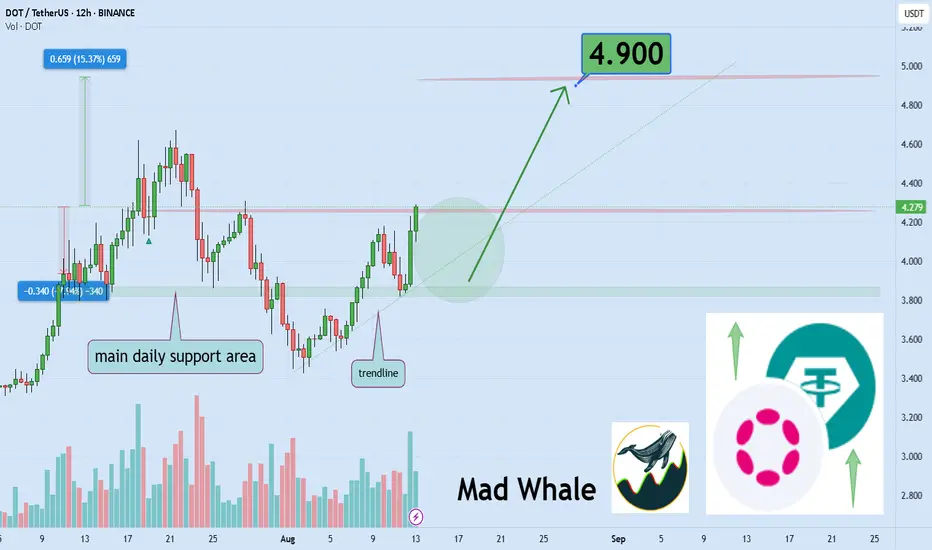
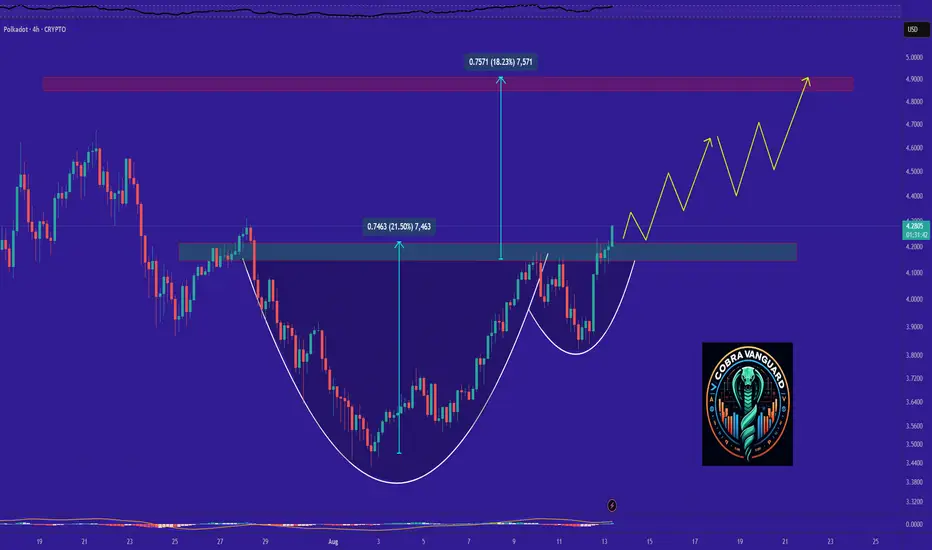
High Volume Support Could Push Polkadot 15% Higher Toward 4.90Hello✌️
Let’s analyze Polkadot’s price action both technically and fundamentally 📈.
🔍Fundamental analysis:
Polkadot added Elastic Scaling in Aug 2025 so parachains can rent extra power using DOT.
JAM upgrade is set for late 2025 to improve speed and cross chain links.
These updates could shape DOT’s activity in the coming months. 📊
📊Technical analysis:
BINANCE:DOTUSDT shows strong daily support and high trading volume 🚀. Maintaining this support could drive a 15% rally toward 4.90 📈.
✨We put love into every post!
Your support inspires us 💛 Drop a comment we’d love to hear from you! Thanks, Mad Whale
DOT is bullish now and many Traders don't see it !As I said,the cup and handle pattern has completed and broken out, which could quickly drive the price above $4.5.
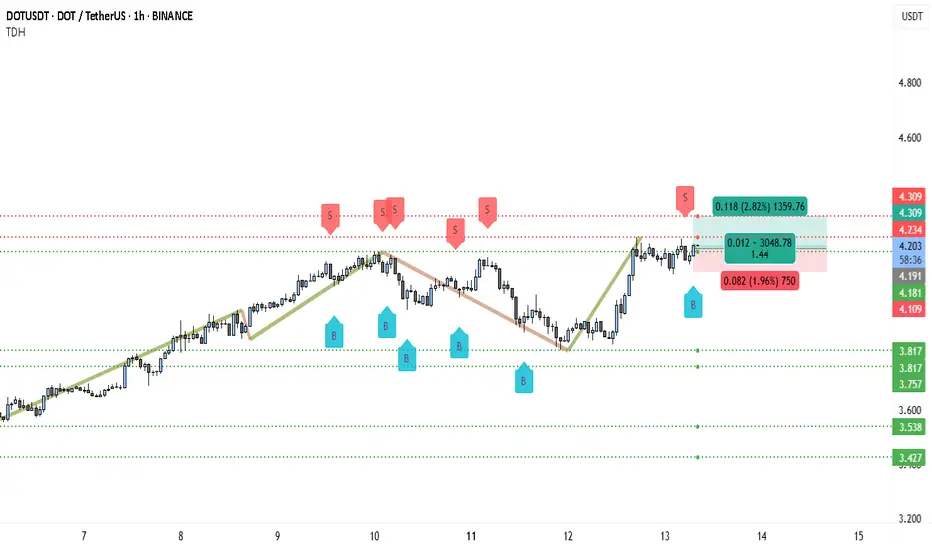
DOT Ready to Explode Above $4.20? Don’t Blink!📊 Market Structure
DOTUSDT is showing a bullish recovery after a recent pullback. From the August 7th low, the price trended upward strongly, making higher highs until around August 10th, where sellers took over and drove a retracement. The correction respected multiple support levels, and buying pressure re-emerged around $3.817–$3.757, leading to the latest rally.
Currently, DOT is trading just above the $4.181–$4.192 zone, which is a short-term support area. This level is important because it was previously resistance during the earlier uptrend and is now holding as a pivot for bullish continuation.
________________________________________
🔍 Price Action Insights
The chart shows multiple “B” buy signals during the dip phases, confirming accumulation zones. The most recent buy signal triggered right before price pushed toward the $4.309 resistance area. Sellers have previously been active around $4.234–$4.309, which explains the minor consolidation we’re seeing now.
The immediate upside target is $4.309 — a break and close above this on the 1H would likely send DOT toward higher resistances, possibly into the $4.40 area over the next sessions.
________________________________________
💼 Trading Setup (From Chart Data)
• Entry: $4.192 (current support & breakout retest)
• Stop Loss: $4.109 (below short-term support) – Risk ≈ 1.96%
• Take Profit: $4.309 (resistance) – Reward ≈ 2.82%
• Risk : Reward Ratio: ~1.44 : 1
________________________________________
📈 Bullish Scenario
If DOT holds above $4.181–$4.192 ✅, expect a retest and possible breakout above $4.309. Breaking that resistance could trigger a stronger rally toward $4.40+, with momentum building from the prior higher low.
________________________________________
⚠️ Bearish Risk
If $4.181 breaks decisively ❌, price could revisit the lower supports at $3.817 or even $3.757 before buyers attempt another push.
________________________________________
📌 Trade Management
1. Watch for bullish candles with strong closes above $4.234 — this would be the first sign of strength toward $4.309.
2. Take partial profit near $4.309 🏦 to secure gains.
3. Move stop-loss to breakeven once partial profits are taken.
4. If a breakout above $4.309 occurs, trail the stop under each new higher low to capture extended upside.
From this setup, DOTUSDT is in a bullish recovery mode and, as long as it stays above the $4.18 pivot, buyers have the advantage.
DOT/USDT Profit Heist | Don’t Let Bears Catch You🚨Polkadot Crypto Vault Break-In Plan | DOT/USDT Robbery Blueprint🚨
🌍 Hola Heist Crew! 💰📡
Ready for another vault-cracking strategy? Here's your DOT/USDT Crypto Heist Plan based on pure Thief Trading Style™—a fusion of smart-money tactics, technical traps, and stealth execution. 🎯💸
🔓 🎯 Entry Zone – Lockpick Ready
"The vault’s wide open! Swipe the bullish loot anywhere, anytime—but smart thieves plan pullback entries."
📌 Recommended: Use 15–30 min timeframe for sniper buys near swing highs/lows.
💡 Pro Move: DCA with layered buy limits like a seasoned thief stacking getaway routes. 🧠💵
🚔 Stop Loss – Evade the Patrol
📍 Secure SL just below the nearest 4H candle wick low (e.g., 4.000 zone)
🔐 Customize SL to match your risk profile & lot size—escape routes vary by thief rank.
💣 Target – Break the Vault & Vanish
🎯 TP: 5.200
🕶️ Optional: Dip out early if market heat rises near resistance traps. Escape clean.
⚠️ High Alert – Police Checkpoint Ahead
👮 Red MA Zone = Barricade.
It’s a hotspot for bearish cops + consolidation traps.
Only strong thieves survive here—book profits before you get cornered.
💼 For Scalpers & Swing Agents
🔍 Scalpers: Only ride long—quick bags, quick exit.
💰 Swingers: Follow the full robbery plan. Patience pays.
🎯 Trailing SL is your body armor—keep it tight.
📊 Fundamental Force Behind the Break-In
🔥 DOT/USDT is flashing bullish momentum supported by:
Sentiment shift
Intermarket alignment
COT positioning
On-chain data
📡 Stay updated via macro reports & sentiment dashboards—intel is profit.
📰 News Alert – Chaos Creates Opportunity
🧨 Avoid fresh entries during high-volatility news drops.
🎯 Trailing SL can save you during headline crossfire.
❗️Disclaimer:
This blueprint is for educational purposes only. Always conduct your own recon and apply strict risk management. Thieves who don’t scout first... get caught.
🚀 Boost the Heist – Support the Crew
💥 Smash that “Boost” if this plan adds value 💥
Your boost fuels more chart crimes, more profit hits, and a growing rob-the-market brotherhood! 💪💼📈
🧨 See you in the next job... Stay hidden, stay funded!
– Thief Trading Style™ HQ 🕶️🐱👤💰🚁

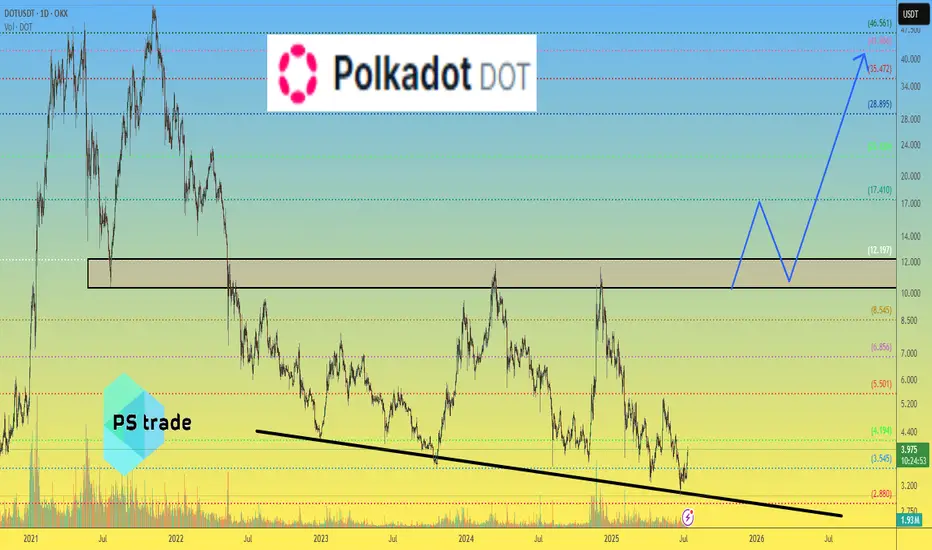
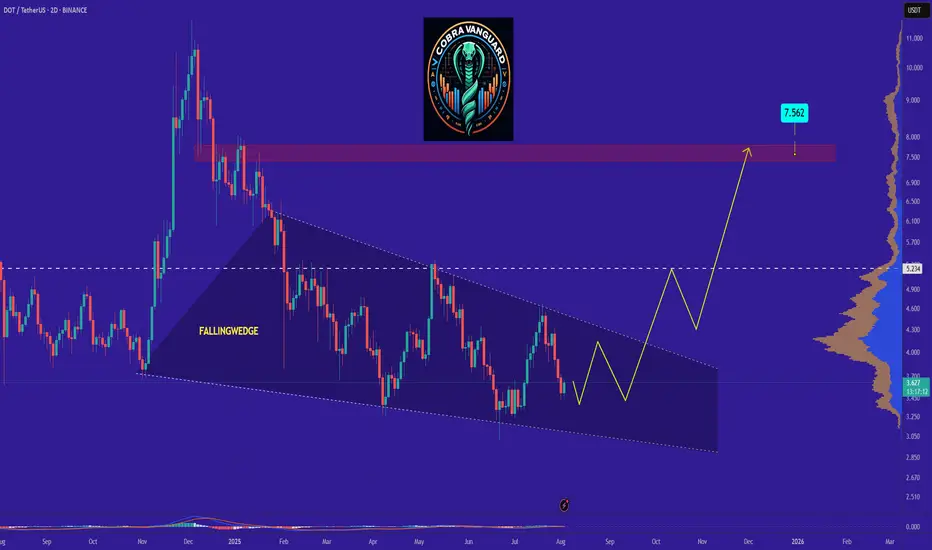
DOTUSDT - The Monster!It would be a shame if you’ve lost hope in DOT like many others have recently.
This is a strong project with a large market cap, and in every bullish season, it delivers solid performance — not explosive, but consistent. A moment will come when you’ll regret not buying it at $4.
From an investment perspective, its minimum long-term target is $40, while its more conservative mid-term target is $10.
Currently, the coin has broken out of a falling wedge pattern with a successful retest and has crossed above the 25 EMA on the 3-day chart.
These are all bullish indicators and a clear opportunity, especially with a nearby stop loss at $3.5.
Best regards:
Ceciliones🎯

DOT | Bounce Setup from Major Support ZonePolkadot (DOT) has dropped sharply in recent weeks and is now testing a significant support zone between $3.60 – $3.70. This level has historically provided strong demand, making it a potential launch point for a bounce toward higher resistance levels.
Trade Setup:
🔹 Entry Zone: $3.60 – $3.70
🔹 Take Profit Zones:
• TP1: $4.30 – $4.70
• TP2: $5.20 – $5.60
🔹 Stop Loss: Below $3.30
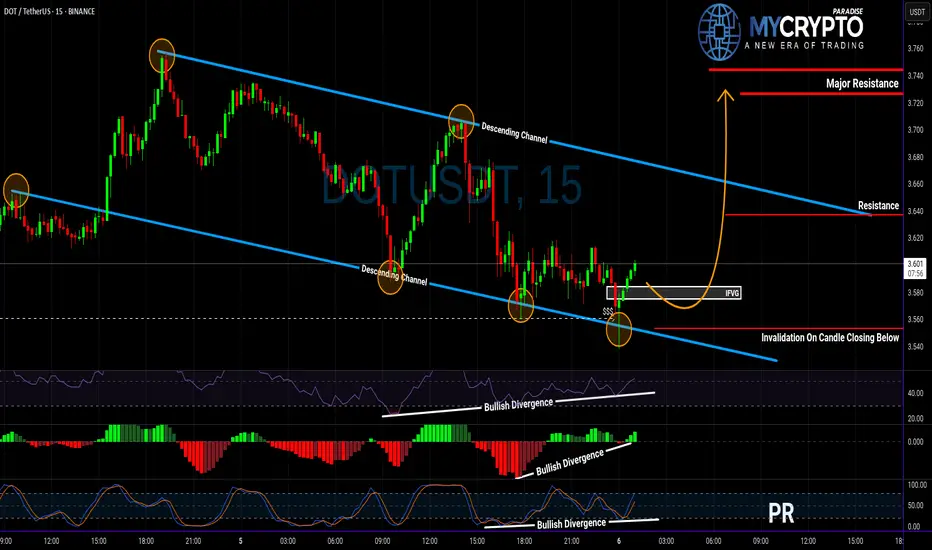
DOT About to Explode or Collapse? Read This Before Entering!Yello Paradisers, are you watching DOT closely? Because this setup could either give aggressive traders a golden entry—or wipe out the impatient ones 👀
💎DOTUSDT is showing strength after sweeping liquidity and now sitting right at the supportive trendline of its descending channel. What’s catching our attention is the clear bullish divergence on RSI, MACD, and Stoch RSI, which together boost the probability of a bullish breakout from here.
💎If we get a pullback, the IFVG zone (Inverse Fair Value Gap) below offers a clean setup for a high RR (risk-to-reward) trade. That would be a more strategic entry for patient traders. But for those who trade more aggressively, the current price is already offering a decent RR setup—just remember, this is not advisable for beginners. Patience and discipline remain key, especially in uncertain zones like this.
💎However, if DOTUSDT breaks down and closes a candle below our invalidation level, the bullish scenario is completely off the table. In that case, the smartest move is to step aside and wait for better confirmation before making any decisions.
🎖Strive for consistency, not quick profits. Treat the market as a businessman, not as a gambler.
MyCryptoParadise
iFeel the success🌴
Which altcoin hits the $50 club first? $INJ or $DOT? Which altcoin hits the $50 club first? CRYPTOCAP:INJ or CRYPTOCAP:DOT ? 🚀
3W HTF Technical Breakdown:
1⃣ CRYPTOCAP:INJ (@injective )
✔ Reclaimed structure above $13.31
✔ Targeting $31 → $52.98
✔ Clean 385% R:R setup
⚠ Invalidation below $8.79
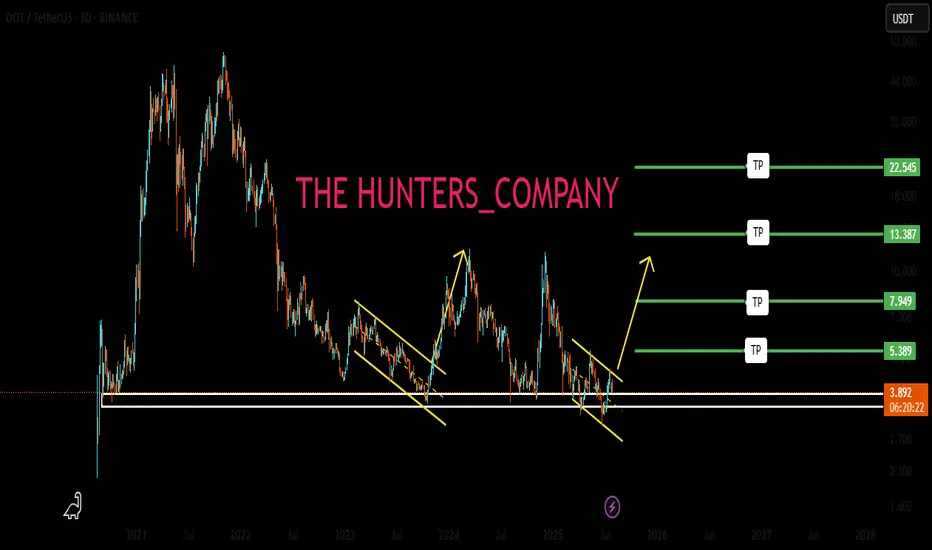
2⃣ CRYPTOCAP:DOT (@Polkadot )
✔ Bounced from multi-year TL + demand zone
✔ Hold above $3: Targets $16.67 → $24.37 → $55
✔ Monster 1,660% setup loading
Both charts are screaming high-conviction breakout.
The $50 race is on…
NFA & DYOR

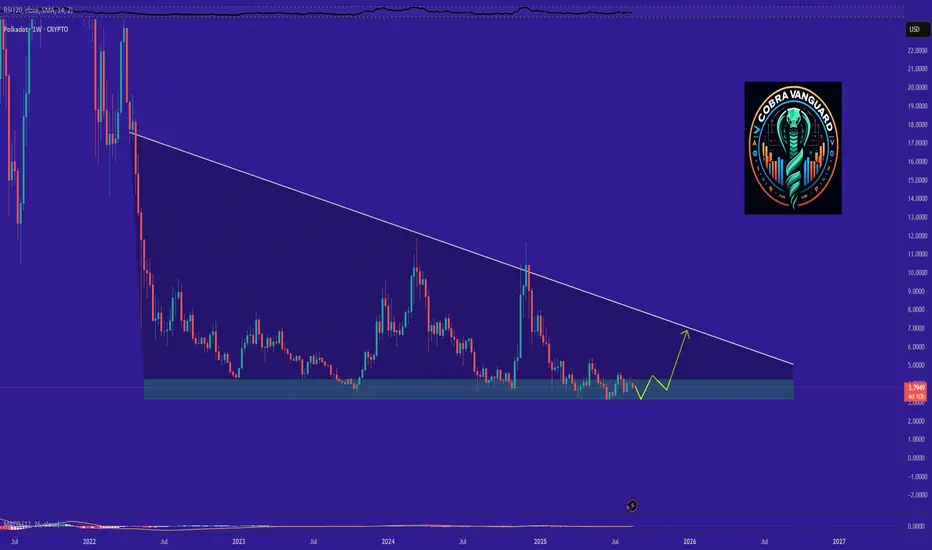
DOT is bullish now and many Traders don't see itSo if you pay attention to the DOT chart you can see that the price has formed a Ascending wedge which means it is expected to price move as equal as the measured price movement.( AB=CD )
NOTE: wait for break of the WEDGE .
Best regards CobraVanguard.💚
DOTUSDT On the Edge of a Major Rebound or a Devastating BreakdowPolkadot (DOT) is once again retesting one of its strongest macro support zones between $4.00 – $3.55, a historically significant demand area that has provided major price bounces since mid-2022.
This isn’t just a random level—it’s a critical accumulation base where large buyers have consistently shown interest. With price now hovering around this zone again, the next move could be decisive for DOT's mid- to long-term trend.
---
🔍 Price Structure & Key Patterns
Extended Accumulation Phase: DOT has been trading in a sideways range for over 80 weeks, indicating a potential bottoming structure forming after a prolonged downtrend.
Strong Historical Demand: The $4.00 – $3.55 region has acted as a key support multiple times since 2022, reinforcing its importance as a make-or-break zone.
Potential Trap Setup: Current price action could be forming either a bull trap or bear trap, depending on whether price rebounds or breaks down. Weekly candle confirmation will be key.
---
🟢 Bullish Scenario (Upside Reversal)
If price holds and prints a strong bullish candle (e.g., bullish engulfing or long-tailed hammer), expect the following upside targets:
Short-term: $4.75 – $5.88
Mid-term: $7.63 – $9.00
Long-term: $10.37 – $12.49, aligning with prior distribution zones
✅ A breakout from this long accumulation base could trigger a massive short squeeze and renewed buying momentum.
---
🔴 Bearish Scenario (Breakdown)
If DOT closes below $3.55 on the weekly chart:
Confirms breakdown from macro support
Opens downside risk toward $2.30 – $2.00
Would print a new lower low, extending the bear market phase and potentially triggering capitulation
⚠️ Speculative long positions should include tight risk management below $3.50.
---
🧠 Market Sentiment & Strategy
DOT appears to be in a "Capitulation meets Hope" phase—selling pressure is exhausting, but bullish conviction hasn't yet taken control.
Ideal entry zones lie within the current demand range, with tight stops.
Watch for a daily breakout or bullish momentum confirmation next week before committing to positions.
---
📌 Final Takeaway
> DOT is standing at the edge of a cliff—or a launchpad. The $3.55–$4.00 zone has repeatedly been the foundation for rebounds. If history repeats, this may be the beginning of a new uptrend. If not—brace for deeper downside.
⏳ The market is watching. Will DOT break out… or break down?
#DOTUSDT #Polkadot #CryptoTechnicalAnalysis #SupportResistance #CryptoRebound #BearishOrBullish #AltcoinOutlook #CryptoBreakdown #WeeklyChart #AccumulationZone #DOTAnalysis

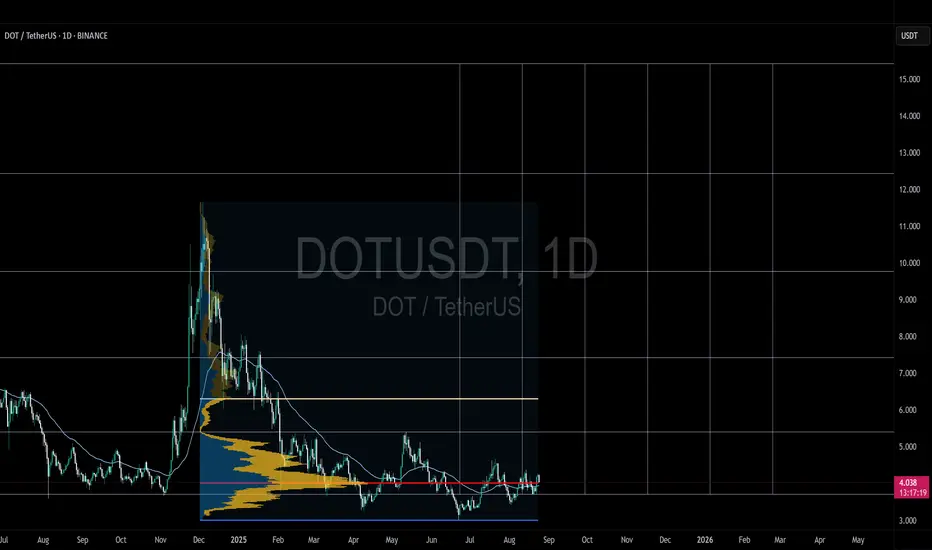
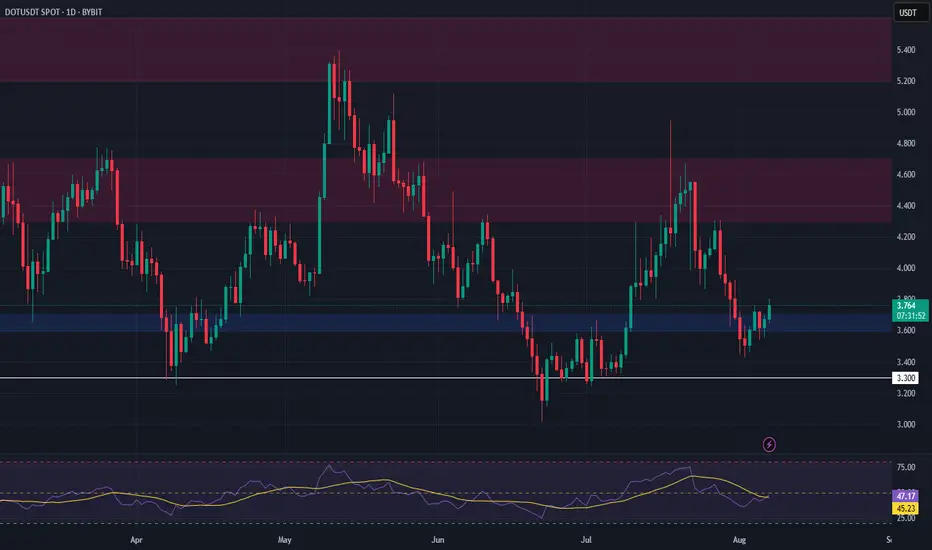
Polkadot · Trading at Bottom Prices · Bullish Scenario ExplainedThe same levels, the same prices, the same support zone. Polkadot is still trading at bottom prices. From the bottom the market tends to grow.
Good morning my fellow Cryptocurrency trader, I hope you are having a wonderful day. Notice the brown lines on the chart. We have the 7-April low, the June 22 low and also the low in March and yesterday, 1 August. This is a bottom range and this is the buy zone.
Polkadot (DOTUSDT) has been trading near this range since February 2025, six months ago. This is a very long—and strong—consolidation period. This much accumulation is surely the preparation for a major market change, a change of trend. A new uptrend. An event that has not happened since 2021.
I think the most important part is to truly understand that a bullish wave develops only from low prices. Notice the peak from December 2024. As soon as prices are high, the market seeks balance and starts to decline. But, when prices are low, an accumulation period develops and afterward a wave of growth. That is what I see happening right now across the market and with this chart. It already happened to hundreds of projects, literally. They all had the same chart.
These projects grew in late 2024, November-December. Then they went into correction in early 2025 until recently. The current low as witnessed on DOTUSDT led to massive growth. Some of these pairs are trading at new all-time highs while others have grown 500% or more. Those trading at the bottom are still early and next in line to move when the market does.
We will be bullish within days, as soon as Bitcoin ends its retrace. I shared in another publication why I believe Bitcoin will recover in the coming days.
Thank you for reading.
Namaste.

Price floor: The opportunity to buy has arrived.Hello friends🙌
According to the decline we had, you can see that the price has reached its historical low, which has given good profits whenever it reaches this low. Now, with capital and risk management, we can buy within the limits of the low and move with it to the specified targets.
🔥Follow us for more signals🔥
*Trade safely with us*
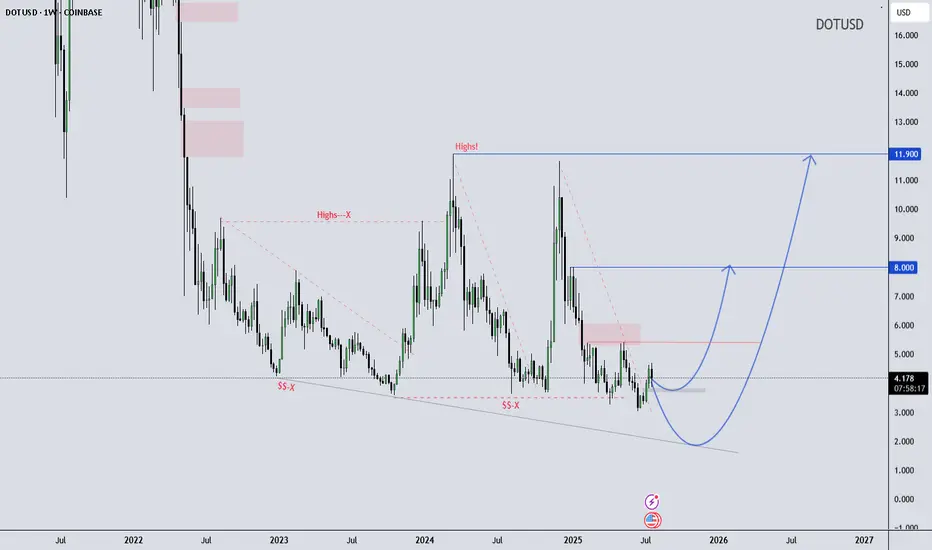
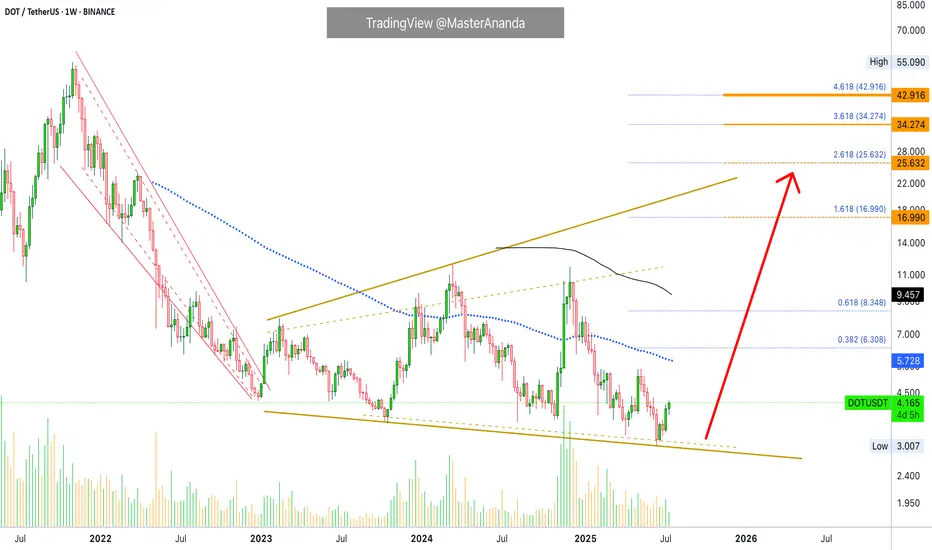
DOT/USD Weekly Structure - - Reversal Possibility Developing DOT/USD Weekly Outlook – Educational Perspective
Polkadot (DOT) is trading near the lower boundary of a long-term falling wedge structure, showing early signs of stabilization around the $4.20 support zone. Price has respected this level multiple times, potentially forming a rounded bottom, which often suggests shifting momentum.
If the structure holds, it may continue developing a macro reversal pattern. This kind of formation is typically monitored by swing traders looking for high risk-reward setups in longer timeframes.
Key Technical Levels to Watch:
$8.00 – Mid-range structural resistance
$11.90 – Historical supply / macro pivot zone
This chart is shared for educational purposes only to support market structure learning. Always follow your own analysis and risk management plan.
Wave Trader Pro
Learn & Earn
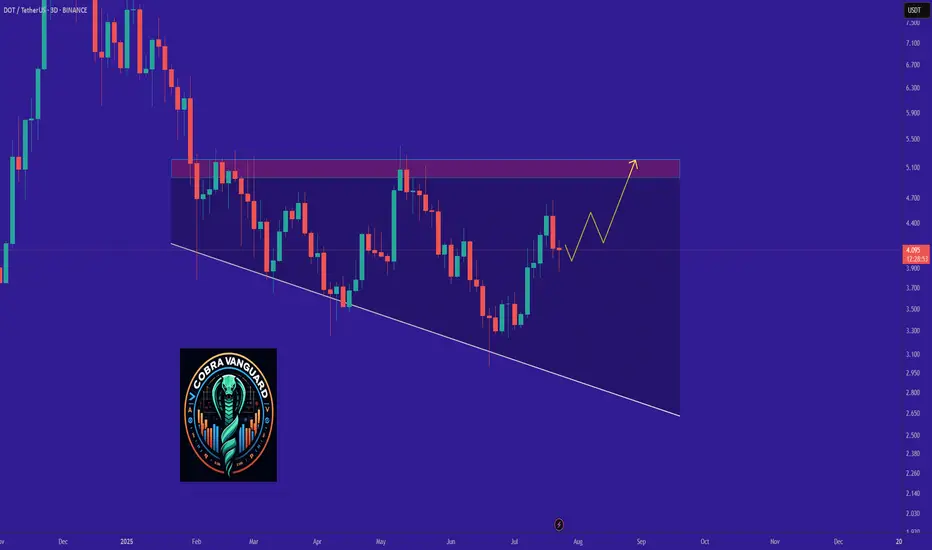
DOT It will grow soon...The DOT will increase $1 and reach to the top of the wedge in the coming weeks .
Best regards CobraVanguard.💚
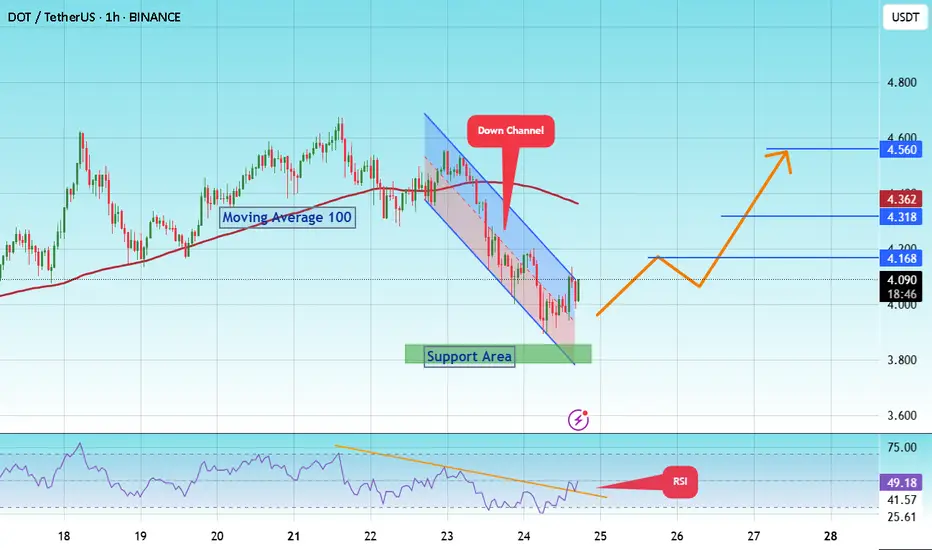
#DOT/Eyes 15% Rally, Targeting Key $ 4.560 Resistance Level#DOT
The price is moving within a descending channel on the 1-hour frame and is expected to break and continue upward.
We have a trend to stabilize above the 100 moving average once again.
We have a downtrend on the RSI indicator that supports the upward break.
We have a support area at the lower limit of the channel at 3,870, acting as strong support from which the price can rebound.
We have a major support area in green that pushed the price higher at 3,800.
Entry price: 4.084
First target: 4.168
Second target: 4.318
Third target: 4.560
To manage risk, don't forget stop loss and capital management.
When you reach the first target, save some profits and then change your stop order to an entry order.
For inquiries, please comment.
Thank you.
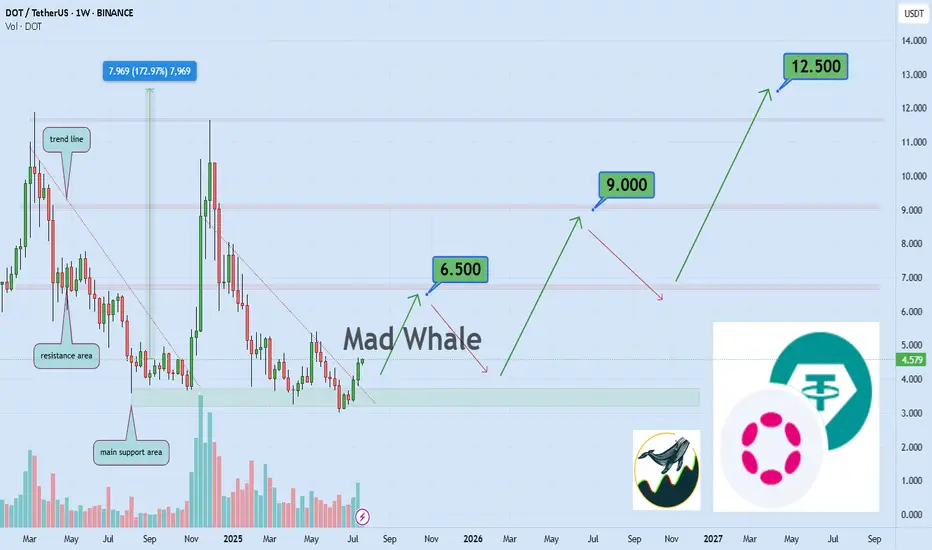
DOT Bullish Outlook: $6.5, $9, and $12.5 AheadHello✌
Let’s analyze Polkadot’s upcoming price potential 📈.
BINANCE:DOTUSDT , I expect a long-term upward trend.
This analysis includes three main targets: $6.5, $9, and a final target of $12.5, which could be reached within 2 to 6 years.
Strong daily resistance and support levels are clearly marked on the chart, showing that the price is following a healthy and reliable path.
✨We put love into every post!
Your support inspires us 💛 Drop a comment we’d love to hear from you! Thanks , Mad Whale🐋
🐋Many of the points and levels shown on the chart are based on personal experience, feeling, and over 7 years of research and daily study of crypto charts.
Some of the lines, channels, and price zones are drawn to make the chart easier to understand and to help imagine possible future price movements.
I’ve also included one very big drop in price even bigger than the others because in the crypto market, it’s common for prices to suddenly fall hard and push out small investors and traders with positions.
The targets on the chart are not guaranteed; they might be reached, or they might not.📚
📜Please make sure to do your own research before investing, and review the disclaimer provided at the end of each post.
DOT Eyes 15% Rally, Targeting Key $5 Resistance LevelHello✌
Let’s analyze Polkadot’s upcoming price potential 📈.
BINANCE:DOTUSDT has broken above multiple daily resistance levels and is now consolidating near a key support zone. With this bullish structure in place, I'm targeting a minimum 15% move to the upside, with $5 as the main take-profit level. 🚀📈
✨We put love into every post!
Your support inspires us 💛 Drop a comment we’d love to hear from you! Thanks , Mad Whale 🐋

DOTUSDT - A Sleeping Giant in the Bull Market?Polkadot (DOT) has always been one of the leading assets during bull markets
A $10 target now seems inevitable after a clean breakout above the main trendline, followed by a successful retest.🎯
This $10 level has historically acted as a major resistance zone, often manipulated during each bull cycle — price touches it, then sharply pulls back.
But the big question is:
Will DOT break this psychological barrier this time?
Why not?
With many investors losing faith in the crypto market and considering leaving altogether, this might actually be the perfect setup for a massive price explosion.
Historically, the craziest pumps tend to come when confidence is at its lowest.🚀
Best regards Ceciliones 🎯

Polkadot Opportunity Buy Zone · Near Bottom · 2025 Bull MarketThis is what I mean: Opportunities are endless in this market. Compare Polkadot to say, Solana or Cardano which I shared just recently. Can you notice the huge difference?
First, Polkadot is still trading below EMA89 and MA200 weekly. Not to be taken as a bearish signal but instead to be interpreted as the pair being very early in its bullish cycle.
While Solana is trading ultra-high, super-strong, one of the strongest pair, which is bad if you want to go LONG (high risk with a small potential for reward), Polkadot is trading within the opportunity buy zone, very close to its bottom (low risk vs a high potential for reward).
I am a buyer. I am a Cryptocurrency fan. I am a bull.
So I want low prices and that is why low prices are good.
This is an opportunity, DOTUSDT. It is trading low now but it won't be trading this low for long, not even weeks. It is likely to start advancing within days. Once the bottom is gone it is gone forever. These altcoin projects will be the new tech giants and they will rise long-term. This is your chance. This is your opportunity for long-term trading success. Once you catch the bottom, you can't go wrong.
The chart is showing a long-term broadening channel. This is part of the transition period, from bearish to bullish, the consolidation phase. While the channel looks pretty big, the swings, if you activate the linear chart you can see the truth. Perspective. You will see a true bottom on the chart. From the bottom we grow.
When the action challenges the lower boundary of the channel, support; the market reverses, in this case Polkadot will start to go up. It is already growing. Several weeks rising. The upper boundary is the minimum giving us more than 425%. But we are not aiming for the minimum, we want high in the least, we want the maximum, so let's go for a new all-time high or just below the last one.
Namaste.
Polkadot DOT price analysisAt night, only CRYPTOCAP:BTC impressively updated its ATH, while the rest of the altcoins... haven't really woken up yet after many months, if not years, of hibernation.
For example, if memory serves, in 2020, CRYPTOCAP:DOT was buying at $1.7-1.9 during the presale (please correct me in the comments if I'm wrong). Now, the price of OKX:DOTUSDT is not that far from the initial price.
🤪 It seems that no one believes in the ultra-fashionable #Polkadot “parachain” fairy tales anymore, and that is why if the price of #DOT rises again to $11-12, it will be super happiness and luck.
✈️ Well, dreams that #DOTUSD will cost $42 again can only be included after the price has firmly consolidated above $12, and with the current price dynamics, this is something at the level of fantasy.
_____________________
Did you like our analysis? Leave a comment, like, and follow to get more