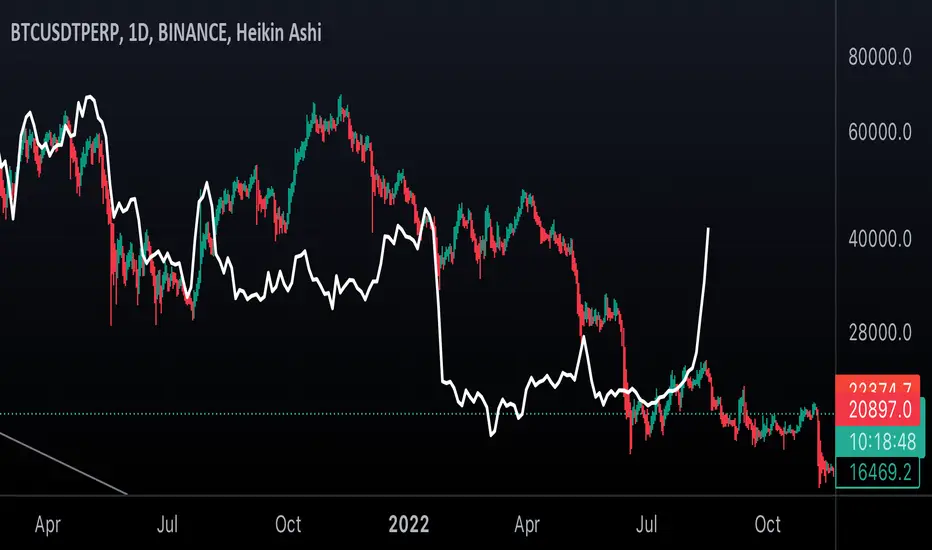
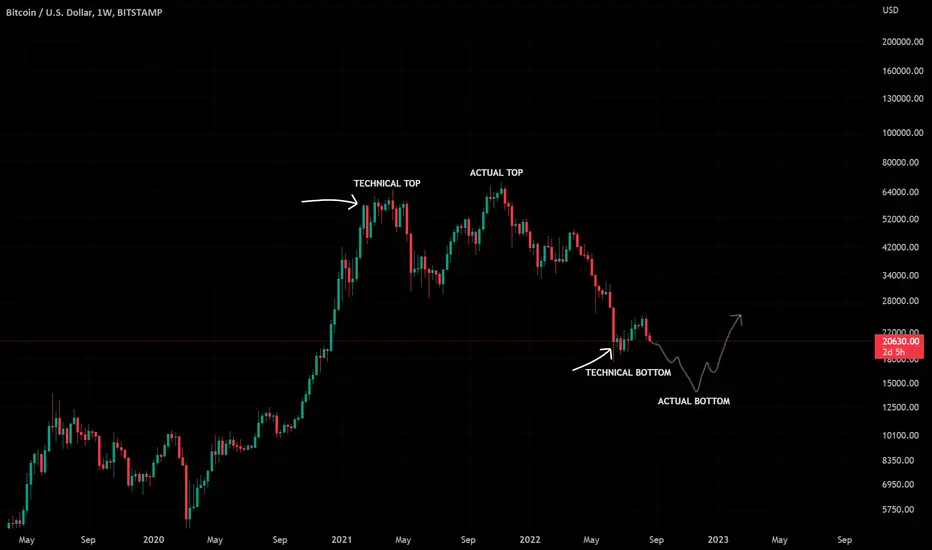
2021 a “Double Peak”-BullRun?! Last cycle , (if market manipulation is wasn’t a “thing”!)
Wonder where that vertical line on the right would have gone…
Hmm, perhaps we’ll see that somewhere soon!!
Anyone wants to buy a Bitcoin? Get ‘em while their hot!
Double
Double bottom in Credit AgricoleThe algorithm shows an opportunity to buy credit agricole if the double bottom pattern breaks.
The double bottom pattern is a bullish reversal pattern that appears on a chart as two distinct bottoms at roughly the same price level, separated by a peak in between. The pattern is formed when the price of an asset falls to a support level, bounces back up, falls back down to the same support level, and then bounces back up again. This pattern is considered bullish because it suggests that the asset's price may be about to start rising again after a period of decline.
One way to trade the double bottom pattern is to wait for the price to break above the peak that separates the two bottoms. This is known as the "breakout." Once the price breaks above the peak, it is a signal to buy the asset. Some traders may also set a stop-loss order below the second bottom, to limit their potential losses in case the price does not continue to rise.
So, a possibility is to wait the break of 10,2 level and look to sell in the next area where volume increase and we also find supports & resistances (11,50€).
A break of the small black line could also be a great point to buy, but it's not a confirmation of the larger double bottom pattern.


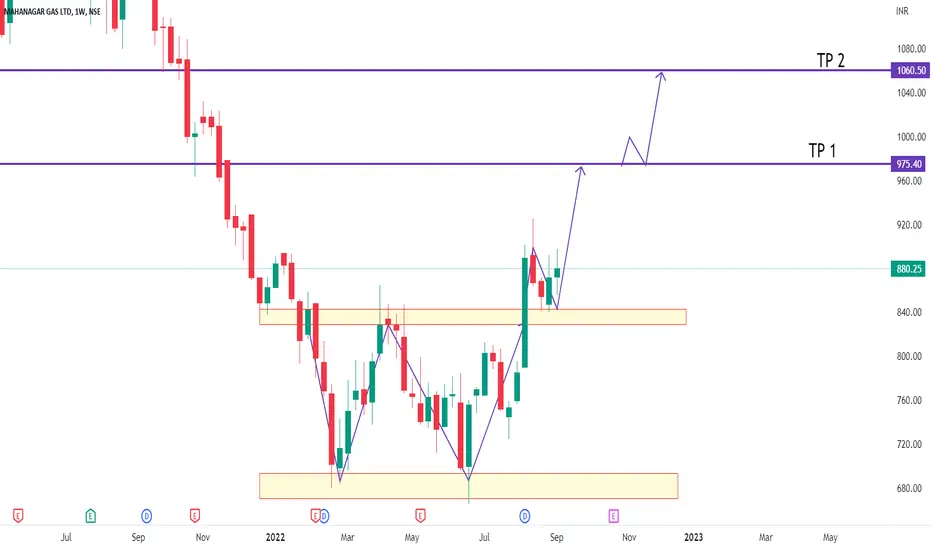
MGL Weekly Double Bottom with retest also done looking good current market price high probable trade !
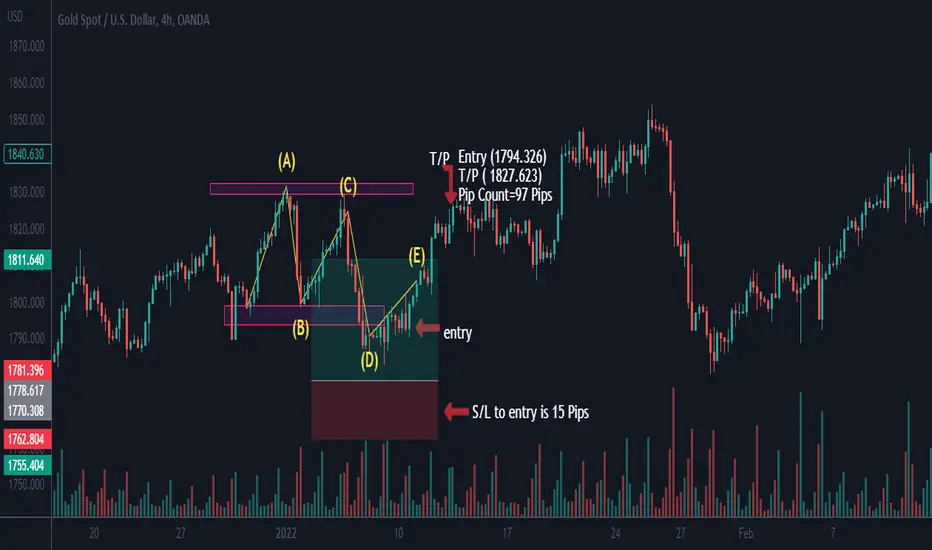
XAAUSD-Double TopHad to create a double bottom on a gold us pair (XAUUSD). For FMI (Forex Mastery Institute).
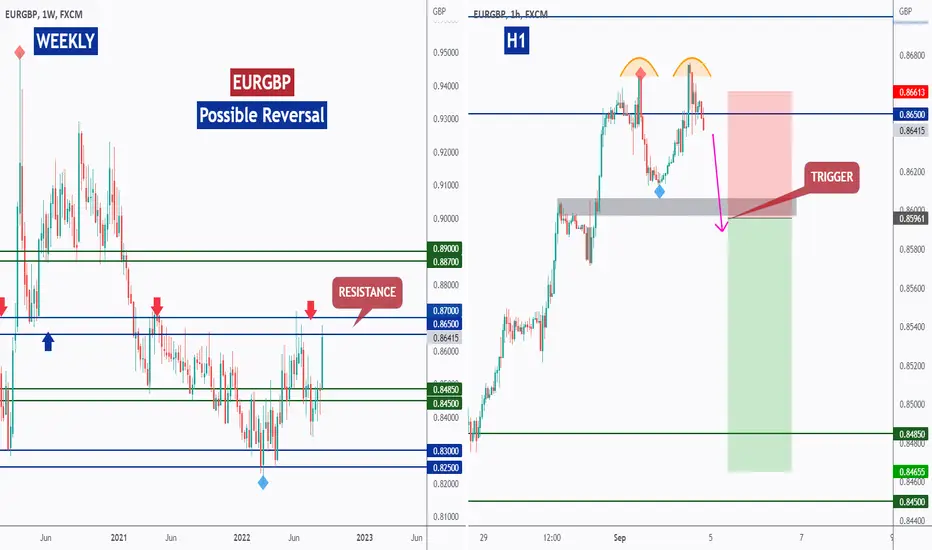
EURGBP - Potential Reversal!Hello TradingView Family / Fellow Traders. This is Richard, as known as theSignalyst.
on WEEKLY: Left Chart
EURGBP is approaching a resistance zone so we will be looking for sell setups.
Knowing that EURGBP can still trade higher inside the zone before going down.
That's why we don't sell blindly, we always zoom in to lower timeframes and wait for the bears to take over.
on H1: Right Chart
EURGBP is forming a double top pattern but it is not ready to go yet.
Trigger => waiting for a momentum candle close below the gray neckline to sell.
Meanwhile, until the sell is activated, EURGBP can still trade higher.
Which scenario do you think is more probable and why?
Always follow your trading plan regarding entry, risk management, and trade management.
Good luck!
All Strategies Are Good; If Managed Properly!
~Rich
CHF/JPY SHORTShorting Potential:
- Double top
- Price has rejected major resistance.
- Price came back to re-test local up trendline and rejected it.
- Price rejected the 618 level.
- Evening Star pattern + Now we have just closed with an engulfing bearish candle signalling a shorting potential.
- Divergence in RSI on 2HR TF and slowing buying momentum signalling a change in price.
** Stop Loss just above the 618 fib level and Targets at 50% of the way down from the 2nd August Low.

BTC - Double TroubleI believe the technical bottom has formed similar to the technical top formed in APR 2021. Many of the same indicators used to determine this top are also suggesting that a bottom has formed. However, I feel that the actual bottom may be some what lower around 14k. The 400WMA might be a key level of support to bounce off when forming the true bottom over the next couple of months. I think it would act as an excellent buying opportunity and entry into crypto market.
Eve And Eve Pattern
#BTCUSD Eve and Eve Pattern #btc
Round tops, Black line is confirmation line of the bottom it Breaks down. 28 29k area is crucial to decide if the bear market continu's. f it breaks we will see a new test ATH in the future. If it holds we will see lower.

Amazon Stock Monthly Chart AnalysisAmazon #AMZN Stock from Nasdaq Monthly Chart Analysis %95 Accurate Trade Setup 🎯 Enjoy🎉 🎊 ( NOTE : The tips of the arrows indicate TP levels ! )

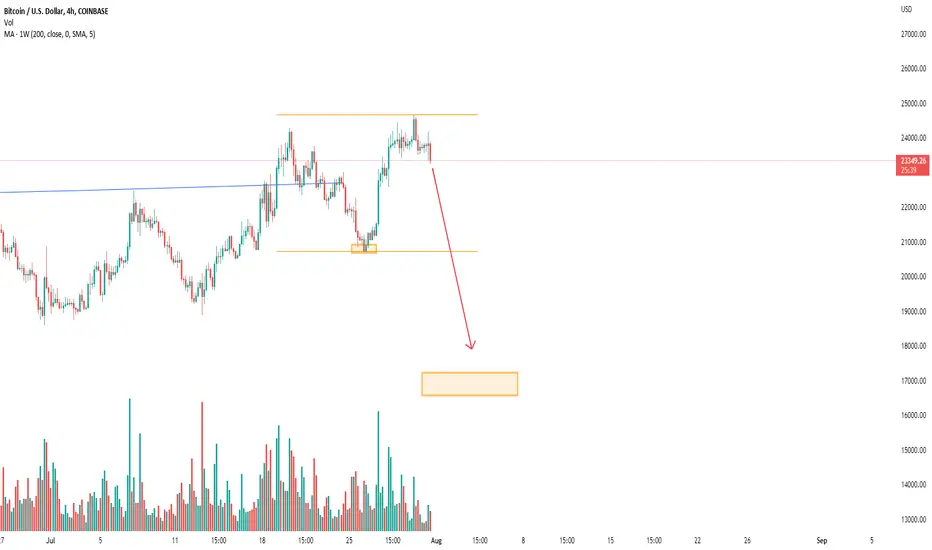
Bitcoin Double Top FormationBTC is forming a double top after attempting to break above the 200WMA for the second time in ten days. Expecting the price to drop around 27% to 16,800 or so.
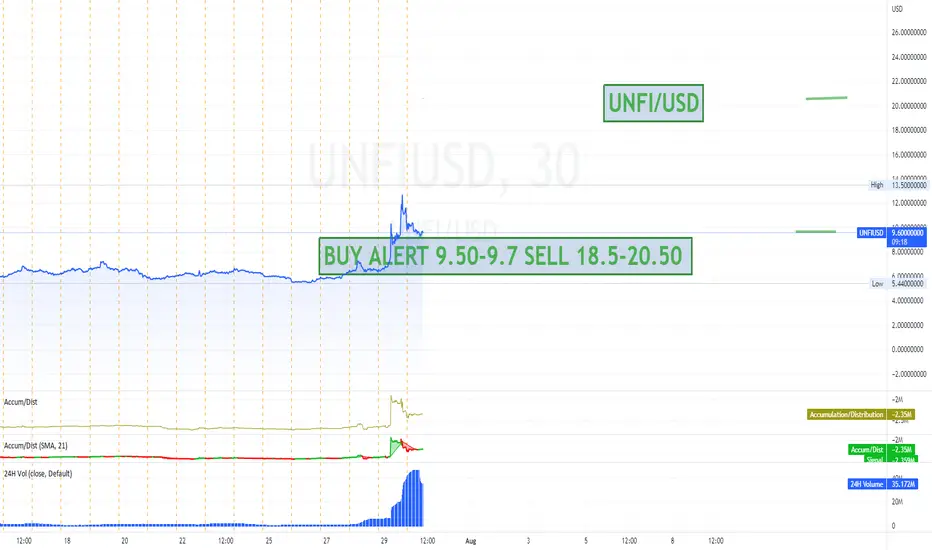
UNFI/USD DP ACTIONLOOKING FOR A DP ON UNFI/USD. LETS SEE If this one will pan out as a dp been watching for a while.
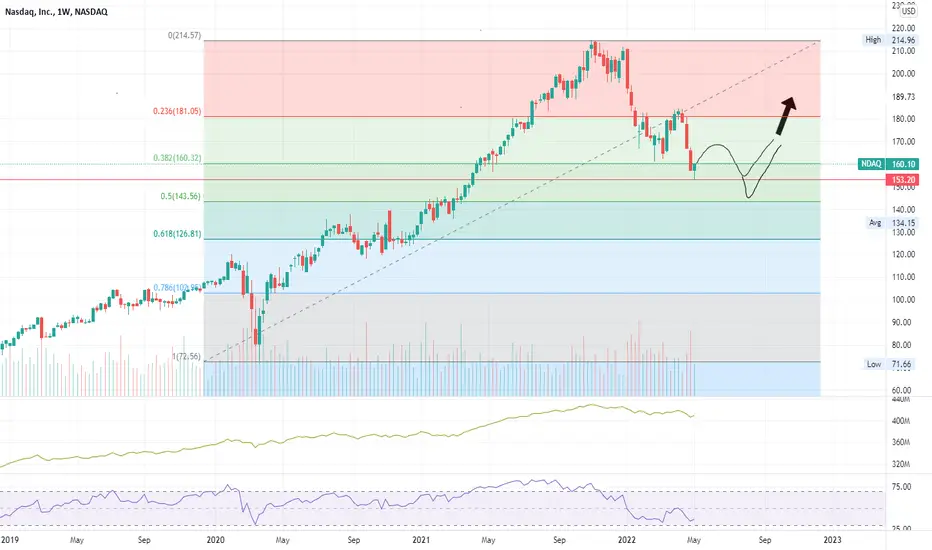
Scenario - Nasdaq, BTC, AltsAs there is still a large correlation between BTC and Nasdaq, we can hypothesize this scenario:
Double low for the Nasdaq, which sees an upward rebound before its achievement, at the same time BTC would also recover, fluctuating up to a threshold (approximately) of 45K and then creating a double low of 32K (January low). Also the Dominance has reached the 50% retracement level, I expect a descent of this, therefore, a flourishing period of the altcoins.
This analysis is a medium-term hypothesis, it will be explored in detail later.
DOUBLE BOTTOMInteresting double bottom completed, over a multi week base, indeed, volume surged at last week closing above accumulation area, minimum upside potential can dictate a 1.7 R/R.

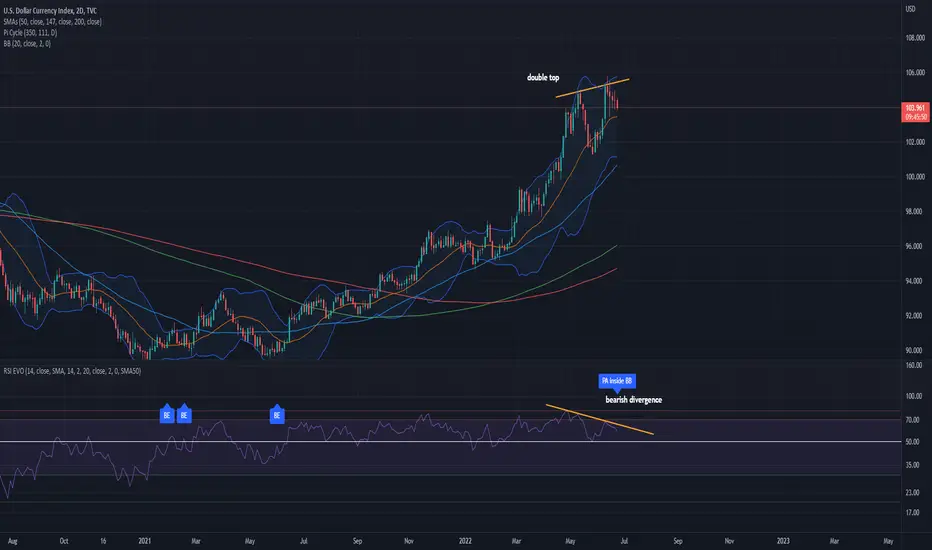
DXY - Bearish divergenceRefer to chart. Already started dumping
very brief desc very brief descvery brief descvery brief descvery brief descvery brief descvery brief desc
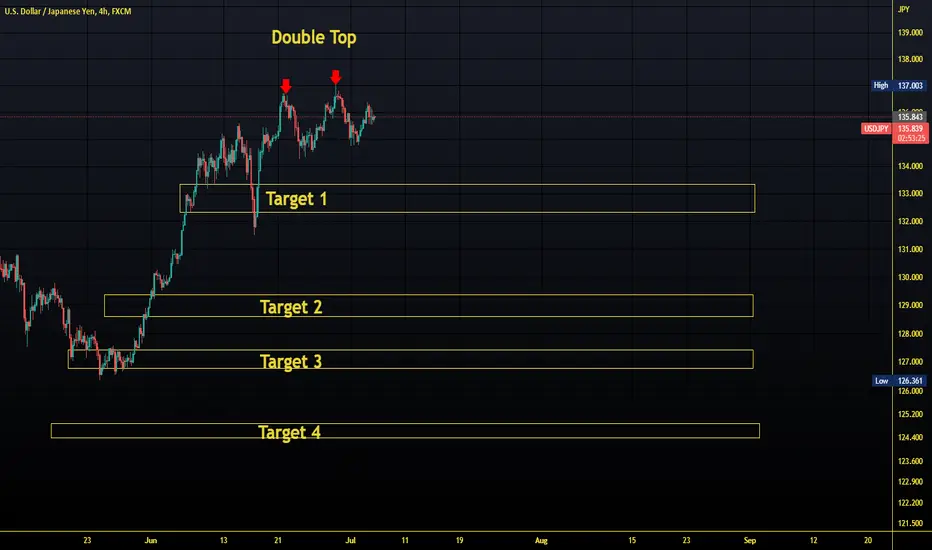
USDJPY SHORTWe have a double top in play. We can expect price to eventually correct after having a nice rally sicne May 24th. Targets 2 and 3 are Fibonacci levels of the 61 and 88 levels. Targets 1 and 4 are fib extension levels. Wait for price confirmation before establishing any short positions.
LITUSDT created a M PatternThe price is creating an M pattern on the 4h timeframe after a double top on 1.2$.
On the daily timeframe the price bounced on the dynamic daily support.
How to approach it?
IF the price is going to have a rejection from the 0.5Fibonacci level, on the M neckline, According to Plancton's strategy , we can set a nice order
–––––
Keep in mind.
🟣 Purple structure -> Monthly structure.
🔴 Red structure -> Weekly structure.
🔵 Blue structure -> Daily structure.
🟡 Yellow structure -> 4h structure.
–––––
Follow the Shrimp 🦐

AUDNZD LONG We are currently seeing a formation of a double bottom , if price breaks the threshold, then we can go long,

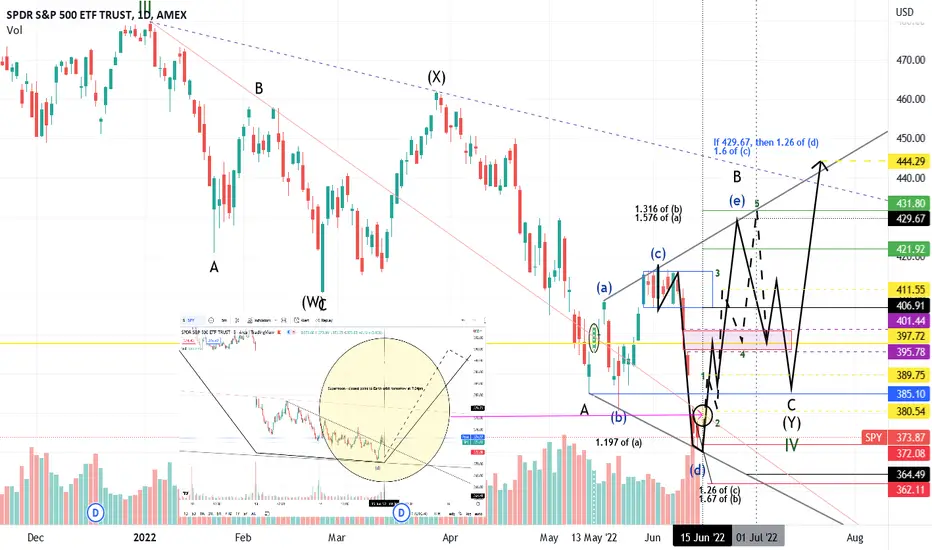
Witchcraft: Grand Finale UpdateSee Chart and Previous Idea. Can refine to more precise expectations from here, still just approximates. Near-term downside risk still to 362, but probability favors technical bounce from here which could trigger a squeeze... and if SPY wants to bounce exactly at the bottom of the expanding triangle I drew in, chances are it will continue to respect it 4 legs in.
I just used an If-then statement conditioned on leg (d) being realized at today's low and a gap fill to 389.75 occurring following FOMC. From there I populated most likely path to (e) via Elliot Wave mixed with Witchcraft. So, something like: 370.59 -> 389.75 -> 380.54 -> 411.55 -> 397.72 -> 429.67.... -> 385.15 ------> breakout of expanding triangle at 444.29 later on in 2022.
The pasted image of the 5min SPY chart is zoomed in at the price action, thus far around the visible span of this supermoon (closest orbit to earth will be tomorrow at 7:24pm.. FEDS be spookin'). It implies a local downtrend line was broken going into close, we still need to get back above the red downtrend line at the higher time frame around 379-380 to attempt first gap-fill. My gf sent me the screenshot of the moon thing and says we're going to moonwalk.. shes a witch. The (W) C above the pasted image, that stands for Witchcraft.
I hope I see you all on the moon by end of June, else pray for my soul.
Imperio,
HeWhoMustNotBeNamed
P.S. The big money doesn't know Occlumency
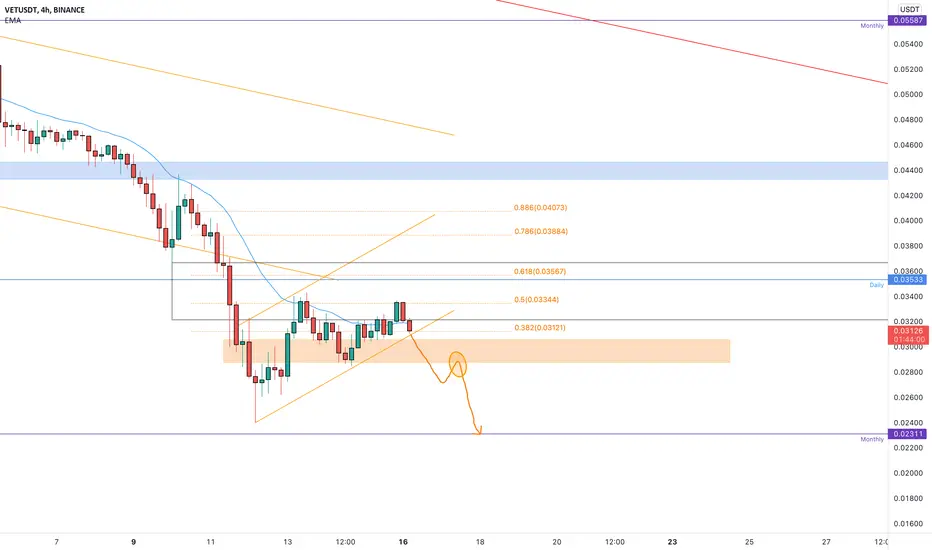
VETUSDT wants the Monthly support againThe price is creating a bear flag on 4 timeframes after the first pullback as I told you.
What's the next?
The price needs to hold the 4h support on 0.3$ after rejection on 0.5 Fibonacci level.
How to approach it?
IF the price is going to have a breakdown from the support and retest as new resistance, According to Plancton's strategy , we can set a nice order
–––––
Keep in mind.
🟣 Purple structure -> Monthly structure.
🔴 Red structure -> Weekly structure.
🔵 Blue structure -> Daily structure.
🟡 Yellow structure -> 4h structure.
–––––
Follow the Shrimp 🦐
Persistent is ready to Break Double Top Persistent is ready to break double top it can be sell because of double top and also trend of Persistent is down trend and double top target is Rs. 2514 and taeget of 1 is Rs. 3100 so it can be sell and my opinion is it can be sell and STOP LOSS is Rs.3798 And thank you to visiting this channel and pls like and follow me
TECHDARSHRESEARCHER and come here every time and pls comment below and have a good day bye bye.
Sell it your own risk.

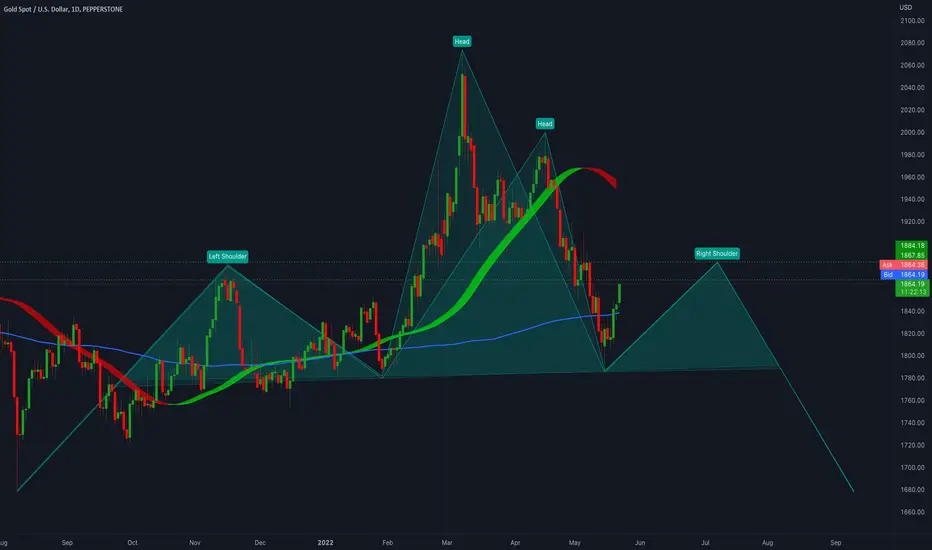
Double Head and Shoulder Gold DailyMostly look like Double Head and Shoulder Gold Daily, once Right shoulder give confirmation we can go short
Double Bottom on 1hr/4hrDouble bottom setup appears on the 4hour chart as well as the 1hour chart. Cautious of a likely sell due to China lockdown slowing down economy. Be on the lookout!
