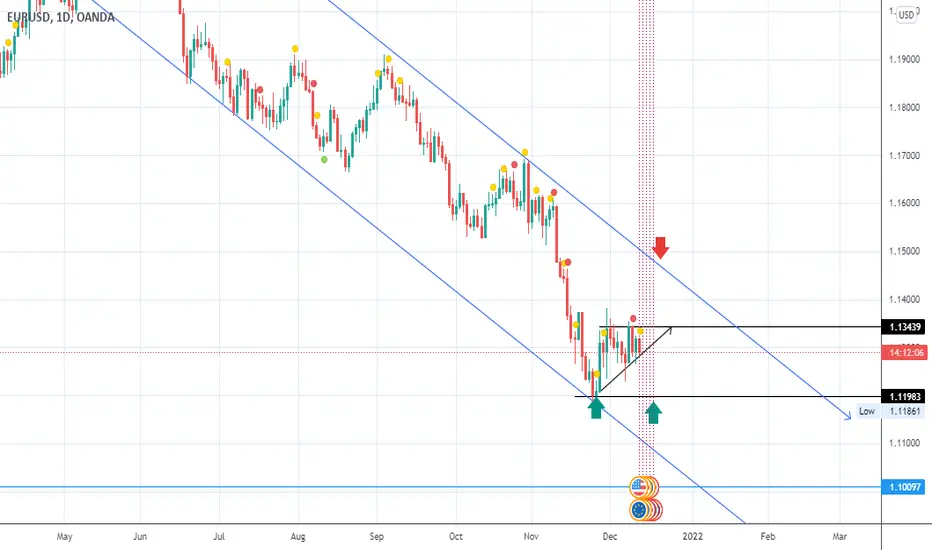
EURUSD DESCENDING CHANNEL (SELL or BUY)The daily chart is where we get the overall perspective of where the market might be headed and can influence how the market behaves from other timeframes. now in this case we see EURUSD creating a descending channel right? yes, and we should be looking for sells because the market is still channeled in between right?
However, my chat is that we should look at the little triangle created, what about it? The triangle is now telling us that price will either break above or below the triangle. Should that happen then we will be able to make an informed trading decision. If it breaks above, we will be surely buying this market. But be careful when this breaks below the triangle, because the market maker might just trap sellers. Why I say this, is because of the left leg directly under the triangle, so when the market breaks below, the market maker might just be looking to create a second leg that will complete the double bottom pattern.
I have created a logical trading synopsis, it is fully your choice to read up. Unless you think this is utter gibberish!!!
Double
EURJPYThe short may have already left without me, but i am more interested in buying from 127.500 area
Possible double bottom with plenty of liquidity for anyone who is currently long from that price area..

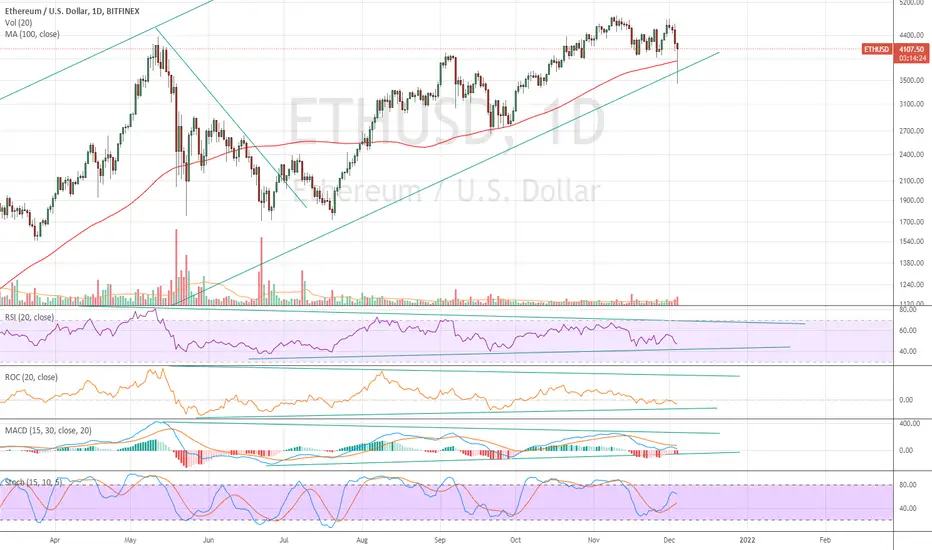
MASSIVE HANGING MAN FORMING ON ETHEREUM - GO SHORTAfter Ethereum's drop and recovery today, a massive hanging man candle formation has formed. This is a strong indication of an imminent collapse in Ethereum. Short positions anywhere above 4100 can be traded. I think cryptocurrencies in general will enter another bear market. A double top has formed in Ethereum and Bitcoin too. Both these chart patterns are the harbinger of doom. Close longs, go short Ethereum.
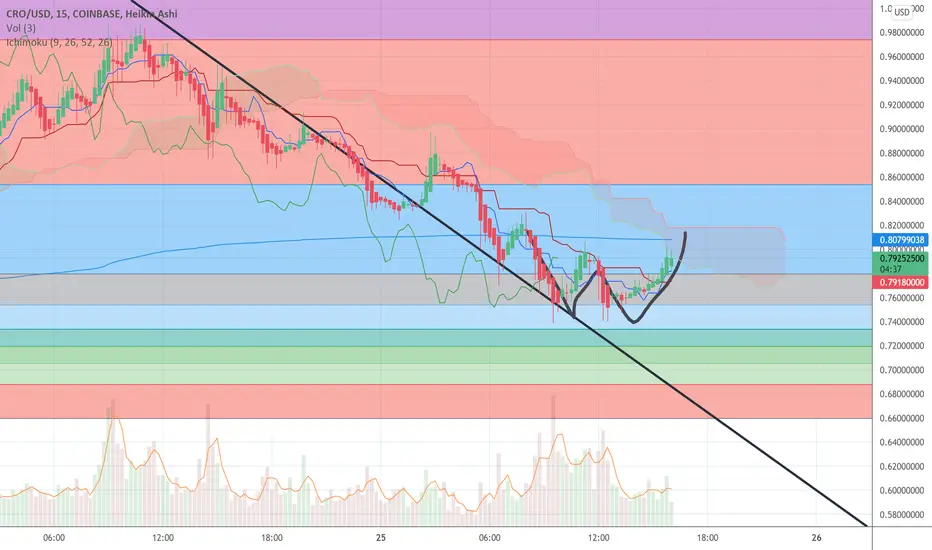
Double bottom very bullish for CRODouble bottom formed for CRO at fib level. Would wait for confirmation above 0.8310 to buy in.
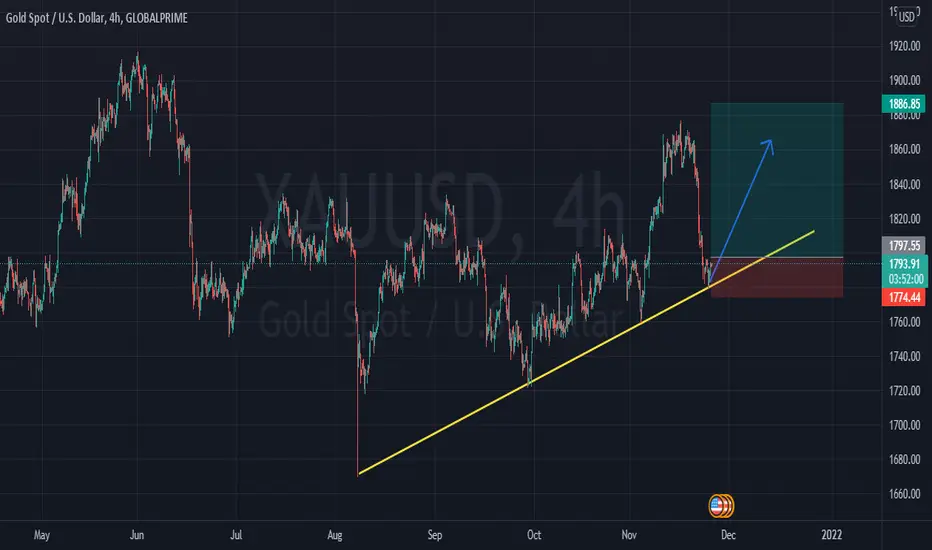
XAUUSD LONG IDEAHey guys, this pair hit our previous target level after the sell off (refer to previous analysis) From this zone, I expect this pair to resume it's bullish movement.
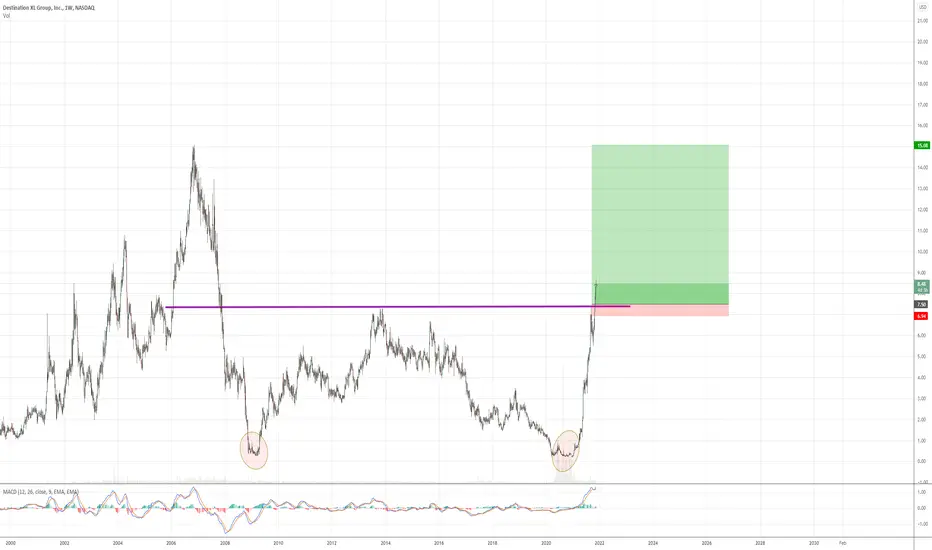
Double Bottom on DXLG ; Double profit potentialPretty self explanatory. Comment if you need clarification
AMZN 2HR chart BULLISH double bottom?i SPY .... a BULLISH double bottom reversal or a 8/9 EMA ride .. EITHEr way still bullish .. lets get it!! been giving the public to much sauce lately.. sike nah luv yall! trade safe!!

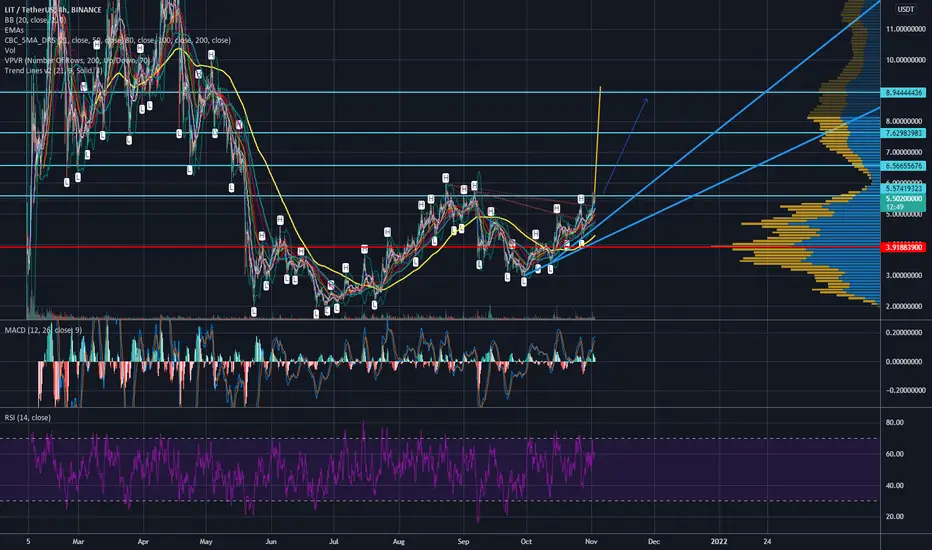
LIT / USDTLIT has a very strong technical pattern. a break above the double bottom neckline would mean a move to the higher targets. of course, it may retrace to the blue trend, which would be a buy zone.
A beautiful long move for Gbpjpy A beautiful long move for Gbpjpy if resistant levels breaks further

xrpusd ready to go long!green box is our buying zone, created a double bottom. now it has created a smaller bull flag.
Swing target #1 is 1.62 target #2 is 1.91. see ya there

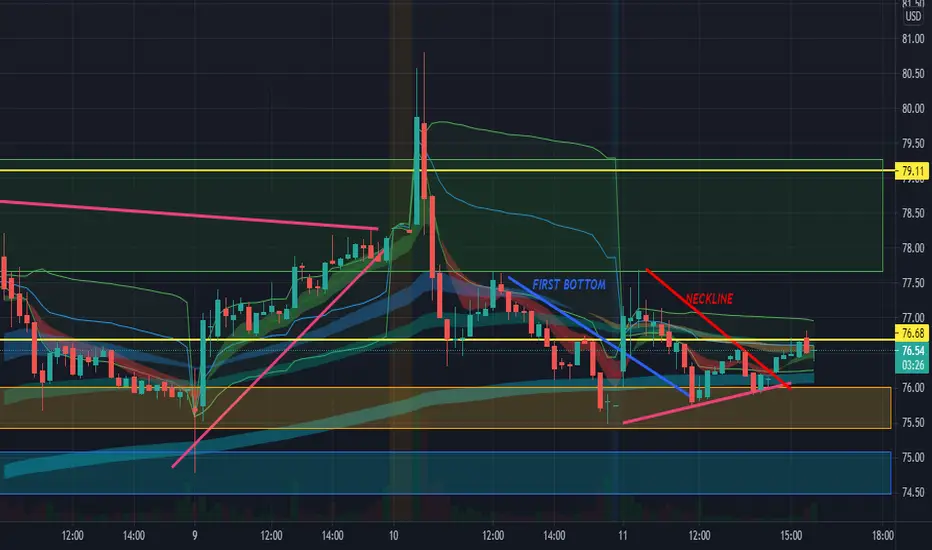
oil possible reversal now fouble top pattern detected and the neck is broken and retested now i suggest as follow
entry price : sell stop @ 81.40
Tp : 80.30
SL 82.30

es might be breaking higher. gov debt default still looming.all the signs of a great long opportunity. Ideally you are in at 4320, but I'm only checking in now. That's the latest.

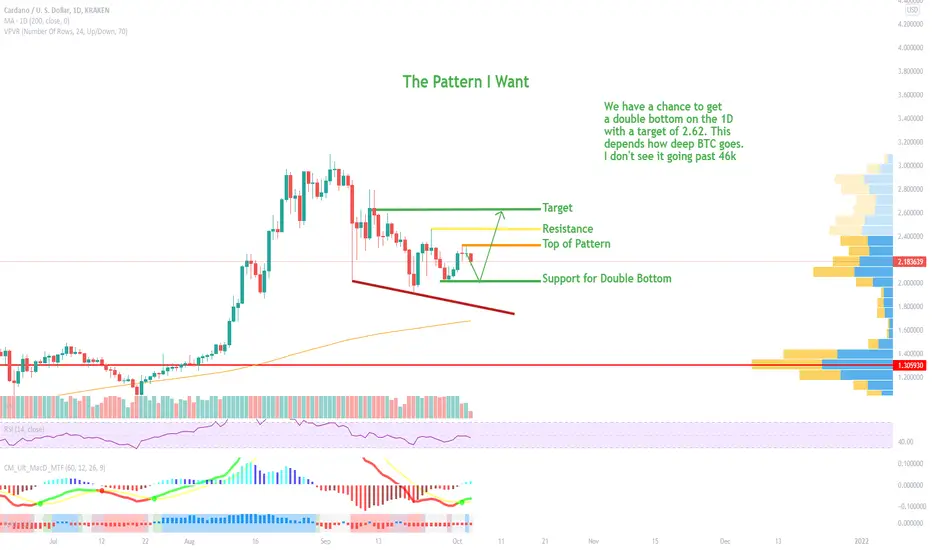
ADAUSD Chance for Double BottomImportant things to note:
BTC retracting has started.
I do not see BTC going past 46k.
ADA chance for double bottom on 1D
Double Bottom would produce a target of 2.62.
This would smash the resistance level.
Pattern would also create a cup for further targets.
Important dates:
BTC ETF Deadlines Nov. 21, Dec. 8, Dec. 11 and Dec. 24.
The BTC FOMO buying finally subsided and now we get to see the retracement we were looking for. I do not see BTC going past 46K and I would like to see it stay above the 50MA on the 1D chart. ADA's retracement depends on BTC at the moment. Right now we have many options but the one I would like to see the most is the double bottom pattern on the 1D chart. Typically, you will see patterns be created on the lower time intervals and repeated on the higher time intervals. We have already seen a double bottom on the 1h, 4hr, and now I would like to see it on the 1D. This is the same for any pattern really. I want to see this pattern complete for a few reasons. First, it would signal a long term reversal (we already saw that coming however). Next, it would produce a target at a level higher than the resistance we need to get past at the moment. Third, it would create a cup which gives us potential for a cup and handle. I have already seen a cup form on the 4hr so I would not be surprised if we see one on the 1D as well. Anyways, I just noticed it and I wanted you all to be aware. This is what I am looking for. If I do not get it, I hope someone creates a meme out of this called "the pattern you want vs the one you get" LOL. I will continue to keep and eye on ADA and update you all accordingly. Thanks again!
I am going to make a video soon teaching everyone my approach to charting. I will cover the entire workflow process I go through. I hope you enjoy it.
Tell me what you think?
This is not financial advice. DYODD.
GBPCHF LONG IDEAI expect this pair to retest it's previous high after trading to an equilibrium after the previous bullish move.


AXS waiting for breakoutDouble bottom, but bounced back from descending trendline formed 3 days ago. We could expect a possible retest of lower or upper support levels. If we lose both of that levels, a nice big short could be in the play. For any bullish sign, we need a break of this descending trendline or at least bounce up from support levels... Good luck traders

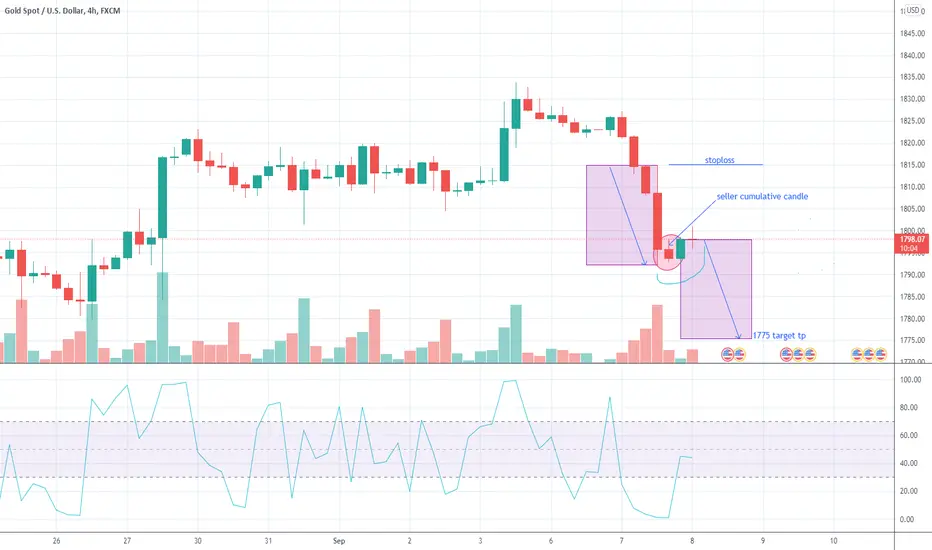
Gold (seller cumulative setup)- sell range 1798-1815.. tp @ 1793/1784/1777
.
- we will see new double bottom if h4 reject 1793 area and bounce up
.
-

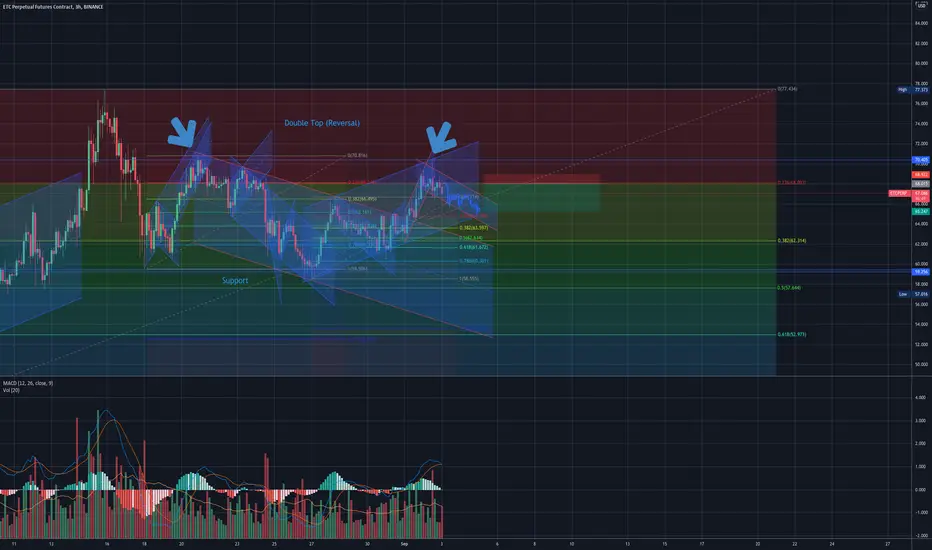
Double Top - Reversal to bearish?Just doing some messy charting. Potentially double top and reversal in this bull trend? at least for the short term.
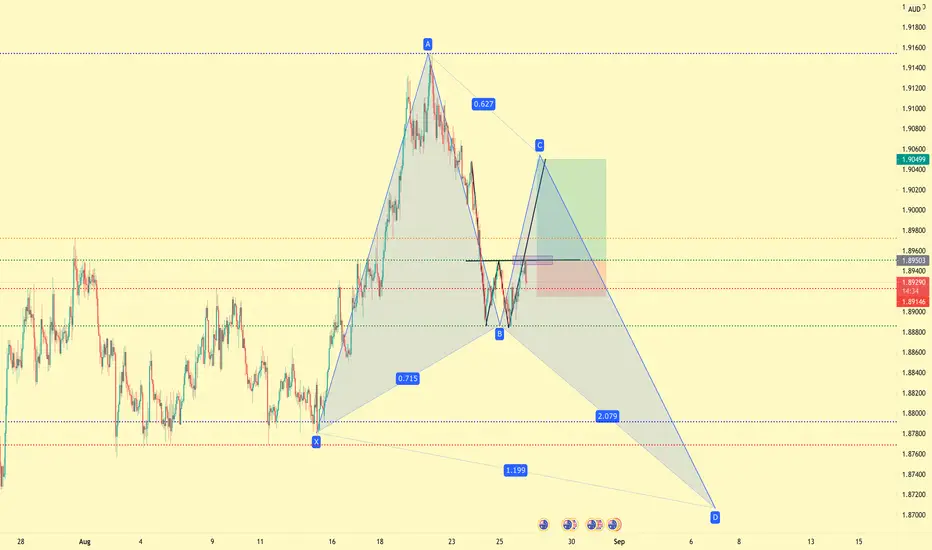
Mini Double Bottom Waiting for price to break 1.89500 before scalping this long towards the C point of the potential butterfly!
DOUBLE BOTTOM reversal 15 min??? $snapdouble bottom reversal on 15 min 30 min or daily displays on all retest of 80 risk break of orange zone??

IMFA 100% returns in one monthIMFA almost doubled in one month. Shared on 23rd June on Trading view and now see almost at 1000 levels. Partyy!!
