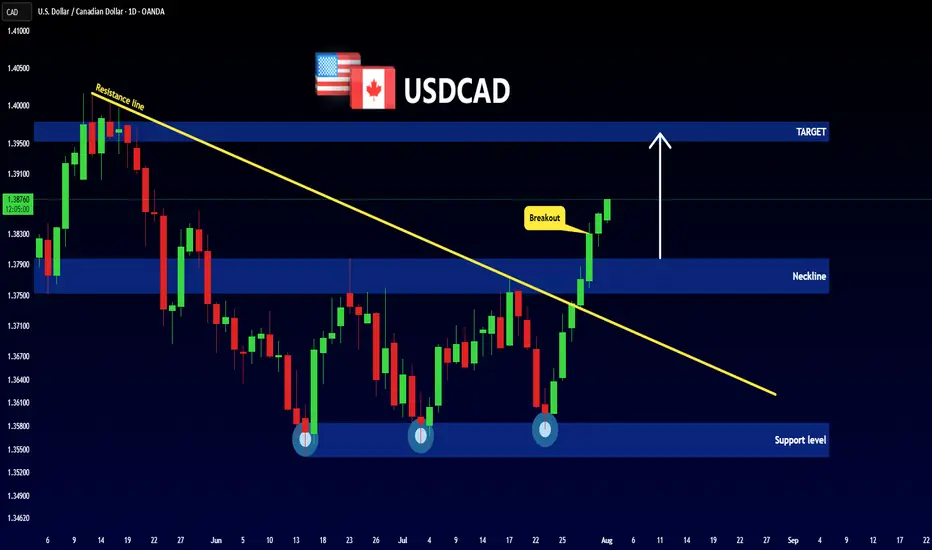
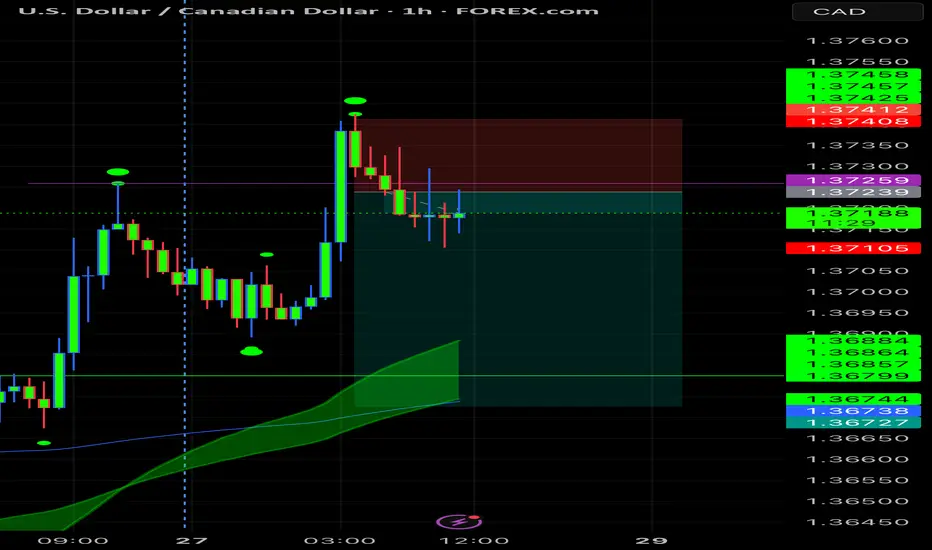
USDCAD - Bullish Triple BottomHello Traders !
The USDCAD price formed a triple bottom pattern.
Currently, The neckline is broken!
So, I expect a bullish move🚀
________________
TARGET: 1.39530🎯
Double Top or Bottom
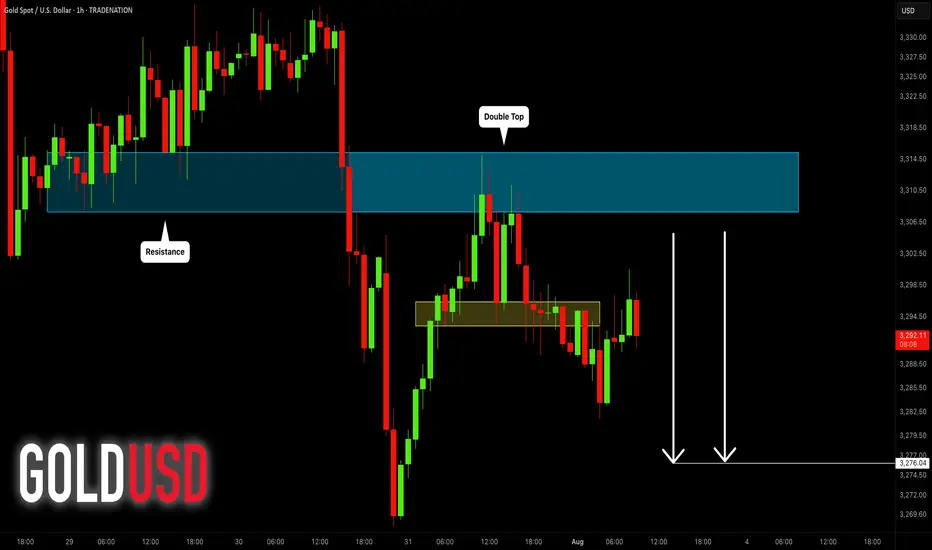
GOLD (XAUUSD): Bearish Continuation Ahead?!
Gold retested a recently broken significant liquidity cluster.
I see a clear sign of strength of the sellers after its test
with multiple intraday confirmation.
I think that the price will retrace to day to 3276 level.
❤️Please, support my work with like, thank you!❤️
I am part of Trade Nation's Influencer program and receive a monthly fee for using their TradingView charts in my analysis.
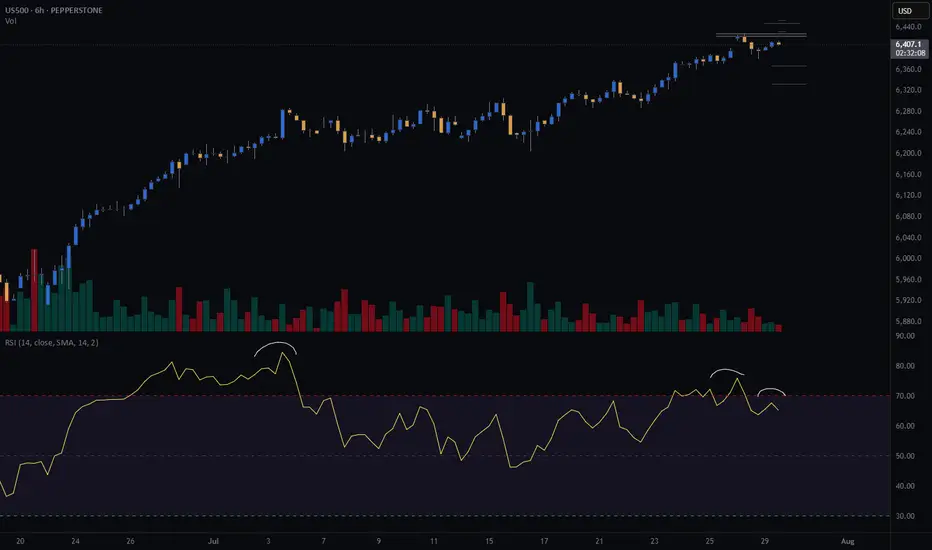
S&P500 (CASH500) SHORT - Double top H6Risk/reward = 3.7
Entry price = 6432.6
Stop loss price = 6 454.1
Take profit level 1 (50%) = 6367.7
Take profit level 2 (50%) = 6332.6
Still need confirmation from some variables before entering the trade
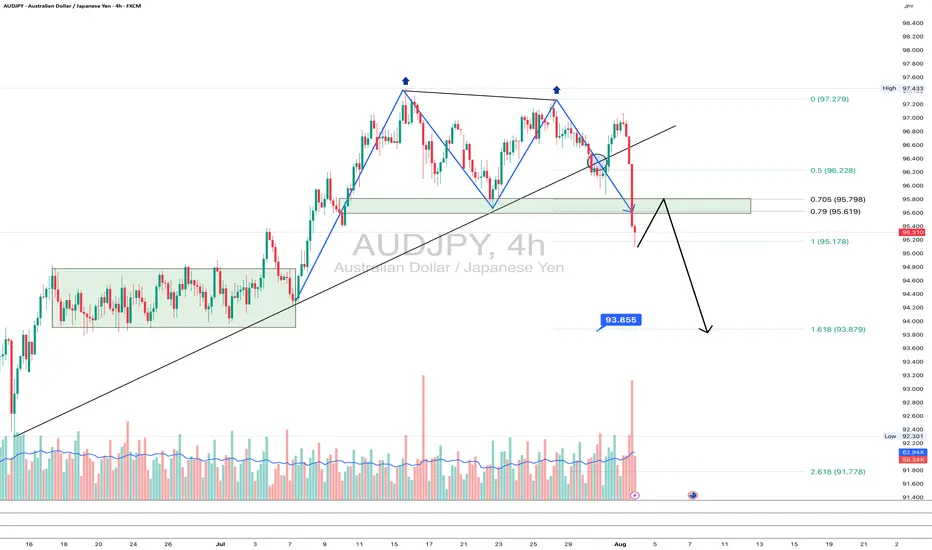
AUDJPY: goodbye uptrend?On the 4H chart, AUDJPY has printed a textbook double top pattern, breaking the rising trendline and diving below the 95.6–95.78 support zone - now acting as resistance. The pair is currently retesting this zone from below, which often provides a clean re-entry point for bears.
This area also aligns with the 0.705–0.79 Fibonacci retracement, reinforcing it as a key resistance. If the price rejects this zone, the next target is 93.85 (1.618 Fibo projection), followed by 93.25 and potentially 91.71 if momentum strengthens.
Fundamentally, the yen gains strength on risk-off flows and diverging rate expectations, while the Australian dollar is pressured by falling commodity prices and a likely pause from the RBA. This widens the rate differential and weakens AUD.
As long as price remains below 95.78, sellers are in control. Watch for a rejection from this retest zone.
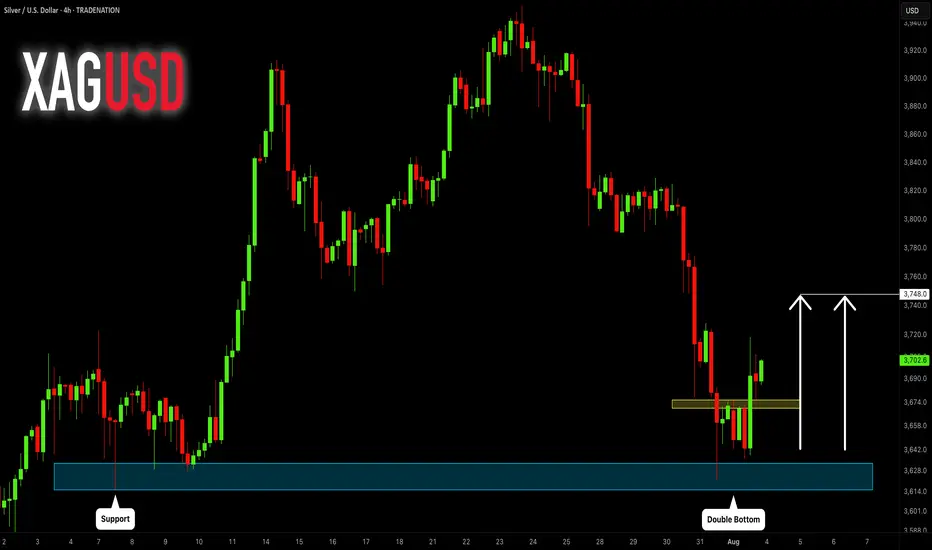
SILVER (XAGUSD): More Growth Ahead
It looks like Silver is going to continue growing next week,
following a strong bullish reaction to a key daily horizontal support.
The next strong resistance is 3748.
It will be the next goal for the buyers.
❤️Please, support my work with like, thank you!❤️
I am part of Trade Nation's Influencer program and receive a monthly fee for using their TradingView charts in my analysis.
Dieteren Group Quote | Chart & Forecast SummaryKey Indicators On Trade Set Up In General
1. Push Set Up
2. Range Set Up
3. Break & Retest Set Up
Notes On Session
# Dieteren Group Quote
- Double Formation
* (Reversal Argument)) + (Diagonal Shift)) | Completed Survey
* (Downtrend Argument)) - *Double Top Structure | Subdivision 1
- 49 bars, 67d | Date Range Method
- Triple Formation
* (P1)) / (P2)) & (P3)) | Subdivision 2
* Daily Time Frame | Trend Settings Condition | Subdivision 3
- (Hypothesis On Entry Bias)) | Indexed To 100
- Position On A 1.5RR
* Stop Loss At 118.00 EUR
* Entry At 107.00 EUR
* Take Profit At 91.00 EUR
* (Downtrend Argument)) & Pattern Confirmation
- Continuation Pattern | Not Valid
- Reversal Pattern | Valid
* Double Top | Short Set Up
* Ongoing Entry & (Neutral Area))
Active Sessions On Relevant Range & Elemented Probabilities;
European-Session(Upwards) - East Coast-Session(Downwards) - Asian-Session(Ranging)
Conclusion | Trade Plan Execution & Risk Management On Demand;
Overall Consensus | Sell

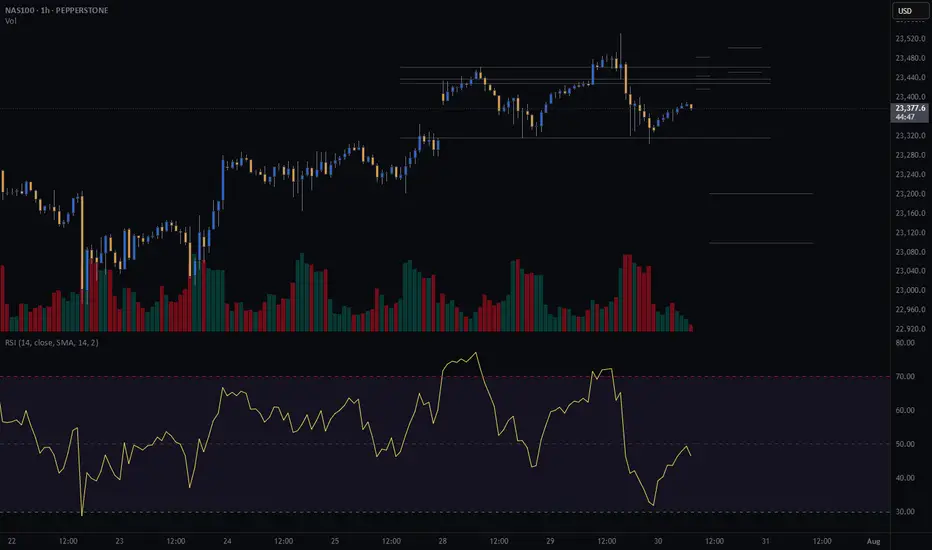
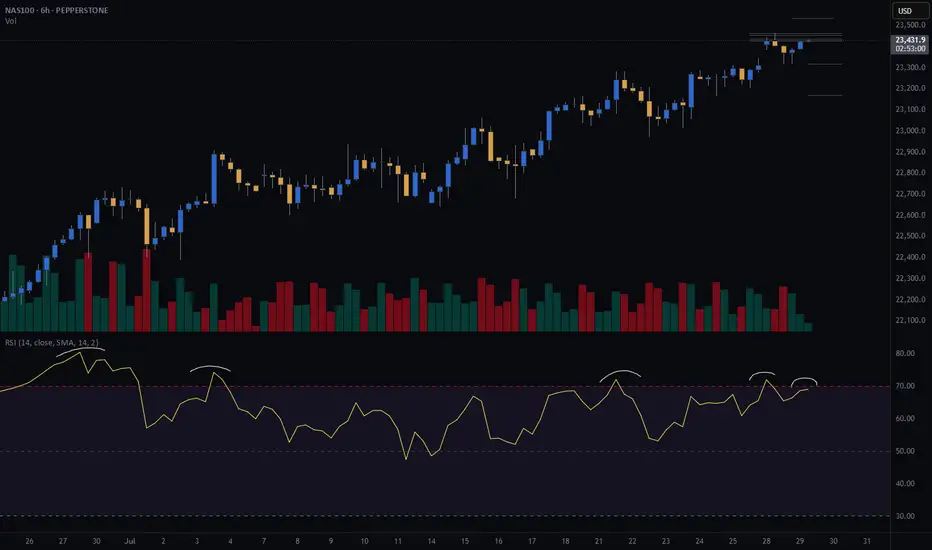
CASH100 (NASDAQ) CRASH - Head and shoulders Risk/reward = 3.7
Entry price = 23 430
Stop loss price = 23 503.2
Take profit level 1 (50%) = 23 202
Take profit level 2 (50%) = 23 099
Still waiting for some variables to confirm before entering the trade
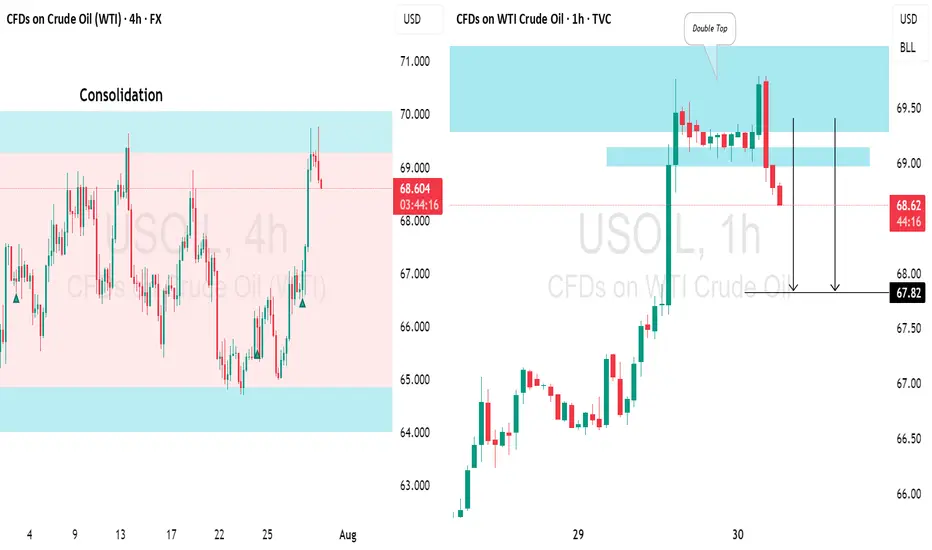
US CRUDE OIL(WTI): Consolidation ContinuesUSOIL is currently consolidating within a horizontal channel and has shown a bearish response at resistance,
The price formed a small double top pattern before declining.
There's a strong likelihood that the price will soon reach the 67.83 level.
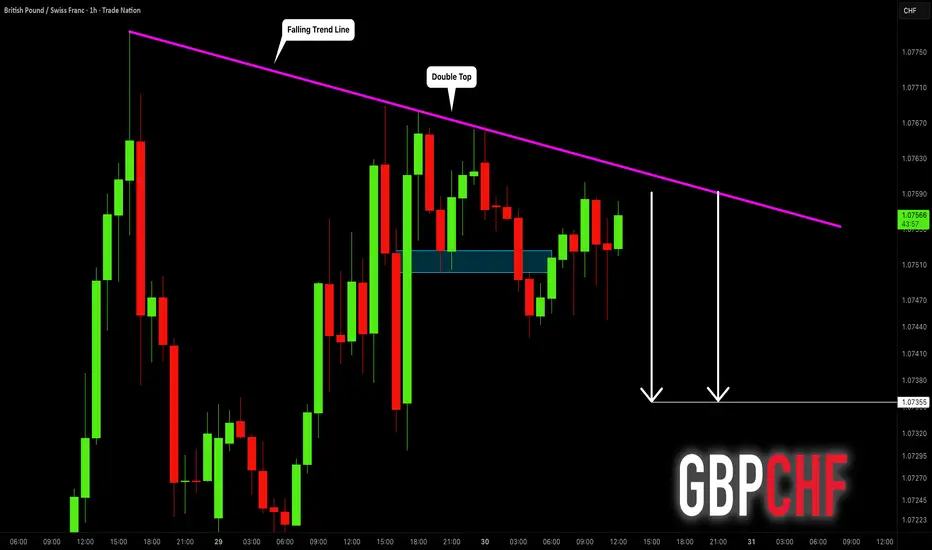
GBPCHF: Another Bearish Signal?! 🇬🇧🇨🇭
Quick update for GBPCHF.
We discussed a strong bearish confirmation yesterday.
Today, we have one more.
The price formed a double top after a test of a strong intraday
falling trend line.
Its neckline was broken this morning.
I expect a retracement to 1.0735
❤️Please, support my work with like, thank you!❤️
I am part of Trade Nation's Influencer program and receive a monthly fee for using their TradingView charts in my analysis.
EURUSD has formed a double top patternOn the daily chart, EURUSD has formed a double top pattern. Currently, attention should be paid to the resistance around 1.1600. If the rebound does not break through, it is expected to continue to fall. The support below is around 1.1450. If it falls below, the support below is around 1.1370.

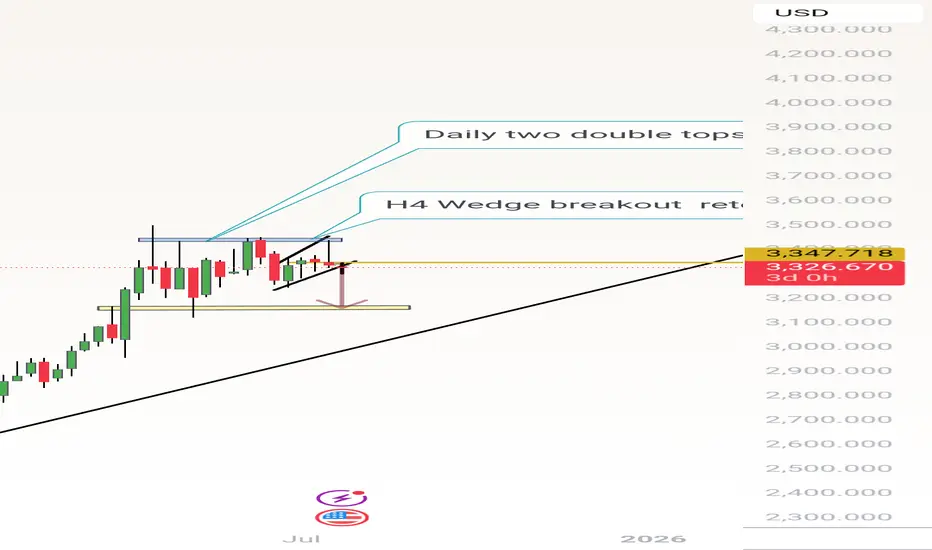
Gold shortXau usd has been bullish all along for months if not years , however for every bullish run there's always a period of retracement when price fall a little sometimes 20 % to 50% of a bullish run .
Gold is creating a pullback , if you position well you can take advantage of this move before the bulls resumes again
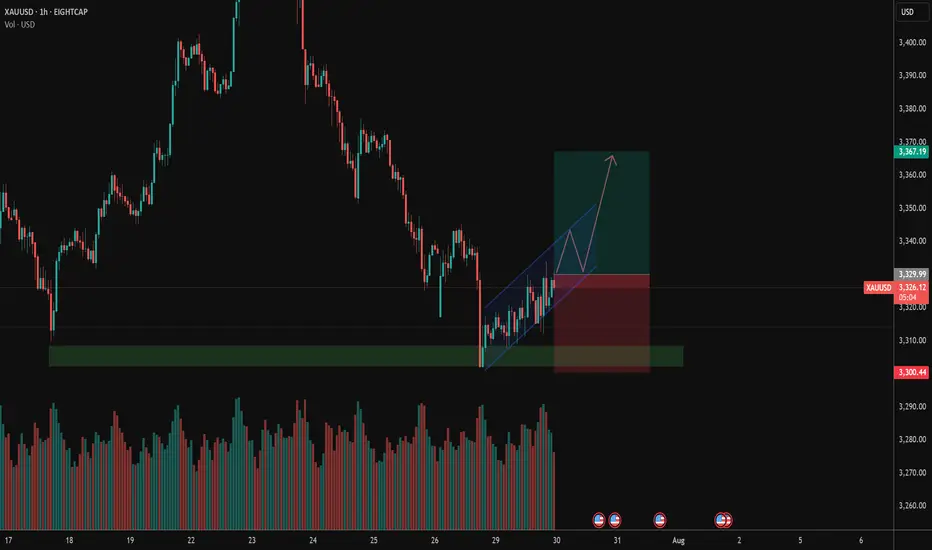
XAUUSD go for long!Hi all
After hitting the support zone its quite obvious that XAUUSD will increase! and we can go for long!!
Currently its double bottom, but it may go for third!
Note: am new trader and not an expert!! Please stick with your thoughts and analysis if its against mine!
Am sharing my thoughts and all depend on my analysis!
Please let me know if you agree or disagree with me!
USDCHF Signals Wave 3 With Double Bottom!OANDA:USDCHF has not only formed a Double Bottom Pattern but also may be generating a potential Elliot Impulse Wave!
Bulls are giving the April & June Lows of .8038 - .8088, another go for a second time today after surpassing the first attempted High created July 17th to break above the level.
So far Price today has broken above July 17th Highs and if Bulls are able to hold this level, this would Confirm:
1) A Breakout of the Double Bottom
2) Wave 3 continuing the Impulse Wave in the Elliot Wave Theory!
The Higher Low @ .79106 created on July 25th, broke the downtrend structure as a 78.6% retracement of the Lower Low @ .78719 created July 1st which was a new 14 Year Low, finishing Wave 2 and initiating Wave 3 of the Impulse Wave.
The Extension of Wave 3 typically will end at the 1.236% or 1.618% level which gives us 2 potential Price Targets to start:
Price Target 1) .81479 - 1.236%
Price Target 2) .82213 - 1.618%
Once Wave 3 has ended, we will look for opportunities at the Wave 4 - Wave 5 juncture!

NASDAQ (CASH100) SHORT - Double top H6Risk/reward = 4
Entry price = 23 463.1
Stop loss price = 23 534.2
Take profit level 1 (50%) = 23 169
Take profit level 2 (50%) = 23 169
All variables met. Now just need price to reach entry level and close back within range.
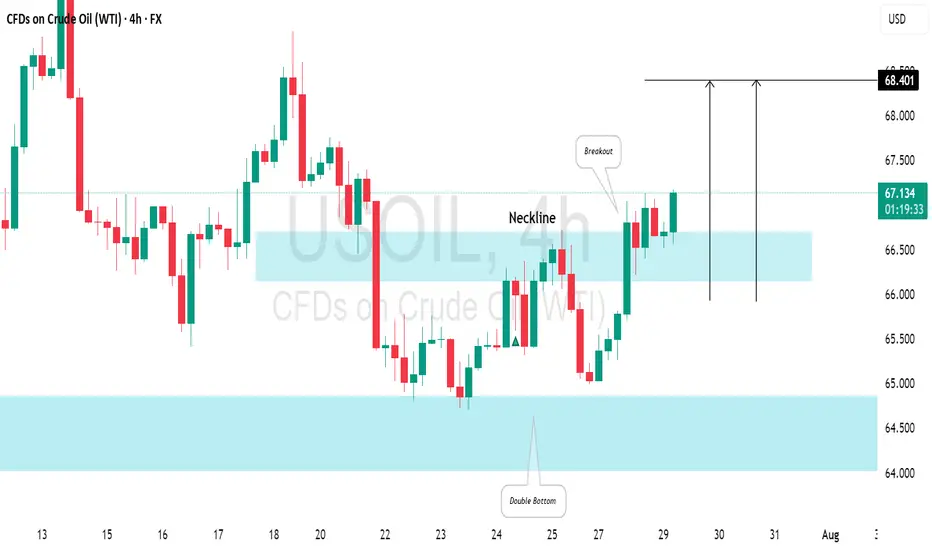
US CRUDE OIL(WTI): Very Bullish Pattern📈USOIL has reached a significant horizontal demand zone on the daily chart, leading to price consolidation and the formation of a double bottom pattern with a higher low.
Yesterday, the market rebounded, creating a new local higher high that broke above the pattern's neckline.
This suggests a typical bullish reversal, and the oil price is expected to rise towards 64.40.
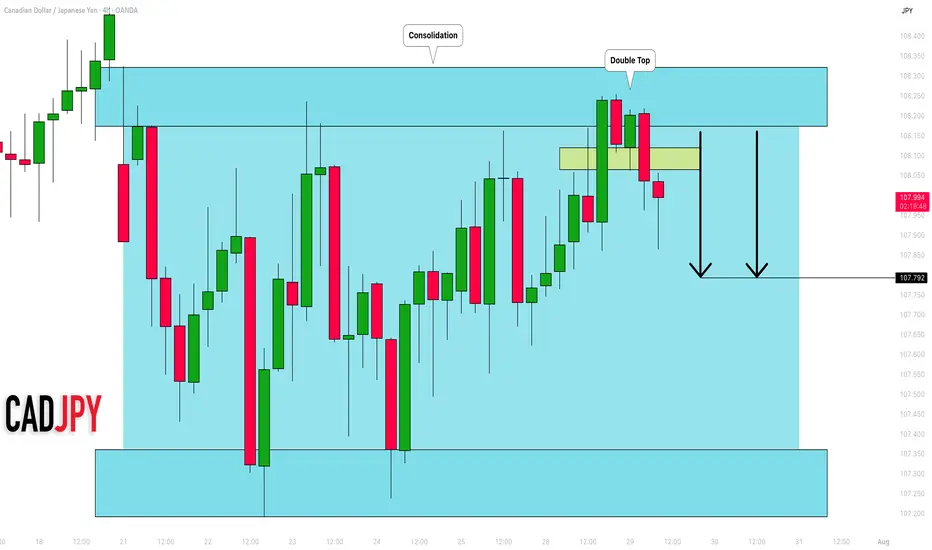
CADJPY: Consolidation Trading 🇨🇦🇯🇵
I expect a retracement from a resistance of a consolidation
range on CADJPY.
My confirmation is a double top pattern formation on that
on a 4H time frame.
Goal - 107.79
❤️Please, support my work with like, thank you!❤️
USDCHF SELL 0.8175On the 4-hour chart, USDCHF has stabilized and rebounded from its lows, forming a potential double bottom pattern in the short term. In the short term, USDCHF may continue to rise, with an upside target of around 0.8175, which is a potential short position for a bearish bat pattern and is within the previous supply zone.

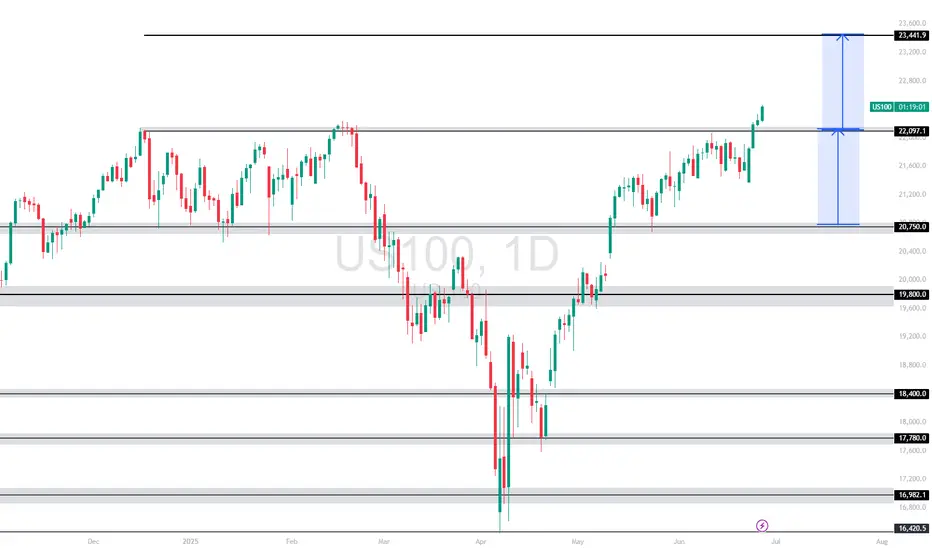
US100 (NASDAQ 100 Index) – Breakout with Clear Upside ProjectionUS100 has broken out cleanly above the key resistance at 22,097.1, indicating bullish continuation. The breakout is supported by strong upward momentum, targeting the next key level around 23,441.9, as illustrated by the projected range.
Support at: 22,097.1 🔽 | 20,750.0 🔽
Resistance at: 23,441.9 🔼
🔎 Bias:
🔼 Bullish: Sustained price action above 22,097.1 keeps the bullish breakout valid, aiming toward 23,441.9.
🔽 Bearish: A drop back below 22,097.1 would invalidate the breakout, possibly pulling price toward 20,750.0.
📛 Disclaimer: This is not financial advice. Trade at your own risk.
NZDCHF - Can we make it back to previous highs?NZDCHF has been shaping up for the next price movement as bulls strongly rejected any further downside and created a strong reversal impulse which should gain some momentum.
Good Luck

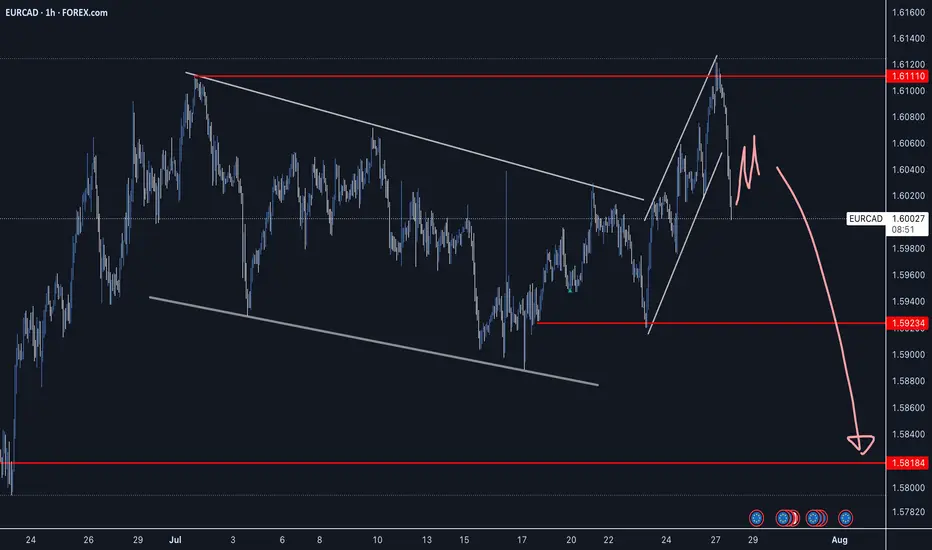
EURCAD - Strong Reversal Impulse off Double TopEURCAD has created bearish price action with a strong reversal impulse pushing down from the double top level. Waiting for a continuation to confirm a sell opportunity with a good R:R.
Good Luck
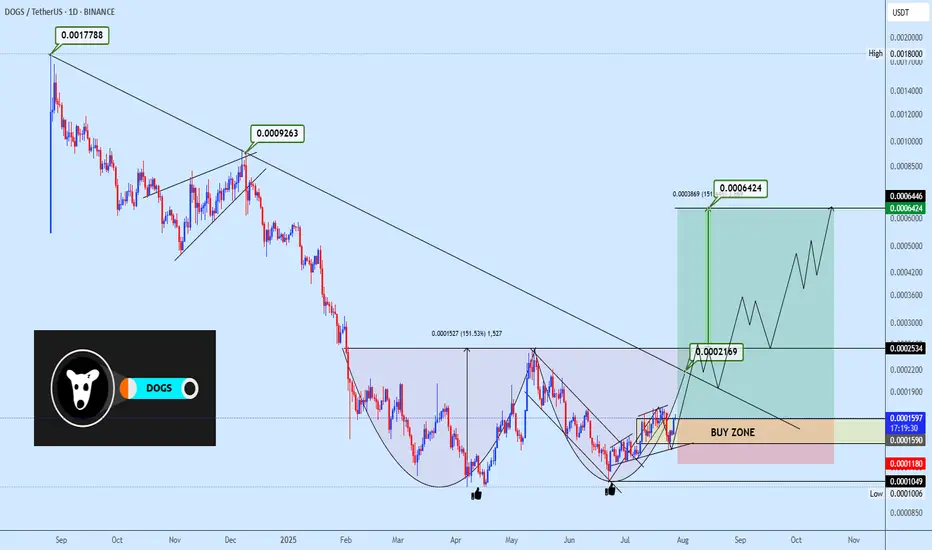
Dogsusdt double bottom formationDOGSUSDT is exhibiting a micro double bottom formation, with price rebounding from a previous support zone. The strategy is to accumulate within the highlighted area and monitor the neckline reaction around 0.0002534. A breakout above this level would validate the entire double bottom structure and set the stage for a move toward the projected targets. Enjoy.