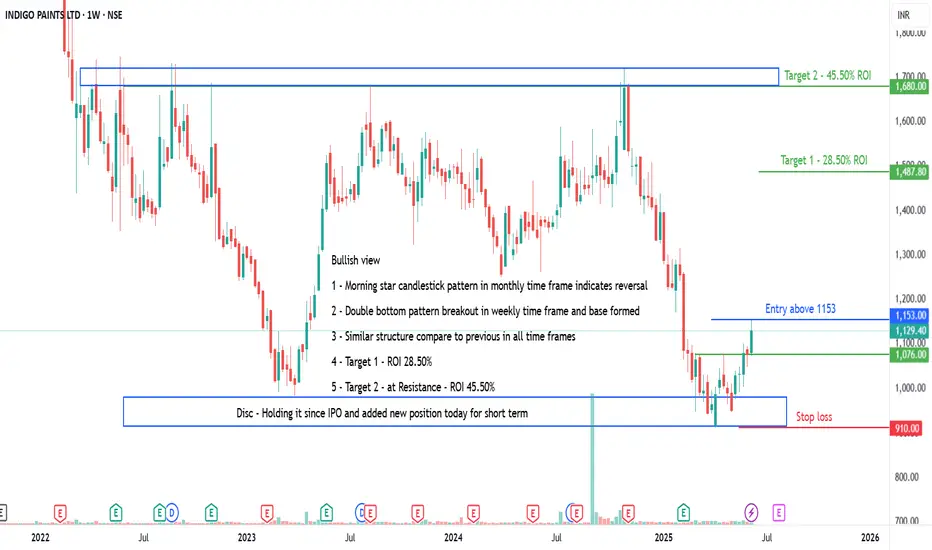
INDIGOPNTS - Bullish view potential of 28 to 45% ROIAll details are given on chart for educational purpose only. If you like the analyses please do share it with your friends, like and follow me for more such interesting charts.
Disc - Am not a SEBI registered analyst. Please do your own analyses before taking position. Details provided on chart is only for educational purposes and not a trading recommendation
Double Top or Bottom
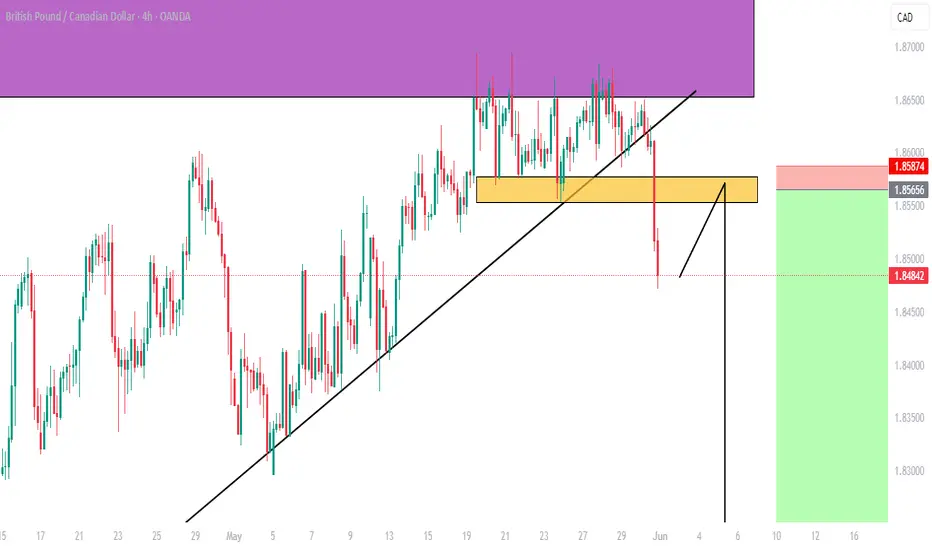
GBPCAD Counter-Trend SELL(Weekly) - Price hit previous extreme high at (1.85932 - 1.87820) and was rejected forming double top neckline at (1.81470 - 1.80561) .
(Weekly) - Previous Week Candle Close is Shooting Star showing sellers taking action at Key Resistance level.
(Daily) - Price formed double top inside our resistance level at (1.85932 - 1.87820).
(Daily) - Price broke double neckline at (1.85533 - 1.85774).
(H4) - Price was in distribution at (1.86602 - 1.85774).
(H4) - Rising Trendline that price broke connecting (1.80561 - 1.86011).
Trade Entry.
(H4) - Wait for price to retest our daily double top neckline & low of the distribution at (1.85533 - 1.85774) to join the reversal.
(H4) - Take profit at Weekly Double Top Neckline at (1.81470 - 1.80561).
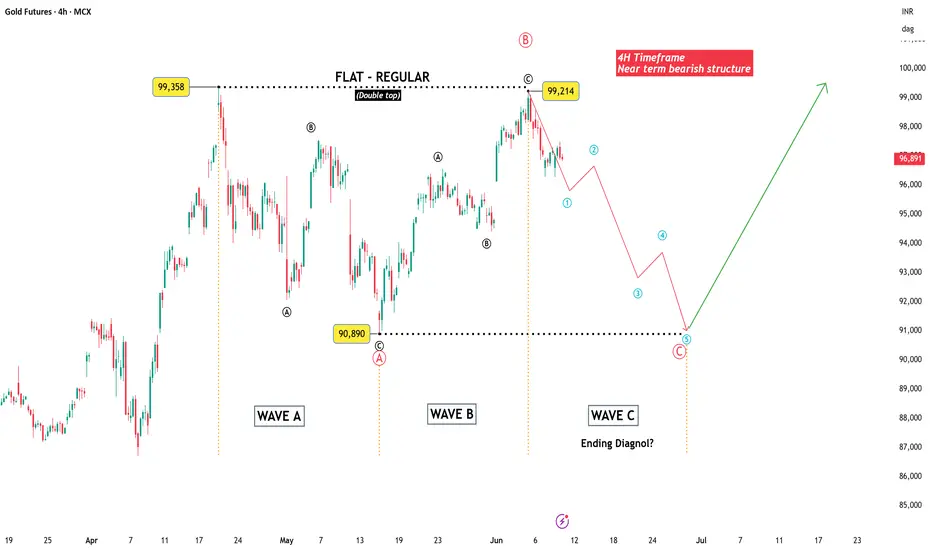
Gold Futures – Double Top Leads to Bearish SetupGold Futures on the MCX chart is showing a classic Elliott Wave pattern in play. After forming a regular flat correction with a double top near the 99,300–99,200 zone, prices have started to drift lower. The double top structure—combined with the completion of Wave B—suggests that a Wave C decline is underway.
Wave A took the price down to around 90,890, followed by a corrective Wave B that failed to break the previous high convincingly.
The near-term outlook on the 4-hour timeframe remains bearish. I am anticipating five waves down within Wave C, which may take price back toward the previous Wave A low or slightly lower, possibly ending in a diagonal pattern, before a bullish reversal can be expected.
Disclaimer: This analysis is for educational purposes only and does not constitute investment advice. Please do your own research (DYOR) before making any trading decisions.
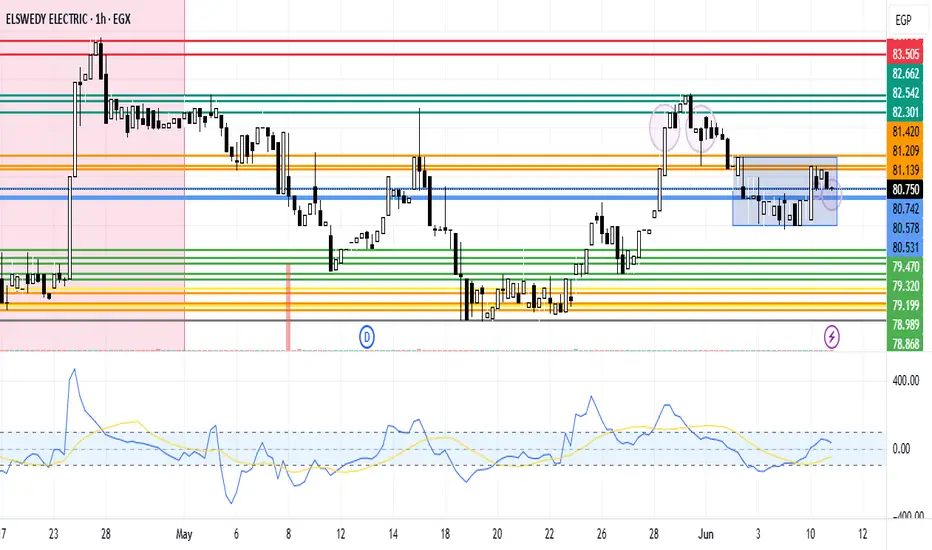
SWDY Neutral Zone AnalysisSWDY stock is in a neutral zone. There is a semi double bottom at the support line 80.742 that might encourage a bullish reversal pattern. In case of increasing it's expected to breach the resistance line 81.139 to reach the 81.209 then the 3rd at 81.420. In case of being a fake sign it'll break the support line at 80.742 to reach the 2nd at 80.578 then the 3rd at 80.531 points.
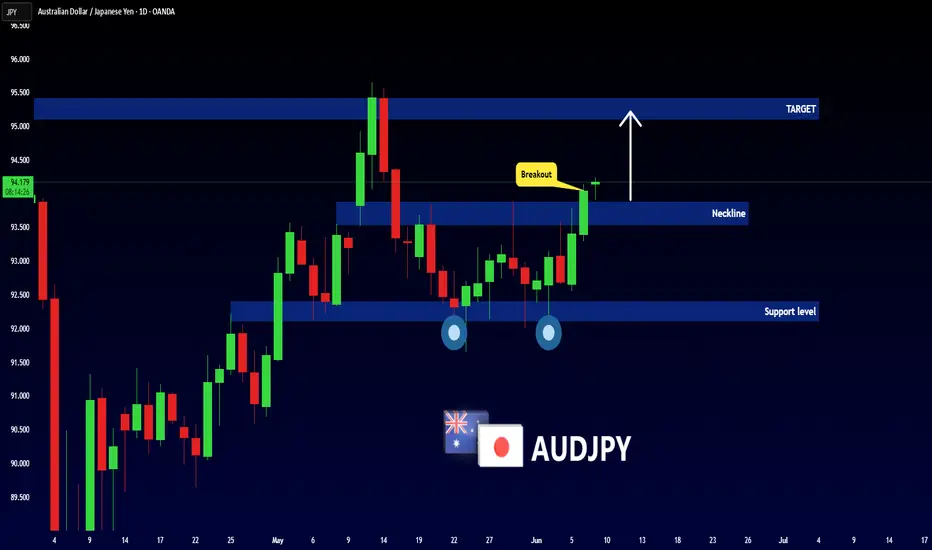
AUDJPY - Bullish Double BottomHello Traders !
The AUDJPY price formed a double bottom pattern.
Currently, The neckline is broken!
So, I expect a bullish move🚀
______________
TARGET: 95.110🎯
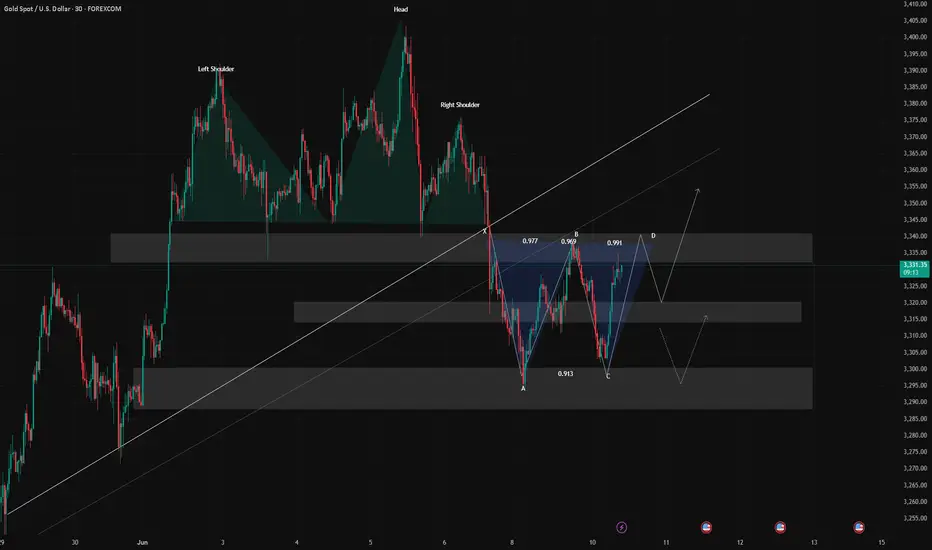
6/10 Gold Analysis and Trading SignalsGood afternoon, traders!
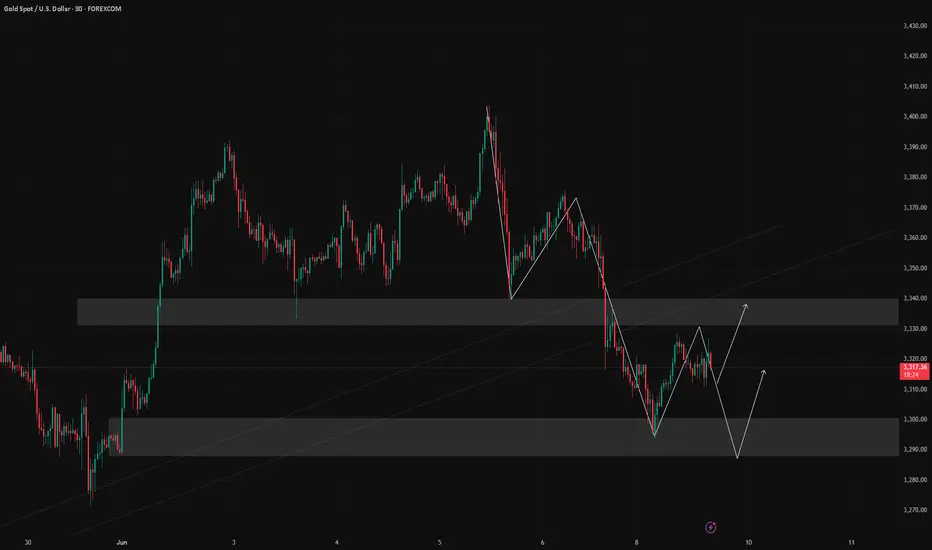
Gold continues to move within the predefined trading range from yesterday. Both the short from 3338 and the long from 3306 turned out profitable. Currently, price action is developing into a potential double bottom, with price once again testing key resistance around 3338.
🔍 Key Technical Outlook:
If gold breaks above 3338 decisively, and can hold above 3317 on any pullback, the next bullish target area lies between 3345 / 3352–3368.
However, if price fails to break out, then focus shifts back to the 3303–3286 support zone, which may serve as a potential buy region again.
📉 4H Trend Structure:
On the 4-hour chart, price has already broken below the previous uptrend line.
For the bulls to reclaim control, gold must re-establish above 3350 and sustain momentum. Failure to do so confirms bearish dominance, with the next major support near 3257.
Any weak rebound below key resistance can be treated as a short-selling opportunity.
📊 Macro Focus:
No major economic releases today, but traders should prepare for tomorrow's CPI data, which could be a key driver for gold volatility and inflation sentiment.
📌 Today’s Trading Plan:
✅ Buy zone: 3296–3286
✅ Sell zone: 3348–3358
🔄 Pivot levels for flexible intraday trades:
3343 / 3334 / 3326 / 3318 / 3309 / 3300
Stay cautious, manage position sizes wisely, and be alert for momentum shifts as CPI draws closer.
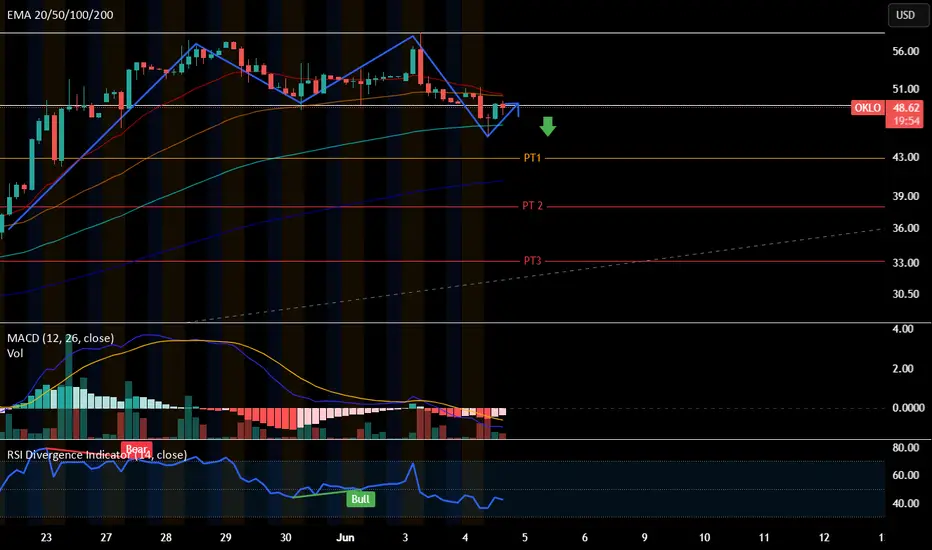
OKLO - ShortChart pattern : double top testing the neckline at $~49.5
Enter Put when it rejects the neck line at $48
Stoploss at ~$50.2
PT1 :~$42.85
PT2: ~$38.25
PT3: ~33.11 - possible PT because it might finish at PT2. considering taking profit at PT2.
Period to reach PT is 1-2 weeks.
Gold: Market Analysis and Trading StrategiesSo far, although the price has risen, it has not yet broken through the upper resistance, and the lower support remains intact. Overall, the market is still in a narrow range of consolidation. From a technical perspective, the 2-hour chart shows a bullish bias, indicating a potential for continued upward movement in the short term.
However, if during this consolidation phase the price breaks below the key support at 3309, it is likely to further test the support zone around 3296–3288.
At this stage, traders can consider entering light long positions and gradually add to them on dips to reduce the average entry price. For more conservative traders, it's advisable to wait until a clear breakout occurs before taking action.
Watch the 3338–3352 area for potential short opportunities as it's a key resistance zone, and the 3303–3288 range for long entries as it offers strong support. Trading near these levels generally carries lower risk and a higher probability of profit.
BTCUSD is replaying the 2021 double top a bit too perfectlyTracing the weekly highs of Bitcoin's 2021 double top and translating them onto the current highs reveals some startlingly similar patterns.
Removing just a couple of week's bars between the two tops in 2021 gives a very close match to the current pattern we see unfolding.
Are we just watching an action replay?
If so, we would be looking at ~$140k highs by early August followed by a huge retracement to the long term trendline in the c. ~$90k region. Such a retracement is not unprecedented, and from these lows I would expect the price to rise at or above the trend once again, keeping Bitcoin on track to hit $1m by 2029, so this is by no means a bearish prediction.

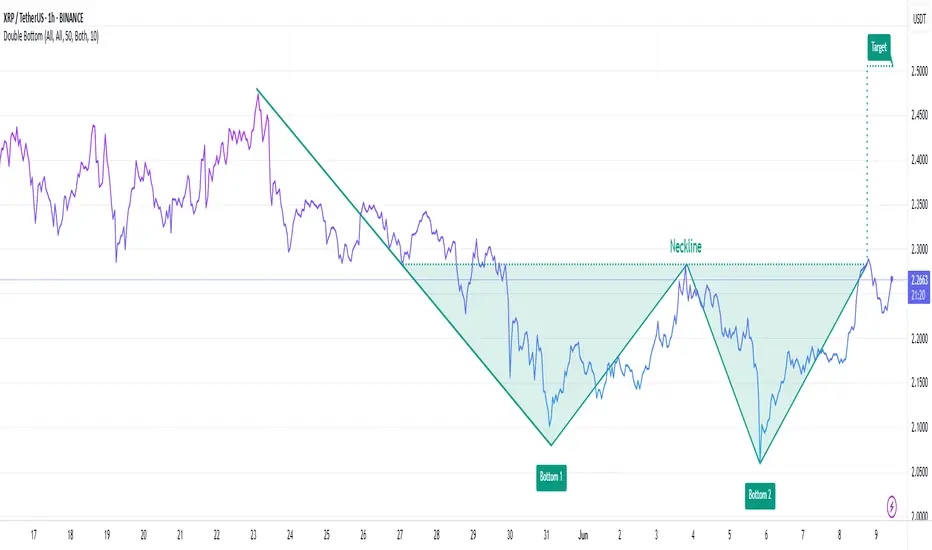
XRPUSDT Double-Bottom Breakout: $2.50 Target in Sight?The classic double‑bottom breakout appears to be unfolding between ~$2.06–2.10, confirmed when price broke above the neckline at ~$2.28.
Traditional analysis suggests measuring the distance from the bottoms to the neckline, and projecting this upward, setting a breakout target near $2.50
Key Levels to Monitor
Support zone: $2.06–2.10 — must hold above this area to keep the bullish structure intact
Near-term resistance: $2.28 – recent neckline sit here
Next resistance levels: $2.50, $2.65–2.70, and even $3.00 if momentum supports it
Volume & Confirmation
Confirmation of this breakout should come with increased volume. The current volume has been relatively subdued, indicating possible weakening momentum.
A clean breakout above $2.28 accompanied by a volume spike and bullish candlestick (e.g., engulfing pattern) would solidify the breakout.
Invalidation
A drop below $2.06–2.10 would break the double‑bottom structure, opening the door to deeper support tests around $2.00 or even $1.70
Not financial advice.
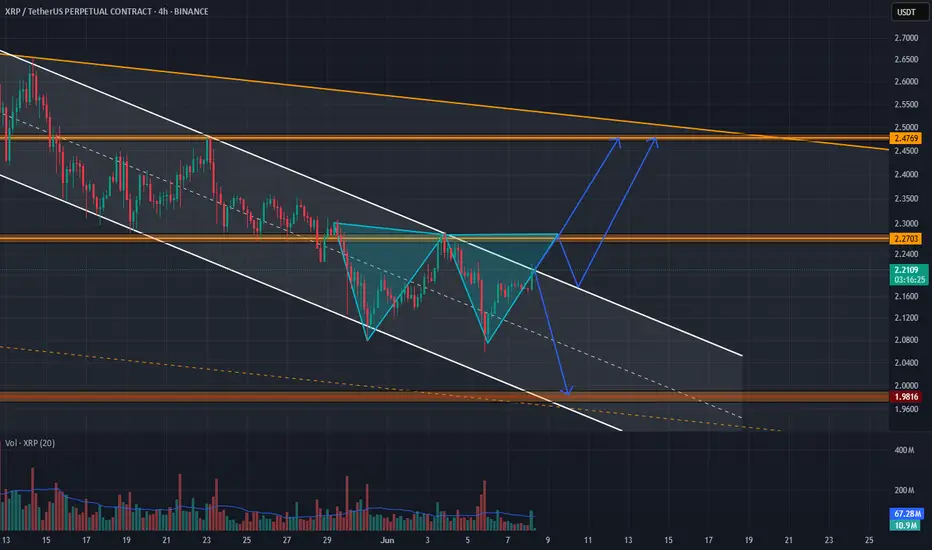
Xrp can make a double bottom patternBINANCE:XRPUSDT.P
Xrp is in a bearish channel, if it breaks and complete the double bottom pattern we go to 2.45-2.50$ area which is a double resistance.
When the double bottom completed we can see a retest to do channel, or directly go up.
İf xrp want to go down, we see a movement to channel bottom to 2$ area, which is a double support.
6/9 Gold Analysis and Trading SignalsLast Friday, gold experienced a sharp drop, briefly testing the 3300 level. From a technical standpoint, the market has started to show early signs of bottom formation, which could materialize either as a double bottom / multiple bottom pattern, or through a direct upside breakout.
If the former unfolds, we expect a stronger and more sustainable rebound.
If it turns into a straight bullish leg, traders should be cautious of potential exhaustion in the rally, which may invite a renewed bearish attack.
📊 Key Macro Focus This Week:
Markets will be primarily influenced by data releases on Wednesday through Friday, including:
Monthly CPI
Initial Jobless Claims
Inflation Expectations
As a result, Monday's trading will be dominated by technical patterns, with a bias toward a corrective rebound. The strategic focus should be on buying near support, with short-term opportunities to sell near key resistance.
📌 Monday Trading Plan:
✅ Buy in the 3303–3286 zone (early base-building area)
✅ Sell in the 3343–3353 zone (overhead resistance)
🔄 Intraday pivot levels for tactical entries:
3338 / 3326 / 3317 / 3309
EURCHF: Pullback From Resistance Confirmed 🇪🇺🇨🇭
EURCHF may pull back from the underlined resistance today.
As a confirmation, I spotted a double top pattern after a test
of a key intraday resistance and a violation of its neckline with
a high momentum bearish candle on Friday.
Goal - 0.93585
❤️Please, support my work with like, thank you!❤️
I am part of Trade Nation's Influencer program and receive a monthly fee for using their TradingView charts in my analysis.

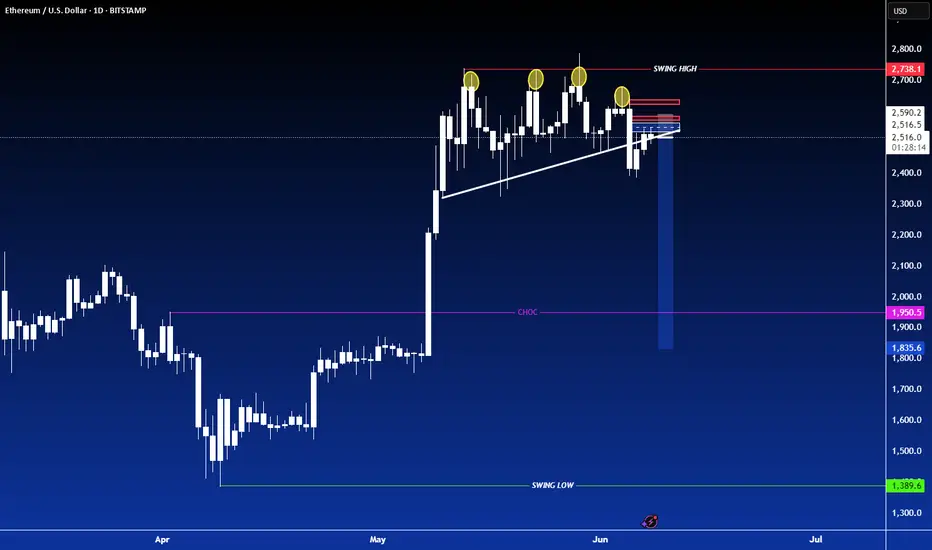
SHORT ON ETHEREUM ETH/USDEthereum has created a lower high after a triple top and is currently looking very bearish.
Huge imbalance to the downside to be filled.
I will be selling eth to the next demand level looking to catch over 500-600 points.
AUDUSD Start of Week DropThe DXY index has double bottomed and left a significant FVG at around $1. This has yet to retrace and market sentiment towards seeing the USD under $1 is tough. This FVG is likely to close this week as a last ditch effort to hold the USD at $1 level.
We have business confidence news twice in the early week that is likely to be not great pressuring the AUD, then later on we have USD news that will likely hold or temporarily bolster USD confidence. This is the dynamics shift that I believe will bring on that larger retracement of the USD to $1.
Be ready for a significant rejection once we arrive at the FVG though.

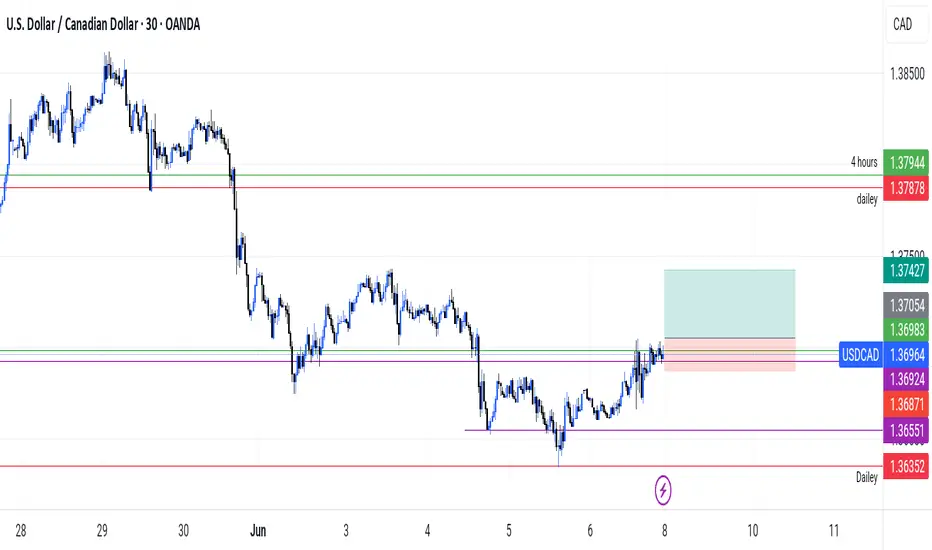
usd/cadas my last post if price level breaks 1.37 and retraces it self back to use the ristence as surport i would be looking to go long same risk to reward would be 1:2 this would be a long as the higher time frames shows the market is bullish
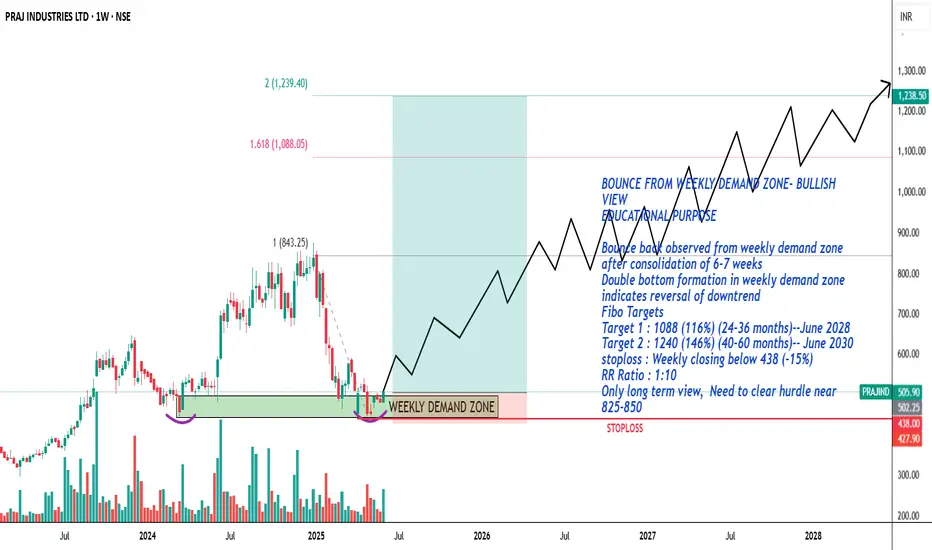
Double Bottom Formation--PRAJ- Bullish view- Educational PurposeBOUNCE FROM WEEKLY DEMAND ZONE- BULLISH VIEW
EDUCATIONAL PURPOSE
Bounce back observed from weekly demand zone after consolidation of 6-7 weeks
Double bottom formation in weekly demand zone indicates reversal of downtrend
Fibo Targets
Target 1 : 1088 (116%) (24-36 months)--June 2028
Target 2 : 1240 (146%) (40-60 months)-- June 2030
stoploss : Weekly closing below 438 (-15%)
RR ratio 1:10
Only long term view, Need to clear hurdle near 825-850
A Follow up to: “Adjustments for Better Readings & VSA vs BTC"When a trend approaches its end, we typically observe the formation of a buying or selling climax. That was certainly the case during Wyckoff’s era. Everything he described—market manipulation, signals, footprints—remains relevant today. But you know what that also means: if it's out there, it’s old news.
Yes, this is still happening, but we need to acknowledge that this information is no longer exclusive. And when a method becomes well-known—especially among retail traders—it can be used against them. Wyckoff himself hinted at this: the manipulators can and do use these same technical patterns to deceive. His real message?
“Keep an open mind.”
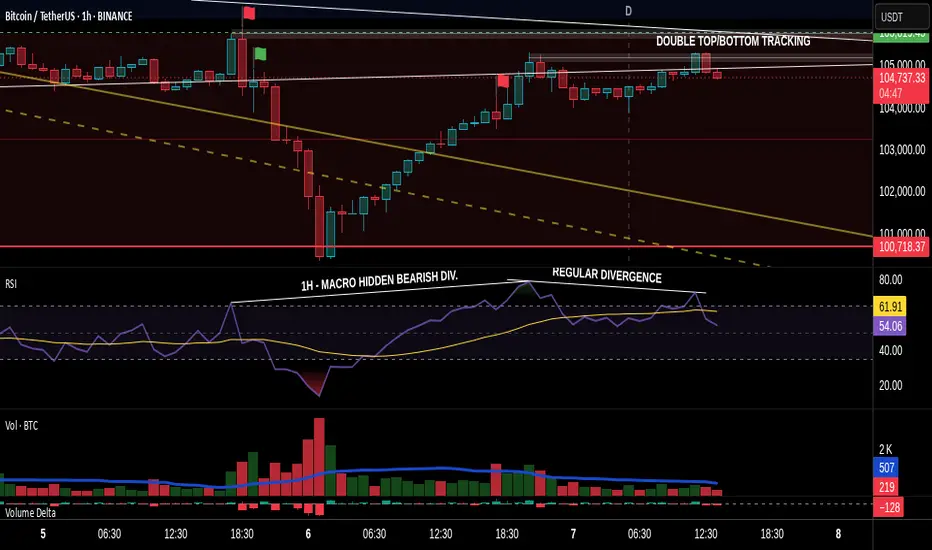
📉 In our current BTC chart, we’re seeing a textbook example of potential manipulation. A selling climax is visible—normally a sign of trend exhaustion and a bullish reversal. But is that really the case here? Did the downtrend truly end?
On the 1-Hour timeframe, both the RSI and volume indicators suggest otherwise: a bearish continuation seems more likely.
🧱 We're also witnessing a real-time formation of a Double Top pattern, taking shape since June 6. Measured by body candle spreads (excluding wicks), we observe four touches within a key price rectangle. These align with a known candlestick pattern: the Tweezer Top, commonly associated with bearish reversals.
What’s more, all of this is happening within a supply zone—actually three marked zones on the chart. The most recent zone shows signs of offloading pressure, amplified by both the Double Top and bearish candlestick formations.
And I haven’t even touched on the rejection wicks or how bearish volume spikes are gaining strength. That’s where the principle of Effort vs. Result comes in—remember, nothing in the market is free.
📊 In line with our past two posts, note how price action (PA) shows equal highs while RSI diverges, reinforcing earlier signals. The signs are stacking up.
So, the critical question now is:
Are we heading below the $100.718 level for a confirmed Head & Shoulders pattern?
Or is this just a retest before another move?
If this way of reading the market resonates with you and you want to go deeper—whether it’s building confidence or spotting signals before they play out—I work with a small circle of traders sharing TA privately on a daily basis. Feel free to reach out.
Till next time be well and trade wisely!
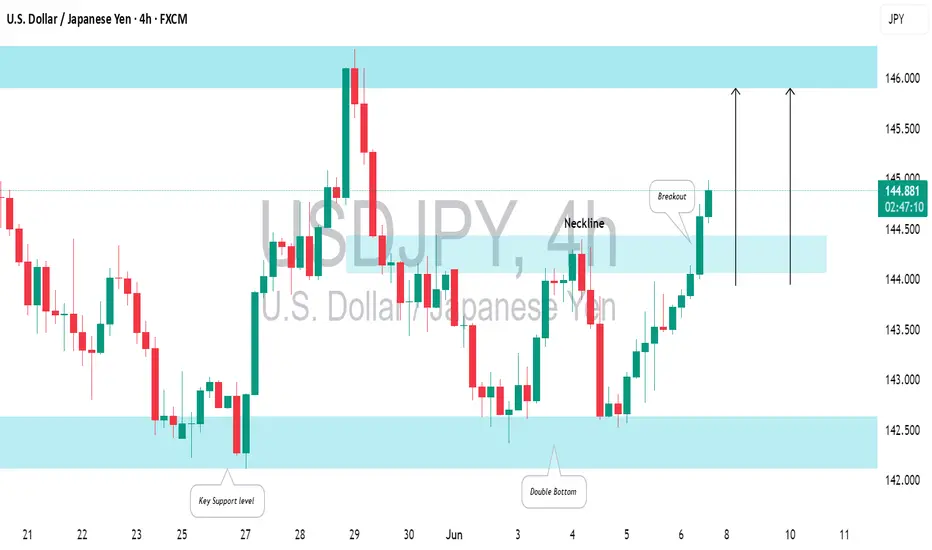
USDJPY: Pullback From Support📈USDJPY responded well to the highlighted intraday support zone on a 4H timeframe.
The price formed a double bottom pattern on that and violated its horizontal neckline.
There's a strong likelihood that the price will continue to rise and hit the 146.00 resistance level.
6/5 Gold Analysis and Trading SignalsGood morning, everyone!
Gold surged above 3380 yesterday but faced strong resistance, pulling back before testing the critical 3400 level. Despite multiple attempts, price failed to break through, highlighting a clear lack of bullish momentum near historical highs.
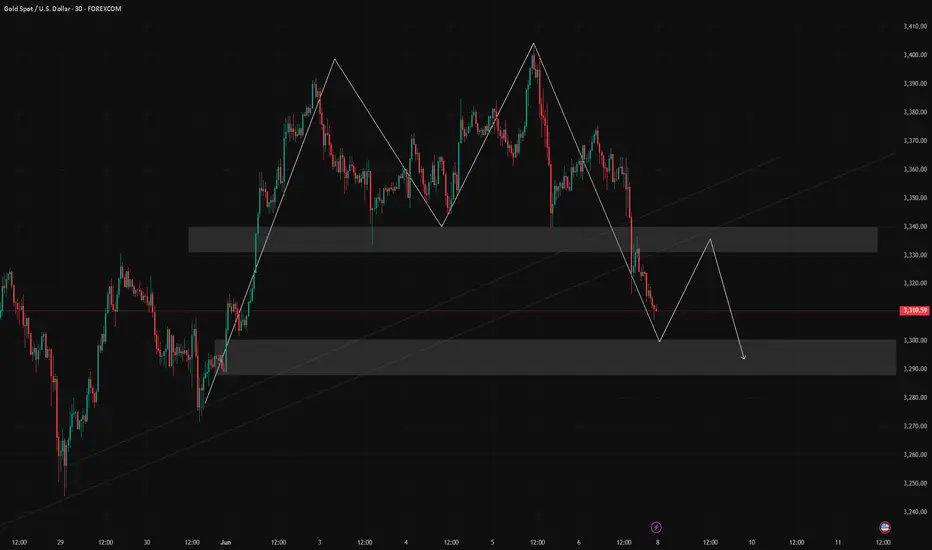
From a technical perspective, a potential M-top (double top) pattern is forming on the 30-minute chart. If confirmed, we can expect a deeper retracement, with an initial target around 3330, and possibly 3300 in case of further downside. Under this structure, today’s primary trading bias should favor short positions.
That said, if gold breaks above 3400 with strength, the 3416–3438 target zone becomes viable. However, any such breakout is likely to be followed by a pullback. In that scenario, we’ll closely monitor the 3392–3368 support range before executing follow-up trades.
📉 Technical Notes:
Price remains near a historical resistance zone, and buyers are showing hesitancy at these levels;
While yesterday’s Beige Book report provided short-term bullish sentiment, we need to observe whether the Asian and European sessions digest and extend that move.
🗞 Fundamental Outlook:
The key event today is the U.S. Initial Jobless Claims report, which may trigger volatility;
Gold remains supported by risk-aversion flows, but traders should be mindful of potential corrections at elevated levels.
💡 Risk Management Tip:
In such conditions, it is highly recommended to scale into positions with reduced lot size, and use tight risk controls to guard against unexpected reversals.
📌 Trading Recommendations for Today:
Sell near 3423–3436, targeting short-term pullbacks
Buy near 3312–3298, if deeper correction materializes
Pivot levels for tactical trades:
3416 / 3403 / 3392 / 3386 / 3367 / 3352 / 3343 / 3328
Strategy Summary:
Favor short setups on rallies unless 3400 is decisively broken. If support at 3362-3358 fails, expect the bearish trend to gain further momentum.

BTC Double Bottom incoming?Short term analysis.
I think BTC will drop back to 101800 to make double bottom then bounce back to 105200

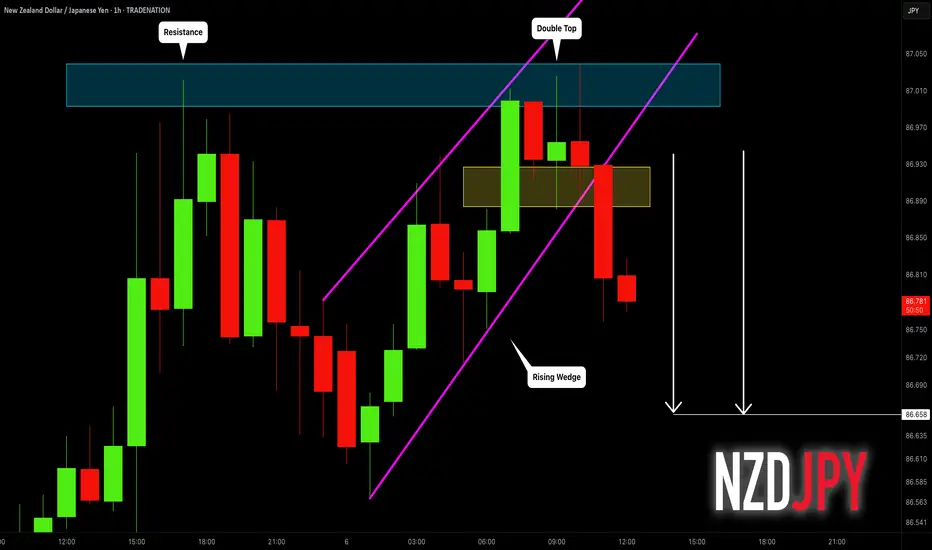
NZDJPY: Another Bearish YEN Pair 🇳🇿🇯🇵
One more YEN pair that looks bearish to me is NZDJPY.
I see 2 bearish price action confirmations after a test
of the underlined horizontal resistances:
the price broke a support line of a rising wedge pattern
and a neckline of a double top.
The price may drop now to 86.66 level.
❤️Please, support my work with like, thank you!❤️
I am part of Trade Nation's Influencer program and receive a monthly fee for using their TradingView charts in my analysis.
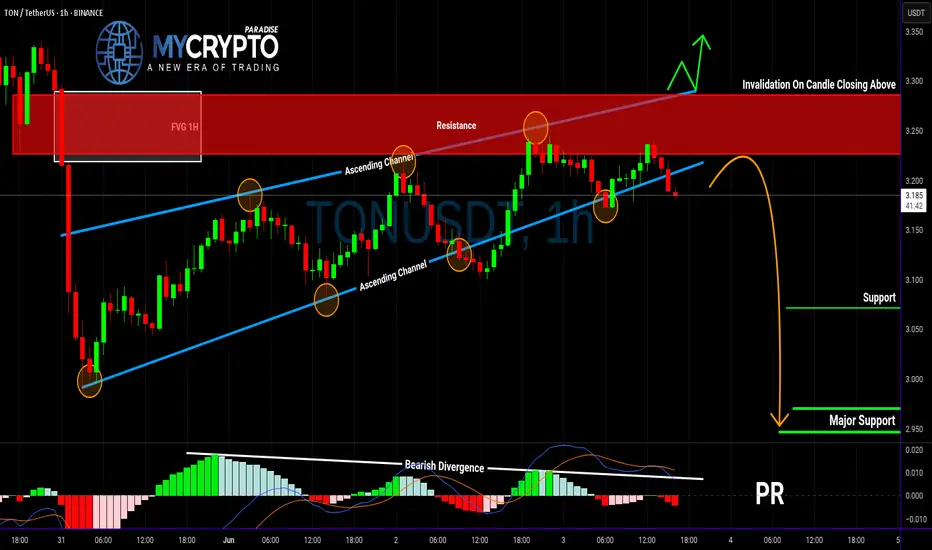
TON Looks Ready to Collapse — Is This the Start of a Bull Trap?Yello Paradisers! what if TON is about to reverse hard—are you positioned correctly, or will you be caught chasing the wrong move?
💎TONUSDT is showing clear bearish signs that can’t be ignored. The price has broken down from an ascending channel—a classic early signal of weakness. But that’s not all. This breakdown happened right at the resistance zone, and it’s backed by a clear bearish divergence on momentum indicators. Adding to the conviction, there’s a 1H Fair Value Gap (FVG) sitting right in that same region, which often acts as a magnet for price before continuation to the downside.
💎This confluence significantly increases the probability of a bearish move in the short term. So, what’s the plan?
💎For risk-averse (safe) traders, the optimal approach is to wait for a pullback and retest of the broken structure. This allows for a cleaner entry and a much better risk-to-reward (RR) ratio. For the aggressive players, there’s potential to enter with reduced size from the current level, understanding that it carries more risk without confirmation.
💎However, if the price manages to break out and closes candle above the resistance zone, this entire bearish setup becomes invalidated. In that case, the smart play is to stay patient and wait for a more favorable structure or price action to develop.
🎖If you want to be consistently profitable, you need to be extremely patient and always wait only for the best, highest probability trading opportunities.
MyCryptoParadise
iFeel the success🌴