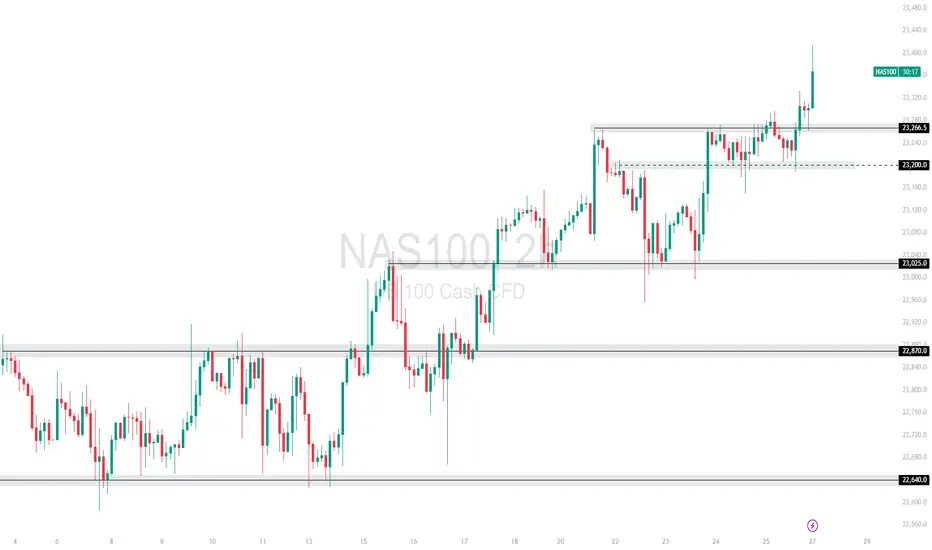
NAS100 Gaps Up on Trump Trade Deal – Bullish Continuation The market opened with a bullish gap after Trump announced new trade deals, sparking investor optimism. Price cleanly broke above the 23,266.5 🔼 resistance level, confirming it as a fresh support zone.
Buyers are now in full control, and price is forming a strong bullish structure with higher highs and higher lows.
Support at: 23,266.5 🔽, 23,200 🔽, 23,025 🔽
Bias:
🔼 Bullish: As long as price holds above 23,266.5, the path is clear for a move toward 23,400 and possibly 23,540+. Watch for minor pullbacks into support for continuation setups.
🔽 Bearish: A break back below 23,266.5 would be the first warning of bullish exhaustion, with downside potential toward 23,200.
📰 News Insight: The bullish gap came after Donald Trump announced new trade deals, boosting risk sentiment across U.S. indices. This has become a key short-term fundamental catalyst.
📛 Disclaimer: This is not financial advice. Trade at your own risk.
Double Top or Bottom
GER40 | Cools Below ResistanceThe DAX rallied aggressively into 24,618.3, but price action has since turned sideways. The index is now ranging just below resistance, as bulls and bears battle for direction in this consolidation phase.
Support at: 24,000.00 / 23,687.21 / 23,500.00 / 23,047.01 🔽
Resistance at: 24,618.30 🔼
🔎 Bias:
🔼 Bullish: Clean break and close above 24,618.30 targets fresh highs.
🔽 Bearish: Break below 24,000 may confirm short-term distribution toward 23,687 and 23,500.
📛 Disclaimer: This is not financial advice. Trade at your own risk.

DXYJULY 21-25 recap
Net was -296 last week
Price dropped until Wednesday
Hit the weekly demand zone (strong support)
Sellers paused or covered shorts there
Buyers stepped in → possible bounce or reversal

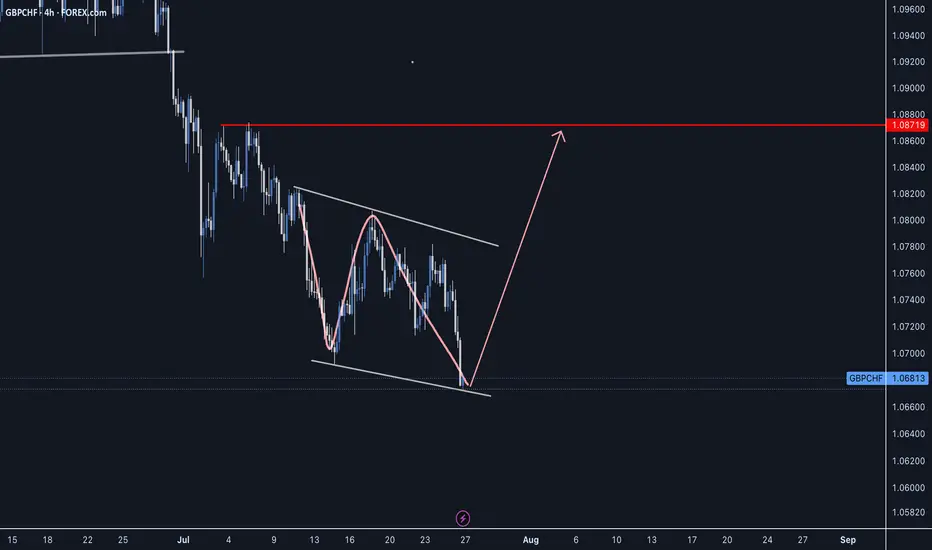
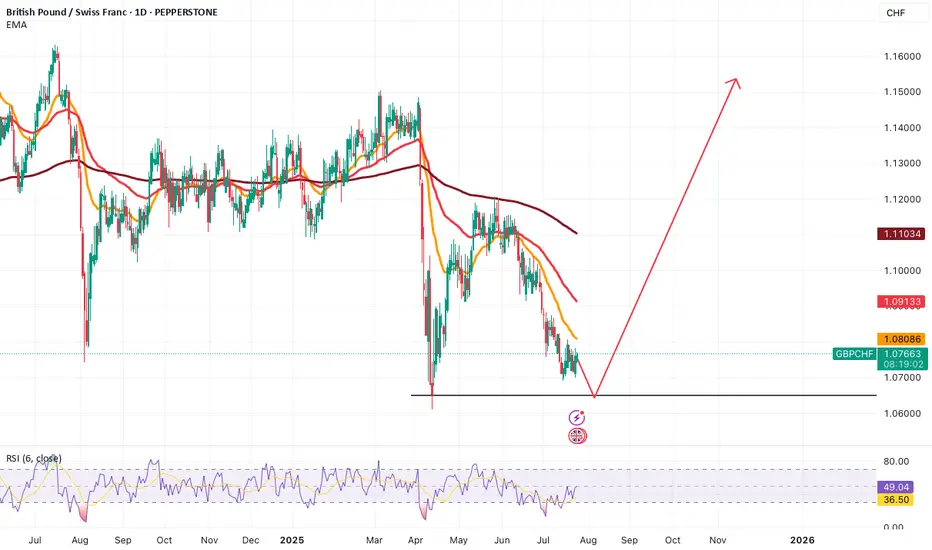
GBPCHF - Classic 'W' PatternGBPCHF has been setting up for the next impulse phase as we can see common 'W' price action pattern which has made the last swing low in this reversal structure to see buyers step in and push price upward.
Always wait for confirmation, Good Luck
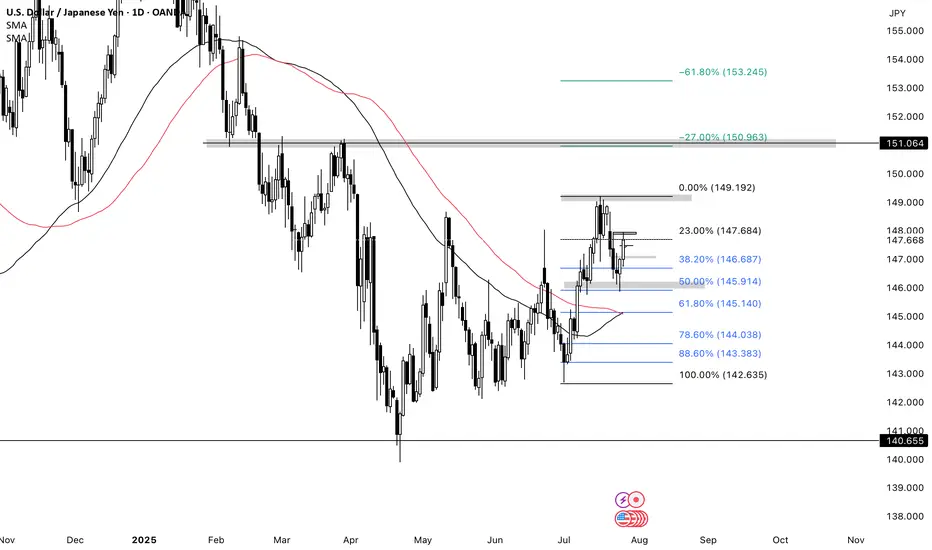
USDJPY BULLISHUJ closed bullish last week so I’ll continue looking for buys this week. There was a daily double bottom & 50% Retracement on the daily timeframe. I would like for price to either break the H4 resistance, form a HL then look for buys. Or price could retrace and form a HL the I’ll look for buys towards daily resistance @149.190 then my next TP will be 151.00
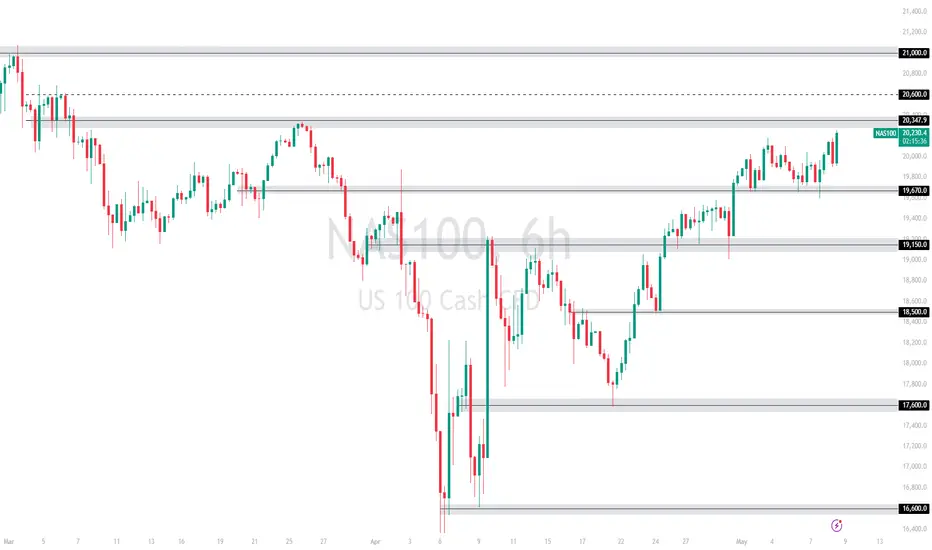
NASDAQ Bulls Pushing – Will 20,347 Hold or Break?Price is currently approaching the 20,347 🔼 resistance zone after a strong bullish rally from the 19,150 🔽 support level. The market structure remains bullish with consistent higher highs and higher lows, showing strong buyer momentum.
Support at: 19,670 🔽, 19,150 🔽, 18,500 🔽, 17,600 🔽
Resistance at: 20,347 🔼, 20,600 🔼, 21,000 🔼
Bias:
🔼 Bullish: If price breaks and holds above 20,347 🔼, we could see a continuation toward 20,600 and 21,000.
🔽 Bearish: A strong rejection from 20,347 🔼 could send price back down toward 19,670 and 19,150 for a retest.
📛 Disclaimer: This is not financial advice. Trade at your own risk.
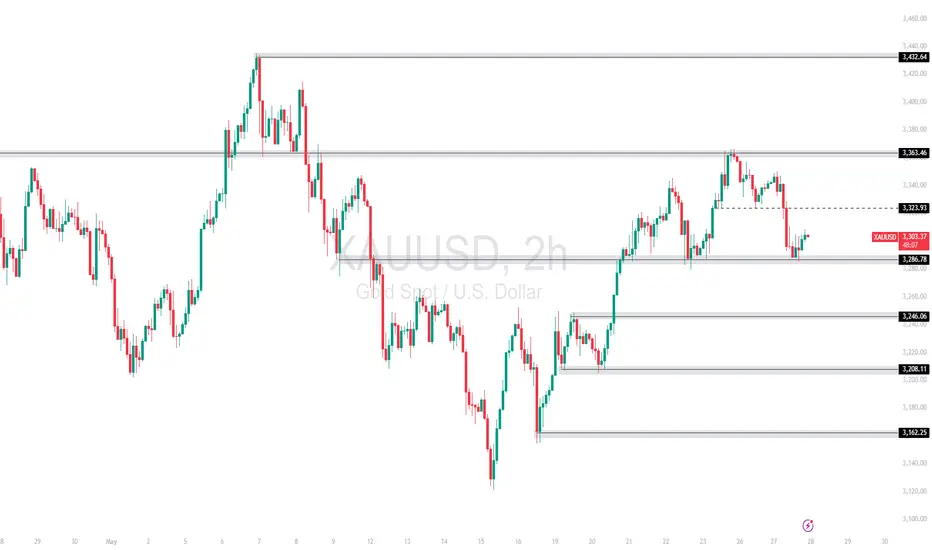
XAUUSD Bounce Underway – Can Bulls Reclaim 3,363 Zone ?Gold is attempting a rebound after finding support near the 3,286.78 🔽 level, following a sharp pullback from the 3,363.46 🔼 resistance. The structure remains bullish on the higher timeframe, but recent weakness has created a short-term lower high. Price is currently caught between the 3,323.93 🔼 and 3,286.78 🔽 levels, forming a short-term range.
Support at: 3,286.78 🔽, 3,246.06 🔽, 3,208.11 🔽, 3,162.25 🔽
Resistance at: 3,323.93 🔼, 3,363.46 🔼, 3,432.64 🔼
🔎 Bias:
🔼 Bullish: A break and hold above 3,323.93 could open the path for another test of the 3,363.46 level and possibly higher.
🔽 Bearish: Failure to reclaim 3,323.93 and a drop below 3,286.78 may shift momentum further downward, targeting 3,246.06 or lower.
📛 Disclaimer: This is not financial advice. Trade at your own risk.
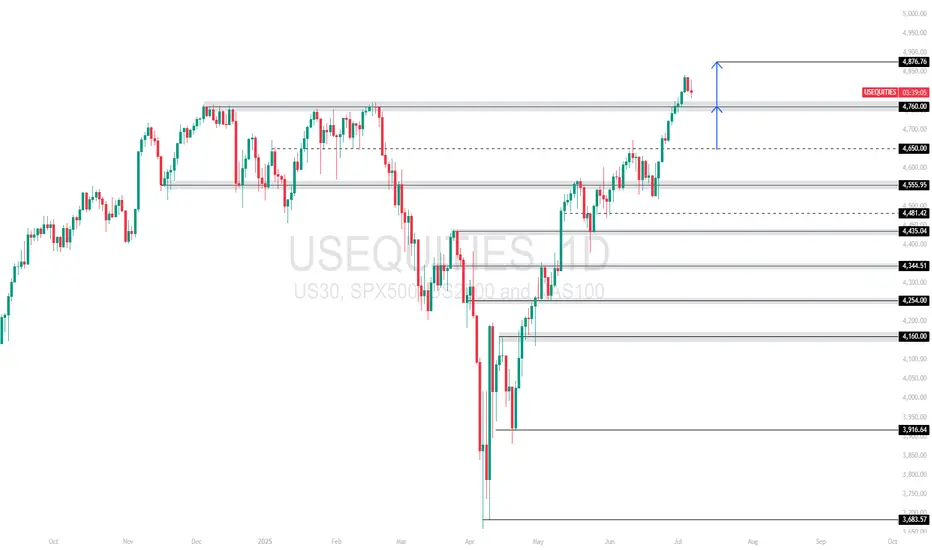
US Equities Index – Retesting Breakout Zone After Strong RallyUS Equities Index recently broke through the 4,760.00 resistance zone with strength, but price is now pulling back slightly, possibly retesting this level as new support. The projected upside targets the 4,876.76 zone, which remains the next key resistance.
Support at: 4,760.00 🔽 | 4,650.00 🔽
Resistance at: 4,876.76 🔼
🔎 Bias:
🔼 Bullish: Holding above 4,760.00 confirms breakout structure with potential continuation toward 4,876.76.
🔽 Bearish: A breakdown back below 4,760.00 could shift bias short-term toward 4,650.00 and 4,555.95.
📛 Disclaimer: This is not financial advice. Trade at your own risk.
Market Dip or Bullish Pause Why These 4 Crypto Still Have StrongAs the crypto market retraced modestly in late July, shedding roughly 5% in total market cap, investors were left wondering: is this a signal of deeper correction—or merely a bullish pause before the next leg up?
According to analysts across leading funds and research firms, the recent dip may be healthy consolidation—and several assets continue to show strong structural momentum, even as prices pull back.
Here are four cryptocurrencies still demonstrating resilience and upside potential:
1. Bitcoin (BTC): Strong Hands, Strong Signals
Despite falling from $131,000 to $115,000, Bitcoin’s long-term holder supply reached an all-time high, with over 70% of BTC unmoved in over 12 months. Derivatives data shows rising open interest and neutral funding rates—suggesting professional positioning, not panic.
“If this is a pullback, it’s one with strong underpinnings,” said Felix Grayson, portfolio manager at Helix Funds.
2. Ethereum (ETH): ETF Flows and Ecosystem Growth
Ethereum continues to benefit from spot ETF inflows and Layer 2 expansion. Gas fees remain low, and total value locked (TVL) on Ethereum-based chains has grown by 9% in July alone.
“ETH’s on-chain activity is diverging from price,” said Melinda Zhou, research lead at TitanAlpha. “That’s usually a leading indicator.”
3. Chainlink (LINK): Real-World Integration Boom
LINK is quietly gaining institutional traction. The token surged 14% month-to-date on the back of Oracle partnerships with global banks exploring tokenized bonds and CBDCs.
Chainlink’s Cross-Chain Interoperability Protocol (CCIP) is also seeing adoption by multiple Layer 1s, strengthening its role as the data layer of Web3.
4. StarkNet (STRK): Layer 2 With Institutional Backing
A newer entrant, StarkNet, is positioning itself as the “ZK-powered” Ethereum scalability solution of choice. With backers like Sequoia and Paradigm, and growing traction among DeFi protocols, STRK has outperformed peers in July with a 27% gain.
“The zero-knowledge narrative is just beginning,” noted Zhou. “StarkNet could lead the next phase of Layer 2 expansion.”
Conclusion
Not all dips are created equal. While short-term price action may test investor nerves, fundamentals across major Layer 1 and Layer 2 networks remain robust and improving. For seasoned investors, these moments offer not panic—but perspective.
As capital returns and development accelerates, expect these four projects to remain at the forefront of the next bullish wave.

GBPCHF Forming Double BottomGBPCHF seems to be forming a visible double bottom.
The second bottom has to still form, we are waiting for that.
If the second bottom does form, we'll be looking for buys.
S&P 500 (CASH500) - Double Top H1Risk/reward = 2.7
Entry price = 6388.4
Stop loss price = 6399.7
Take profit level 1 (50%) = 6360.4
Take profit level 2 (50%) = 6352
Also, waiting on confirmation on some variables
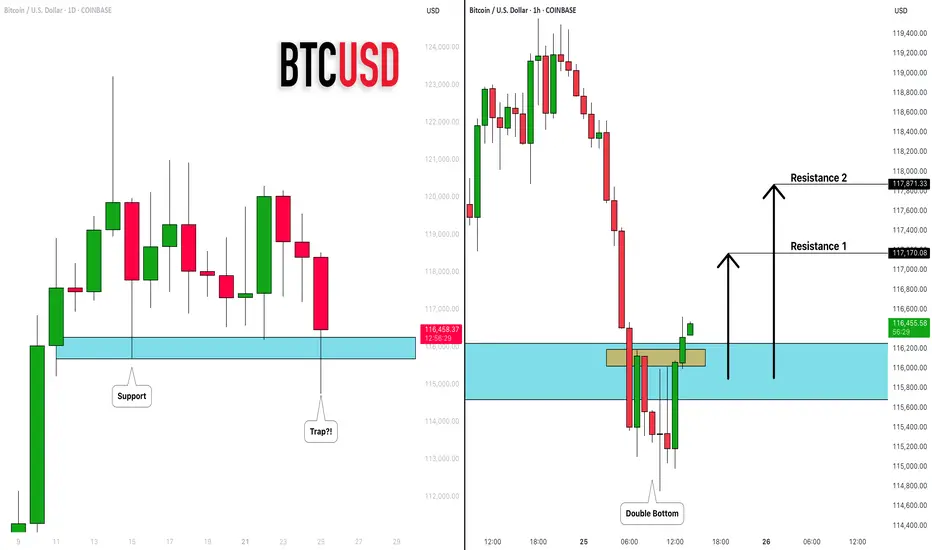
BITCOIN (BTCUSD): Recovery Starts
Bitcoin is going to rise from a key daily support.
After a liquidity grab, the market shows a clear strength,
forming a double bottom on an hourly time frame.
I expect a bullish movement at least to 117100
❤️Please, support my work with like, thank you!❤️
I am part of Trade Nation's Influencer program and receive a monthly fee for using their TradingView charts in my analysis.
NASDAQ (CASH100) SHORT - double top H6Risk/reward = 4.3
Entry price = 23 282
Stop loss price = 23 398
Take profit level 1 (50%) = 22 871
Take profit level 2 (50%) = 22 663
If current H6 goes back into range, I will open short position.
All variables on checklist have been met.
I was out last night so I missed my initial entry. Hoping for a second chance.
Hopefully this short works because the last few higher time frame short setups have failed, although because of exit plan I have made very little losses.

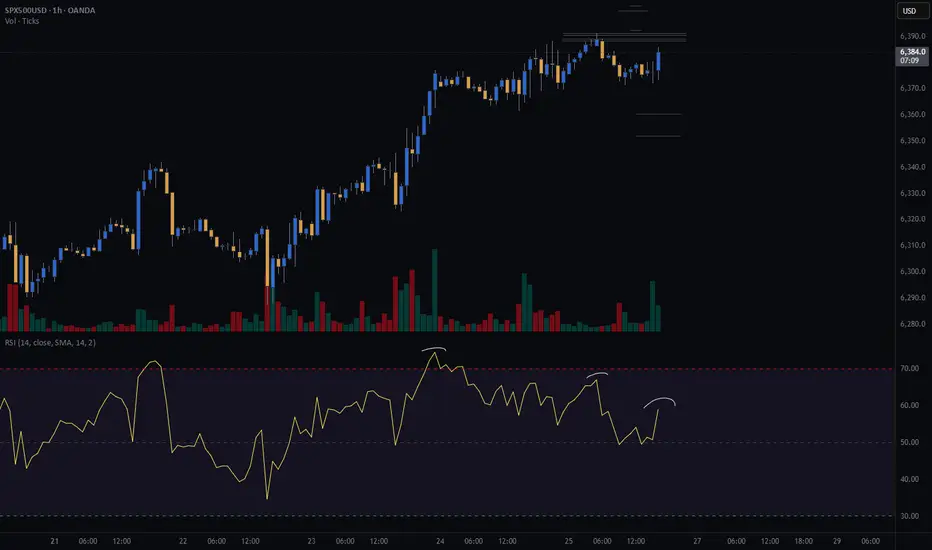
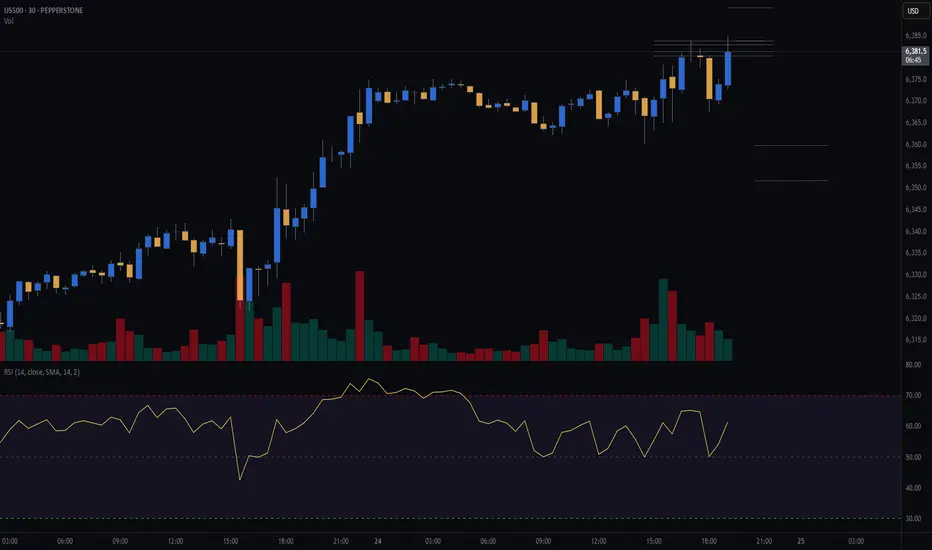
S&P (CASH500) SHORT - Double top 30minRisk/reward = 2.7
Entry price = 6384
Stop loss price = 6393.8
Take profit level 1 (50%) = 6359.8
Take profit level 2 (50%) = 6351.8
Will get confirmation of remaining variables at close of this 30min candle at 19.30.
RZLV formed round bottomBusiness Model: AI SaaS for retail—mobile-first, gen‑AI conversational commerce and checkout.
Financials: Very low revenue base, heavily loss-making, but building enterprise footprint and usage.
Balance Sheet: Strengthened via equity conversions, debt facility, and capital raises; dilution risk remains.
Traction: Growing client deployments across major brands; usage and GMV accelerating in 2025.
Leadership: Experienced team, led by a founder-CEO and a seasoned global CTO/product head drawn from tech‑commerce backgrounds.
Despite minimal current revenue, Rezolve AI is betting on rapid scaling through partnerships with Microsoft, Google, and enterprise clients. Execution and monetization in 2025 will be pivotal to its valuation trajectory.

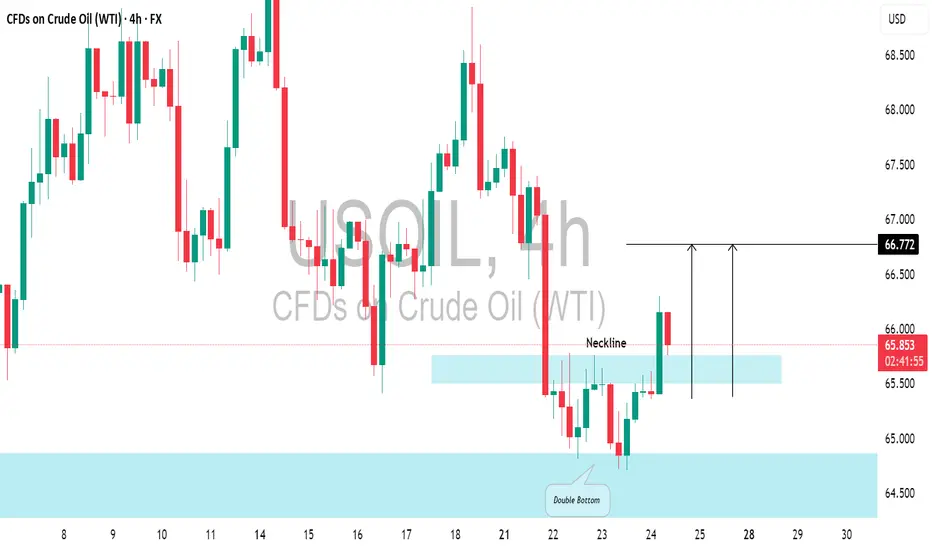
US CRUDE OIL (WTI): Pullback From Support📈USOIL responded well to the highlighted daily support level.
The price formed a double bottom pattern on that and broke above its neckline.
There's a strong likelihood that the price will continue to increase and reach 66.72 shortly.
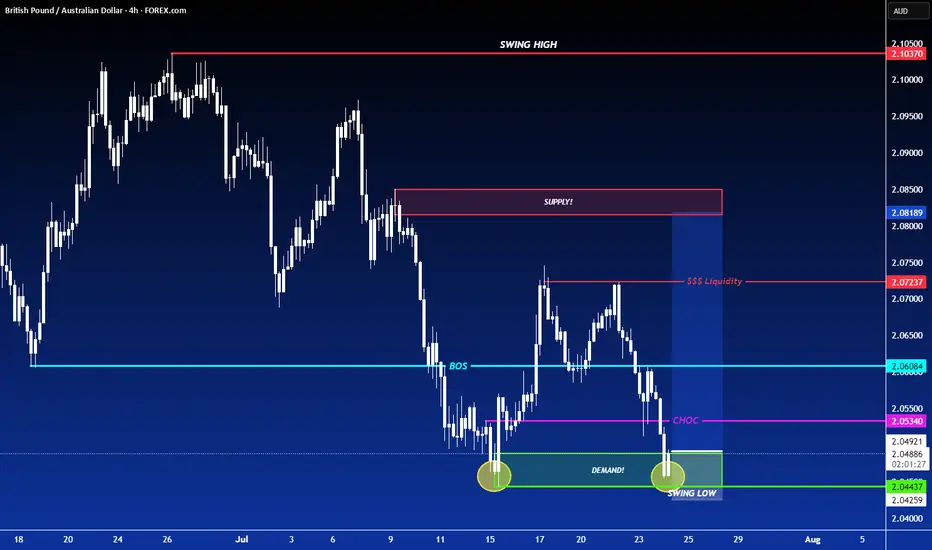
LONG ON GBP/AUDGA has given us a CHOC (change of character) to the upside after making a new low.
Price has since pulled back to the demand area that created that change leaving us with a possible double bottom forming.
I expect GA to rise to sweep buy side liquidity at the equal highs then reaching the previous supply level / previous High.
Looking to catch 200-300 pips.
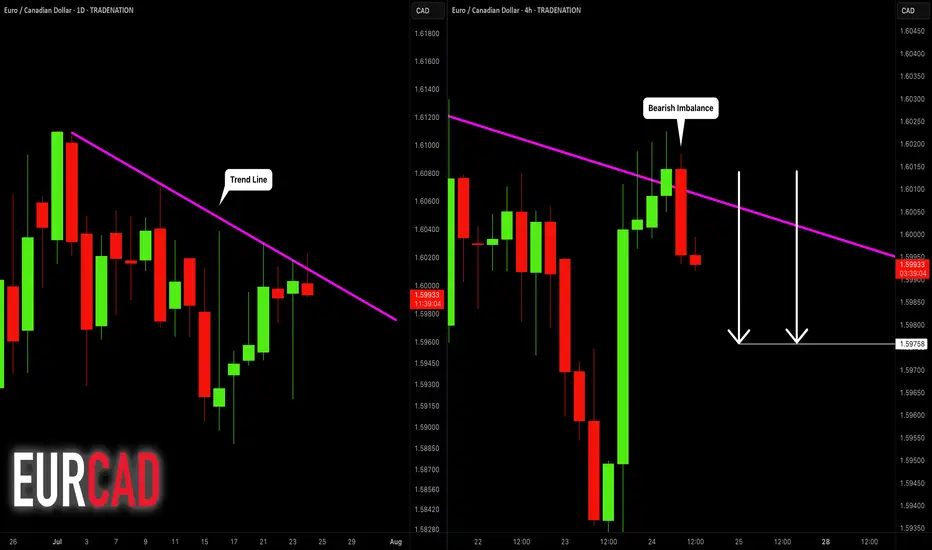
EURCAD: Bearish After the News 🇪🇺🇨🇦
EURCAD may drop from a solid daily resistance.
As a confirmation signal, I spotted a bearish engulfing candle
on a 4H time frame after its test.
The formation of this candle is accompanied by multiple negative
German fundamentals.
Goal - 1.5976
❤️Please, support my work with like, thank you!❤️
I am part of Trade Nation's Influencer program and receive a monthly fee for using their TradingView charts in my analysis.
S&P 500 (CASH 500) SHORT - Double top H8Risk/reward = 4.1
Entry price = 6343.3
Stop loss price = 6365.3
Take profit level 1 (50%) = 6268.1
Take profit level 2 (50%) = 6232.1
Still waiting on some variables on checklist to be confirmed before I enter the trade.

GBPUSD Traders Beware: A Major Drop Could Be ComingThe classic rule says what doesn’t go up must come down. After a failed breakout at 1.3439, GBPUSD is struggling. With longs sitting on big gains from January’s low, a drop toward 1.3361 or even lower looks likely. Watch this key level now.
This content is not directed to residents of the EU or UK. Any opinions, news, research, analyses, prices or other information contained on this website is provided as general market commentary and does not constitute investment advice. ThinkMarkets will not accept liability for any loss or damage including, without limitation, to any loss of profit which may arise directly or indirectly from use of or reliance on such information.

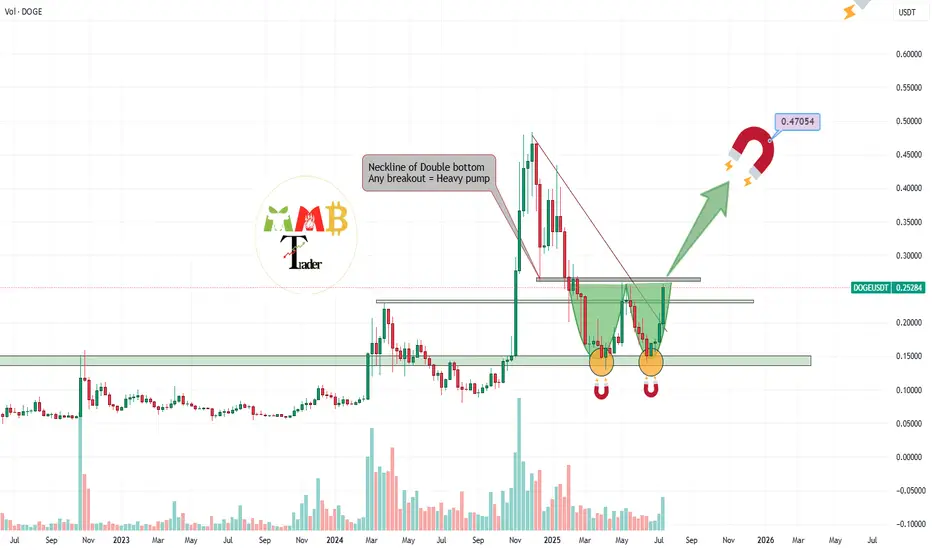
DOGEUSDT double bottom pattern or my Magnet pattern???So many of Traders around the world sees weekly Strong reversal pattern which is double Bottom and they are waiting for breakout of neckline which is last major resistance of 0.26$ and i think soon it can break the resistance and heavy pump ahead after breakout is expected.
But you may be wrong the upcoming pump here is due to my magnets on chart.
find them all and see how it pump price.
Who finds all targets for BINANCE:DOGEUSDT ?
But remember and never forget this was not
DISCLAIMER: ((trade based on your own decision))
<<press like👍 if you enjoy💚
AGTL is at good buying priceAGTL is at a good buying price, a partial entry may be taken today, and remaining on the breakout.
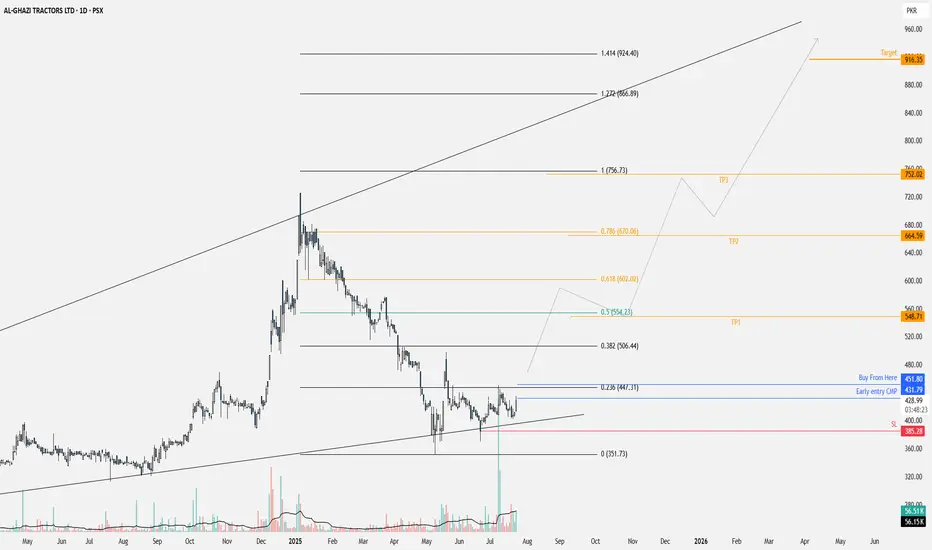
SET
Apil 2025 since the price is oversold from Feb2025 price still drop contrary with momentum
BigBlack candle followed by exhaustion gap at exactly the end of wave 5 of C
Pattern Double Bottom, Island Reversal
Be careful with the false break out at 1,250. Look closly at the momentum
Around 1,100 is a good buy zone and I do think once it break 1,250 or 1,300 price will never come back to 1,100 again.
