EUR/GBP Chart Analysis – Double Bottom Reversal & Breakout Setup1. Market Structure & Context
The EUR/GBP daily chart presents a well-defined double bottom reversal pattern, indicating a potential trend shift from a prolonged downtrend to an uptrend.
The pair has been in a bearish phase, as reflected by the descending trendline.
However, price action suggests a possible trend reversal, as buyers are stepping in near a key demand zone.
A successful neckline breakout would confirm the bullish reversal, potentially leading to significant upside movement.
2. Key Chart Patterns & Technical Levels
A. Double Bottom Formation (Bullish Reversal Pattern)
The double bottom is a powerful reversal pattern, often signaling the end of a downtrend. It consists of two similar low points, forming a "W" shape.
Bottom 1: The first low was established around 0.8200 - 0.8250, where buyers initially stepped in to push prices higher.
Bottom 2: Price retested this demand zone, but sellers failed to push it lower, confirming a strong support level.
Bullish Significance: The inability of sellers to break below the support zone suggests the exhaustion of selling pressure and increasing buy-side interest.
B. Neckline Resistance & Potential Breakout Zone
The neckline resistance is drawn around 0.8450 - 0.8500, a key level where previous price rallies were rejected.
A breakout above this zone, ideally with strong bullish volume, would validate the double bottom pattern and trigger a bullish breakout trade.
C. Descending Trendline Breakout Attempt
The long-term downtrend resistance (trendline) has been holding since mid-2024.
Price is currently testing this trendline; a clear breakout and retest would add further confidence to the bullish bias.
3. Trade Setup & Execution Plan
A. Entry Strategy
There are two possible entry strategies, depending on risk appetite:
Aggressive Entry: Buy immediately upon a breakout above 0.8500, anticipating a strong rally.
Conservative Entry: Wait for a breakout + retest of the neckline before entering, ensuring confirmation.
B. Stop Loss & Risk Management
Stop Loss (SL): Placed below the recent swing low at 0.82029.
This level acts as the last line of defense for bulls; if price drops below it, the bullish thesis is invalidated.
C. Take Profit (TP) Targets
TP1: 0.86122 (first resistance zone, a previous swing high).
TP2: 0.87284 (higher resistance level, next supply zone).
These levels serve as potential profit-taking areas where sellers may re-enter the market.
4. Additional Technical Confluences Supporting Bullish Bias
✔ Key Support Zone Holding Strong – The price has bounced twice from the demand zone (0.8200 - 0.8250), confirming strong buyer interest.
✔ Volume Confirmation Needed – A breakout with high volume increases the probability of sustained bullish momentum.
✔ RSI & Momentum Indicators – If RSI crosses above 50, it would further confirm bullish momentum, supporting the breakout trade.
✔ Favorable Risk-to-Reward Ratio (RRR) – A well-defined stop loss & take profit strategy ensures an optimal trade setup.
5. Summary & Final Trading Plan
Current Market Bias: Bullish if neckline breaks (Double Bottom Confirmation).
Entry Confirmation: Look for a breakout above 0.8500 with strong volume.
Profit Targets:
TP1: 0.8612
TP2: 0.8728
Stop-Loss Level: Below 0.8202 to protect against fake breakouts.
🚀 Final Tip for Traders:
Monitor price action & volume closely. A breakout without volume may lead to a false move. Confirmation with bullish momentum is essential for a high-probability trade setup.
Double Top or Bottom

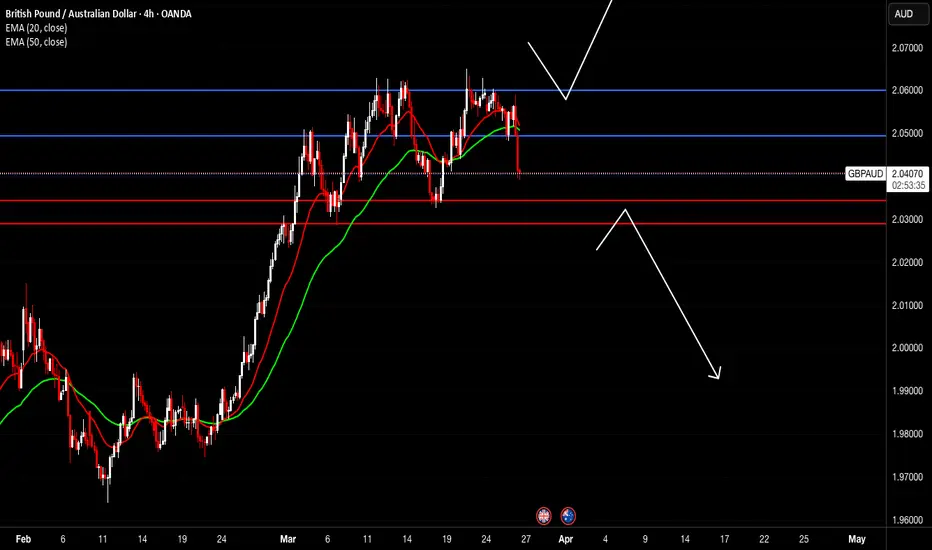
GBPAUDThis is a trade for weeks or months. We are back to a very strong resistance zone that was last touched 5 years back. Daily looks to be forming a double top. We should wait for H4 support to be broken which is also the neckline of the double top.
Gold is expected to rise to the 3030-3040 zone againGold encountered a clear rejection signal after reaching around 3036, indicating the presence of resistance and a technical need to retest support. Currently, gold is undergoing this support retest.
Within the current structure, gold has established a notable W-bottom pattern, with key support formed around the 3000 and 3003 levels. This structural support remains relatively strong. If gold manages to hold above the 3015-3005 support zone during the retest, a renewed upward move is likely. In that scenario, gold could resume its ascent, potentially retesting the 3030-3040 resistance range.
So in terms of short-term trading, if gold pulls back to the 3015-3005 zone, we can consider going long on gold in moderation.I would make more detailed trading plans and trading signals every day according to the real-time market situation, which is also the testimony of every successful transaction and profit of mine; the article has a certain lag, if you want to copy the trading signals to make a profit, or master independent trading skills and thinking, you can choose to join the channel at the bottom of the article

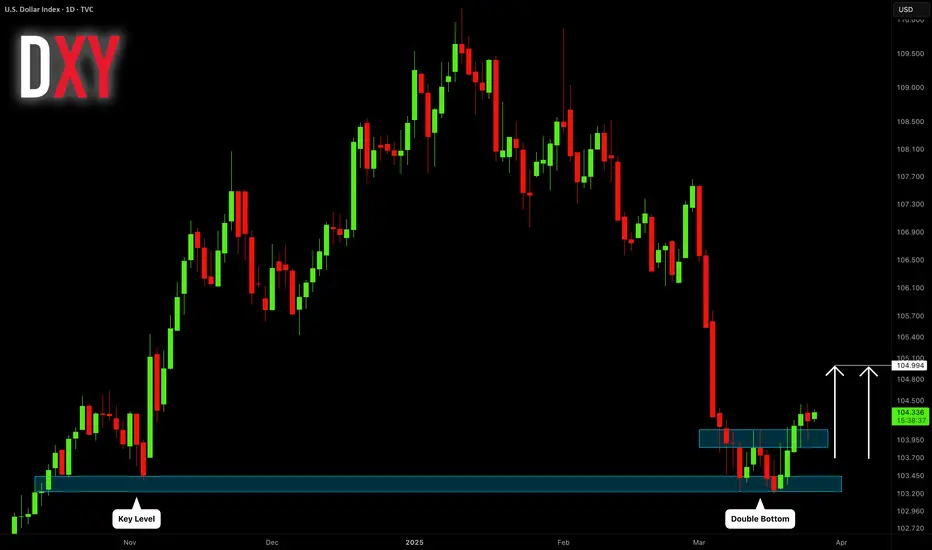
DOLLAR INDEX (DXY): Time to Recover
I see a confirmed bullish reversal on Dollar Index
initiated after a test of a key daily horizontal support.
A formation of a double bottom pattern on that and a consequent
violation of its neckline provides a strong bullish signal.
I think that the index will reach at least 105.0 level soon.
❤️Please, support my work with like, thank you!❤️
$BTC double top pattern detected 1H timeframe.As shown on the chart, a double top has formed on the CRYPTOCAP:BTC chart.
While the overall trend remains bullish, there is also a clear bearish divergence.
The question is — will CRYPTOCAP:BTC follow the technicals and see a short-term correction, or will it continue pumping as if nothing happened? Let’s wait and see!
DYOR

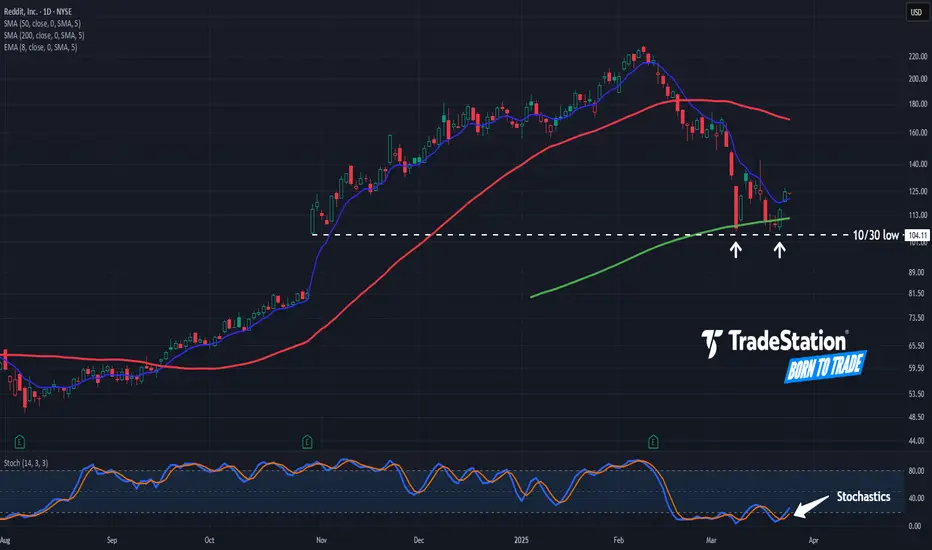
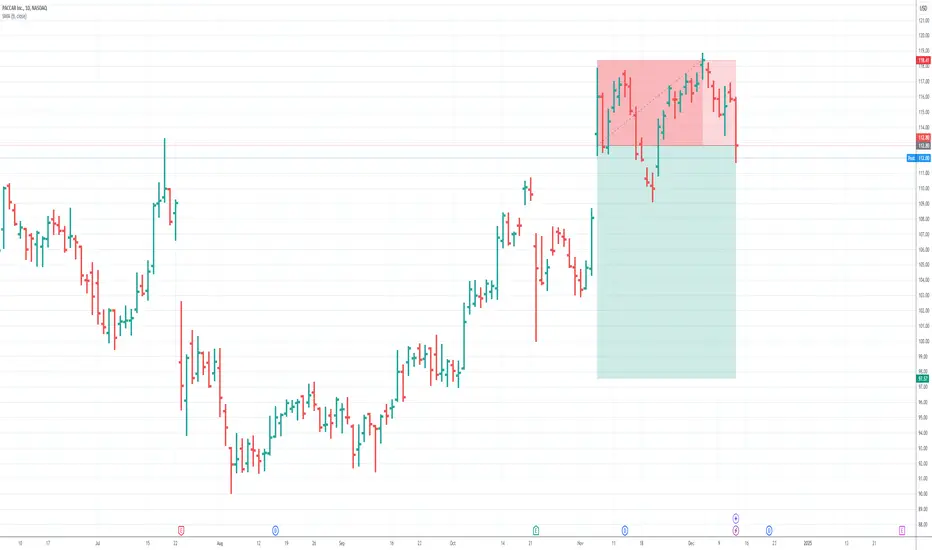
Reddit Has Pulled BackReddit hit a record high early last month. Will some traders see an opportunity in the current pullback?
The first pattern on today’s chart is the bullish gap on October 30 after earnings beat estimates. RDDT approached the low of that session on March 10 and again last week. It bounced both times. That apparent double bottom may suggest new support has been established.
Next, the rebounds occurred around the 200-day simple moving average. Holding that line may suggest an uptrend is in place.
Finally, stochastics have turned up from an oversold condition. The stock also closed above its 8-day exponential moving average. Those patterns are potentially consistent with prices bottoming.
TradeStation has, for decades, advanced the trading industry, providing access to stocks, options and futures. If you're born to trade, we could be for you. See our Overview for more.
Past performance, whether actual or indicated by historical tests of strategies, is no guarantee of future performance or success. There is a possibility that you may sustain a loss equal to or greater than your entire investment regardless of which asset class you trade (equities, options or futures); therefore, you should not invest or risk money that you cannot afford to lose. Online trading is not suitable for all investors. View the document titled Characteristics and Risks of Standardized Options at www.TradeStation.com . Before trading any asset class, customers must read the relevant risk disclosure statements on www.TradeStation.com . System access and trade placement and execution may be delayed or fail due to market volatility and volume, quote delays, system and software errors, Internet traffic, outages and other factors.
Securities and futures trading is offered to self-directed customers by TradeStation Securities, Inc., a broker-dealer registered with the Securities and Exchange Commission and a futures commission merchant licensed with the Commodity Futures Trading Commission). TradeStation Securities is a member of the Financial Industry Regulatory Authority, the National Futures Association, and a number of exchanges.
TradeStation Securities, Inc. and TradeStation Technologies, Inc. are each wholly owned subsidiaries of TradeStation Group, Inc., both operating, and providing products and services, under the TradeStation brand and trademark. When applying for, or purchasing, accounts, subscriptions, products and services, it is important that you know which company you will be dealing with. Visit www.TradeStation.com for further important information explaining what this means.
GOLD H1 Bullish My AnalysisGold pair analysis for today, March 25, 2025
Pattern:
Double Bottoms appear in a downtrend and reverse it to the upside as price breaks through the resistance line. It is considered a bullish reversal chart pattern since the price holds a low two times and eventually continues with a higher high. The bounce between the two lows should be moderate.
Support and Resistance Levels:
support levels are 2976, while resistance levels are 3056.80
Indicators:
The RSI is at 51.10, indicating bullish momentum.
Overall, gold's price is expected to continue its bullish trend.
we Consider buying
Gold buy Entry: 3018
TP: 3029
TP: 3048
TP: 3056.8
TP: 2998
SL: 3000

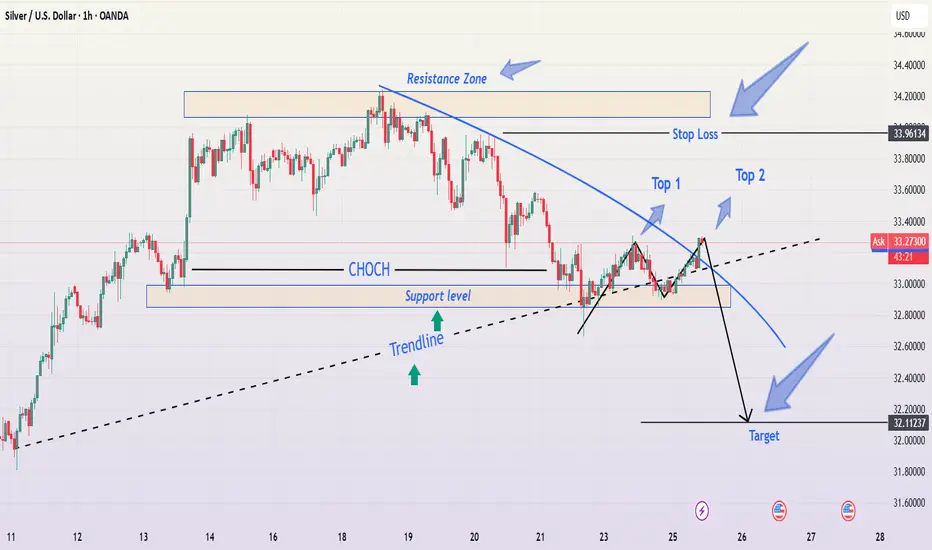
Silver (XAG/USD) Double Top Reversal – Bearish Trading SetupThe provided 1-hour chart for Silver (XAG/USD) presents a well-structured bearish trade setup, highlighting key price action patterns, technical indicators, and confluence factors that suggest a potential downside move. Let's analyze the chart step by step to understand the logic behind this bearish trade setup.
1. Market Structure & Trend Overview
Silver (XAG/USD) has been in a short-term uptrend, as indicated by the ascending trendline. However, the trend now shows signs of exhaustion, with a clear shift in market behavior. The price action reveals the formation of a double top at a strong resistance level, coupled with a Change of Character (CHOCH), which signals a possible reversal.
A break below the trendline suggests that the bullish momentum is losing strength, and sellers are beginning to dominate the market. The combination of these elements makes this setup a high-probability short trade opportunity.
2. Key Technical Levels & Zones
A. Resistance Zone ($33.96 - $34.20) – The Selling Pressure Area
The chart marks a clear resistance zone, where price has struggled to break higher.
Two price rejections from this level indicate that sellers are actively defending this region.
This zone serves as an ideal stop-loss area for short trades, as a breakout above this level would invalidate the bearish setup.
B. Double Top Formation – Reversal Pattern
The price tested the resistance zone twice and failed to establish new highs, forming a double top structure.
A double top is a well-known bearish reversal pattern, indicating a shift from bullish to bearish momentum.
The second top (Top 2) aligns with a downward trendline, further confirming that sellers are stepping in at lower levels.
C. Support Level ($32.60 - $32.80) – Initial Reaction Zone
This area has previously acted as a demand zone where buyers stepped in.
If the price breaks below this support, it would confirm further downside movement towards the final target.
D. Trendline Breakdown – Loss of Bullish Momentum
The dotted trendline represents the previous bullish trend, supporting price action for several days.
A break below this trendline suggests a structural shift in market dynamics, meaning buyers are losing control.
The failure to reclaim the trendline increases the probability of a deeper move downward.
E. Target Level ($32.11 - $32.20) – The Bearish Objective
The projected target is based on the double top’s measured move, which suggests a price drop to at least $32.11.
This level also coincides with previous historical price action, making it a strong confluence zone for profit-taking.
3. Trading Strategy & Execution Plan
📌 Entry Point:
Aggressive Entry: Short position around $33.40 - $33.50, near the second top where price rejected the trendline.
Conservative Entry: Wait for a confirmed break and retest of the support level at $32.80 before entering short.
📌 Stop-Loss Placement:
The stop-loss should be placed above the resistance zone at $33.96.
This level ensures that the trade is invalidated if the price breaks out higher.
📌 Take-Profit Target:
Primary Target: $32.60, which is the first support level where price may temporarily react.
Final Target: $32.11, aligning with the double top breakdown target and historical support.
📌 Risk-Reward Ratio:
A minimum 1:2 risk-reward ratio, meaning for every 1% risked, there is a potential 2%+ gain.
This makes the trade favorable in terms of risk management.
4. Confluence Factors Supporting the Bearish Outlook
✅ Double Top Formation – A classic bearish reversal pattern.
✅ Lower Highs Formation – Indicates increasing selling pressure.
✅ Trendline Breakdown – A significant loss of bullish momentum.
✅ Resistance Zone Rejection – Strong seller presence.
✅ CHOCH (Change of Character) – Confirms a shift in market sentiment.
5. Risk Management & Alternative Scenario
📌 What If Price Moves Against the Trade?
If the price breaks above $33.96, the bearish outlook becomes invalid, and a potential bullish continuation could follow. In this case:
Stop-loss is triggered, and the setup is considered invalid.
Traders should then wait for a new setup before re-entering the market.
📌 Market Conditions to Monitor:
Volatility: Ensure there is enough momentum in the market before entering.
Volume Confirmation: A break below support should have strong volume.
News Events: Watch out for fundamental catalysts, such as US Dollar strength, economic data, and geopolitical events, which could influence Silver’s price movement.
6. Final Thoughts & Summary
This chart setup provides a clear bearish trade opportunity based on technical analysis. The combination of double top formation, resistance rejection, trendline breakdown, and lower highs strongly supports the idea of further downside movement.
💡 Key Takeaways:
Bearish bias is valid as long as price stays below $33.96.
Target is set at $32.11, with an intermediate support at $32.60.
Risk-to-reward is favorable, making it an ideal short trade setup.
If the market follows this expected scenario, this trade has the potential to yield significant profit while maintaining disciplined risk management. However, always stay alert to market conditions and adjust strategies accordingly.
CHF/USD – Double Bottom Reversal Setup - Trading SetupComprehensive Analysis of CHF/USD 4-Hour Chart
The CHF/USD 4-hour chart presents a technical trading setup based on a Double Bottom reversal pattern, combined with trendline support and key resistance levels. This pattern suggests a potential bullish breakout if key resistance is cleared. Below is a professional breakdown of the chart, covering the market structure, pattern formation, and a strategic trading setup.
1️⃣ Market Structure & Trend Analysis
The overall market structure suggests that CHF/USD has been in an uptrend, as indicated by the ascending trendline that has consistently provided support. The price has recently tested a key support zone twice, forming the Double Bottom pattern, which is known for signaling a trend reversal or continuation of an uptrend.
The dashed trendline connecting higher lows confirms the bullish momentum.
As long as the price stays above this trendline support, the bullish bias remains valid.
A break below the trendline would indicate a possible reversal or a deeper retracement.
The most critical observation here is that the price is respecting both the trendline and horizontal support zone, which increases the likelihood of a breakout in the upward direction.
2️⃣ Double Bottom Pattern Formation
The Double Bottom pattern is clearly formed at a strong demand zone, reinforcing the idea that buyers are stepping in to prevent further declines.
The first bottom was formed after a rejection from the 1.1250 - 1.1290 support zone.
The price then attempted to recover but faced resistance at 1.1350 - 1.1400, which now acts as the neckline of the pattern.
The second bottom was formed at approximately the same price level as the first, confirming the validity of the pattern.
A Double Bottom pattern is considered bullish, but confirmation is required through a breakout above the neckline resistance (1.1350 - 1.1400). If the price successfully breaks this level, it will indicate that buyers have regained control and the price is likely to move higher.
3️⃣ Key Support and Resistance Levels
In this setup, there are three crucial price zones: support, resistance, and the target area.
The support zone, located around 1.1250 - 1.1290, is where buyers stepped in to push the price higher. This level is crucial because it provided strong demand during the formation of the Double Bottom.
The resistance level at 1.1350 - 1.1400 serves as the neckline of the pattern. A breakout above this level would confirm the bullish trend continuation, while rejection could lead to another retest of support.
The target area is projected around 1.1500 - 1.1550, based on the measured move of the Double Bottom formation. This is the price level where traders may start taking profits if the bullish breakout occurs.
4️⃣ Trade Execution Plan
To take advantage of this potential setup, traders should focus on three key aspects: entry, stop-loss placement, and take-profit levels.
Entry Strategy
Aggressive traders can enter a long position above 1.1350, anticipating an immediate breakout.
Conservative traders may wait for a break and retest of the 1.1350 - 1.1400 zone, which would act as a confirmation for a sustained bullish move.
Stop-Loss Placement
A logical stop-loss should be set below 1.1138, which is beneath the Double Bottom formation and trendline support.
If the price drops below this level, it would invalidate the bullish setup and signal a potential trend reversal.
Profit Targets
The first target zone lies around 1.1450 - 1.1500, where traders may consider securing partial profits.
The extended target zone is 1.1550, which aligns with the expected measured move of the Double Bottom pattern.
5️⃣ Risk Management & Final Considerations
Since this setup is based on a strong trendline support and bullish pattern, risk management is essential to protect against fake breakouts or sudden trend reversals.
Traders should monitor price action near the 1.1350 - 1.1400 resistance zone. A strong bullish candle closing above this area increases the likelihood of a successful breakout.
If the price fails to break out and starts moving lower, it may indicate that sellers are still in control, which could lead to a deeper correction toward 1.1200 or lower.
6️⃣ Summary & TradingView Idea
This CHF/USD 4-hour chart presents a high-probability bullish setup based on a Double Bottom reversal at a strong support zone. The key confirmation level to watch is 1.1350 - 1.1400, which, if broken, will likely push the price toward 1.1500 - 1.1550.
Entry: Buy above 1.1350 or after a breakout retest.
Stop Loss: Below 1.1138 to avoid false breakouts.
Take Profit: First target at 1.1450 - 1.1500, extended target at 1.1550.
This setup provides a favorable risk-to-reward ratio, making it a strong potential trading opportunity. However, traders should always wait for confirmation signals before entering a position. 🚀

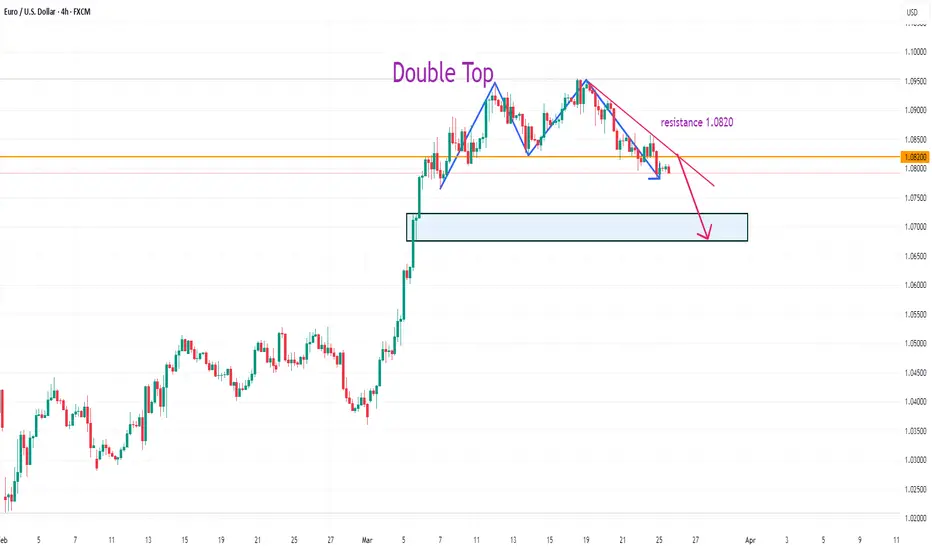
EURUSD SELL 1.0820 Double TOP On the 4-hour chart, EURUSD formed a double top pattern and then fell back, with short-term bears taking advantage. At present, attention can be paid to the resistance near 1.0820. If the rebound is blocked, short selling can be considered. Pay attention to the 1.0676-1.0720 area below.
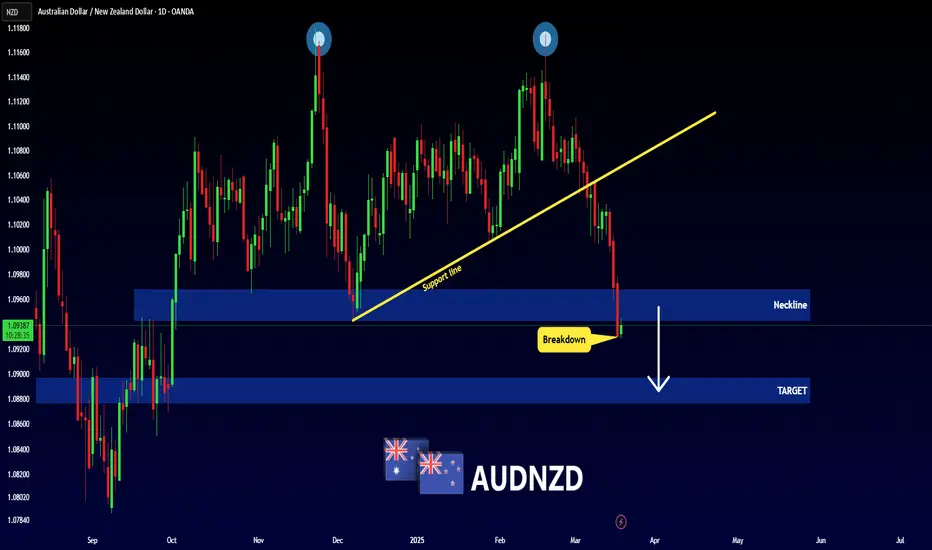
AUDNZD - Bearish Double TOPHello Traders !
The AUDNZD failed to create a new higher high !
The price formed a double TOP pattern.
Currently, The neckline is broken !
So, I predict a bearish move📉
_____________
TARGET: 1.08970🎯
EURUSD: ShortThis is a relatively standard double top pattern. The possibility of a decline after a small rebound is higher, so shorting is recommended.

EURJPY - Double Bottom Breakout & RetestIn today's video we're looking at a secondary opportunity to enter a double bottom.
A double bottom is a classic price action pattern where tests & holds a level twice before reversing in the opposite direction calling for the end of the trend.
In this opportunity, price has confirmed the double bottom by breaking and closing above the peak & now we're looking at a secondary opportunity to get involved by breakout and/or pullback.
If you have any questions or comments please leave them below and I wish you guys an excellent week of trading.
Akil

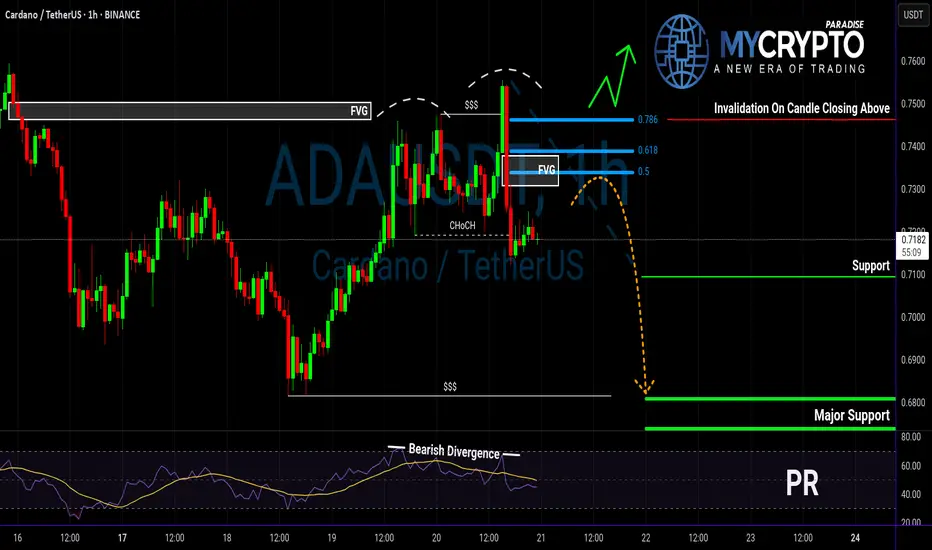
ADAUSDT Flashing Bearish Signals – Is a Drop Incoming?Yello, Paradisers! Are we about to see a strong rejection on ADAUSDT? Let’s break it down.
💎ADAUSDT has filled the Fair Value Gap (FVG) and formed a double top with bearish divergence. Notably, the right top is slightly above the left, signaling a liquidity grab. Following this, we’ve seen a Change of Character (CHoCH) to the bearish side, increasing the probability of a downside move.
💎If ADAUSDT retraces from this level, it will strengthen a high-probability bearish setup from the 1-hour FVG, where the 0.5 Fibonacci level aligns—offering an attractive risk-to-reward (RR) opportunity for shorts.
💎However, if price breaks and closes above the 0.786 Fibonacci level, our bearish outlook will be invalidated. In that case, it would be best to step back and wait for stronger confirmation before taking action.
🎖 Patience and discipline win the game, Paradisers! Don’t chase—wait for the best setups and protect your capital like a pro.
MyCryptoParadise
iFeel the success🌴
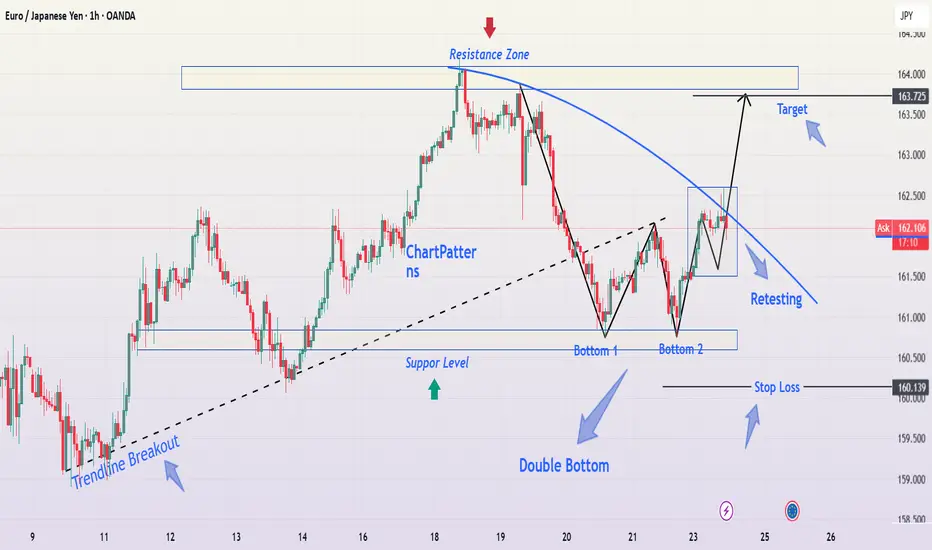
EUR/JPY – Double Bottom Breakout & Trendline Retest, Trade Setup📊 Chart Type: 1-Hour (H1)
💹 Asset: EUR/JPY
📈 Technical Patterns: Double Bottom, Trendline Breakout, Retest
📌 Overview of the Chart
The EUR/JPY chart showcases a bullish reversal setup, characterized by a Double Bottom pattern, a trendline breakout, and a successful retest. This combination suggests a potential continuation towards higher price levels, making it an ideal setup for traders looking for breakout entries.
The price action initially followed a downtrend, but buyers stepped in at key support zones, leading to the formation of a strong reversal pattern. Now, the price is testing a key resistance level, and if it breaks out, we could see a significant upward move.
🟢 Key Technical Analysis Breakdown
1️⃣ Double Bottom Formation – A Bullish Reversal Signal
🔹 The Double Bottom is a classic reversal pattern that forms after an extended downtrend.
🔹 In this case, price found strong support at 160.139, forming two lows (Bottom 1 & Bottom 2), indicating buyer dominance.
🔹 The confirmation of the pattern comes with a break above the neckline at around 162.000, suggesting a shift from bearish to bullish momentum.
2️⃣ Trendline Breakout & Retest
🔹 A descending trendline had been acting as dynamic resistance, pushing prices lower.
🔹 Recently, the price broke above the trendline, signaling a potential trend shift.
🔹 Now, price is retesting the trendline, which is a key factor in confirming whether the breakout is valid.
🔹 If the retest holds, it could trigger a strong bullish move towards the next resistance zone.
📍 Support & Resistance Zones
🔹 Support Level (160.139):
The lowest point in the chart, where price tested twice and formed the Double Bottom.
Buyers stepped in aggressively at this level, preventing further decline.
Stop Loss Placement: Below this support zone for long trades.
🔹 Resistance Zone (163.725 - Target Level):
The previous swing high and a major supply zone.
A breakout above this area could lead to further bullish momentum.
📈 Trading Strategy – How to Trade This Setup?
✅ Bullish Trade Setup (Breakout & Retest Confirmation)
This setup is ideal for traders looking to capitalize on breakout and retest strategies.
📌 Entry:
Wait for a strong bullish candle to confirm the retest of the trendline.
A break above the 162.500 level could be a good entry confirmation.
📌 Target:
First target: 163.725 (Resistance Zone).
If momentum continues, the next upside target could be around 164.500.
📌 Stop Loss:
Below 160.139 (previous support level) to minimize risk.
Alternatively, place it below the trendline retest zone if entering aggressively.
📌 Risk-to-Reward Ratio (RRR):
This trade offers a strong RRR, as the downside risk is limited, while the upside potential is higher.
🔴 Bearish Scenario – What if the Retest Fails?
While the bias is bullish, traders must be prepared for a fake breakout scenario. If price fails to hold above the trendline and neckline, the structure might break down.
📌 Bearish Entry:
If price rejects the retest zone and closes back below 161.500, it could indicate a false breakout.
📌 Target:
160.139 (Support Level).
📌 Stop Loss:
Above the trendline retest zone to protect against unexpected bullish moves.
🔎 Key Takeaways & Final Thoughts
✅ The Double Bottom pattern signals a potential trend reversal.
✅ The trendline breakout & retest adds further confirmation to the bullish bias.
✅ A breakout above 162.500 could accelerate buying pressure toward 163.725.
✅ Risk management is essential: A well-placed stop loss below the support level ensures minimal downside risk.
✅ If price rejects the retest zone, traders should be prepared for a possible bearish reversal.
📌 Overall Bias: Bullish ✅
📌 Trade Confirmation: Needs trendline retest hold + bullish breakout 📈
📌 Key Level to Watch: 162.500 (Breakout Confirmation Zone) 🔥
💡 Pro Tip : Always wait for confirmation before entering a trade. A strong bullish candlestick pattern (e.g., engulfing candle) on the H1 or H4 timeframe could provide extra confidence in the setup! 🚀
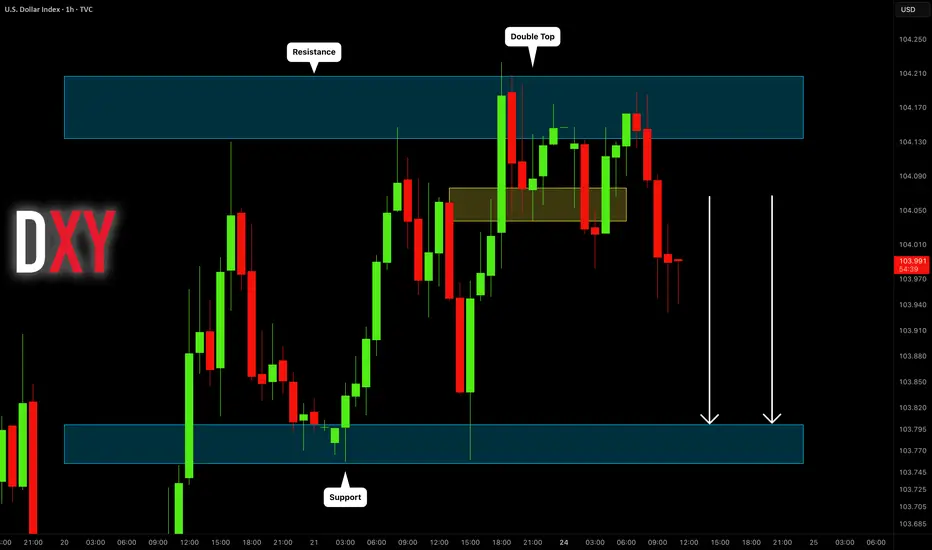
DOLLAR INDEX (DXY): Bearish Outlook Explained
Dollar Index is currently consolidating within a range on intraday time frames.
Testing its upper boundary, the market formed a double top pattern.
With a strong bearish mood after the opening, the market is going
to drop lower.
Goal - 103.8
❤️Please, support my work with like, thank you!❤️
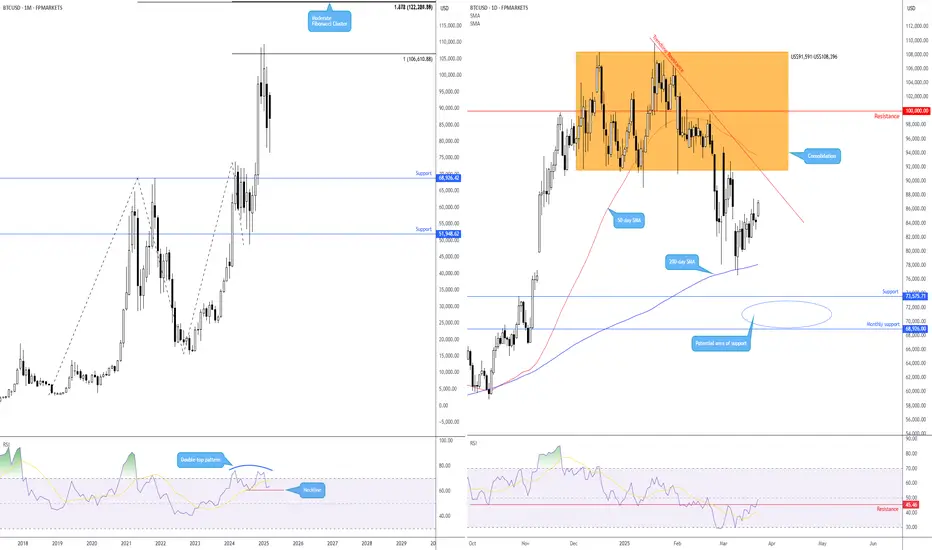
‘Cagey’ Rebound on BTC/USD?Since BTC/USD (Bitcoin versus the US dollar) rebounded from the 200-day simple moving average (SMA) earlier this month at US$78,111, speculative bullish interest has been uninspiring.
Further Downside
As far as I can see, the major crypto pairing demonstrates scope to continue exploring south until it reaches support from US$68,926 on the monthly timeframe (I also noted this in previous analysis), which (somewhat) helps explain why technical demand from the 200-day SMA could be lacking.
Another technical observation supporting the lacklustre bullish showing is the Relative Strength Index (RSI), recently exiting overbought territory and fast approaching the neckline of a double-top pattern on the monthly chart, extended from the low of 60.44. A break beyond this line highlights the RSI’s 50.00 centreline threshold as a possible downside target. Adding to this, the RSI on the daily chart may have rebounded from oversold territory (forming a possible double-bottom), but remains south of 50.00 and is shaking hands with resistance around 45.46.
Monthly/Daily Support Area Warrants Attention
While I am not saying that a move to the upside won’t be seen, the path of least resistance appears to be to the downside, at least targeting space below the 200-day SMA at daily support from US$73,575. So, for me, the playbook here will be watching for possible fading opportunities at the underside of the daily range between US$108,396 and US$91,591 (which happens to converge closely with the 50-day SMA at US$93,608 and trendline resistance, extended from the all-time high of US$109.580). Alternatively, we could see price sell-off at current levels and aim for the noted daily support. It is this level, coupled with monthly support mentioned above at US$68,926, that I expect to see bulls attempt to make a show.
Written by FP Markets Market Analyst Aaron Hill
LOW RISK ETH SHORTSimply hopped into an ETH Short at around 11;15 pm EST
about a 40 pip SL @ $2,580
Looking for a 1:4 or 1:5
TP 1 : 2,487
TP 2 : 2,420
TP 3 : 2,355
If you can handle volatility hold till possible $2,100 or below!
Always good to scale in and out protecting your capital EFFICIENTLY!
Let's Get it PPFX Fam! Peace

Mon 24th Mar 2025 AUD/USD Daily Forex Chart Sell SetupGood morning fellow traders. On my Daily Forex charts using the High Probability & Divergence trading methods from my books, I have identified a new trade setup this morning. As usual, you can read my notes on the chart for my thoughts on this setup. The trade being a AUD/USD Sell. Enjoy the day all. Cheers. Jim

12/12/24 - Here is a new SELL breakout chosen by a completely ru12/12/24 - Here is a new SELL breakout chosen by a completely rules based, mechanical trading system:
Stop Loss @ 118.41
Entry SELL @ 112.80
Target Profit @ 97.57
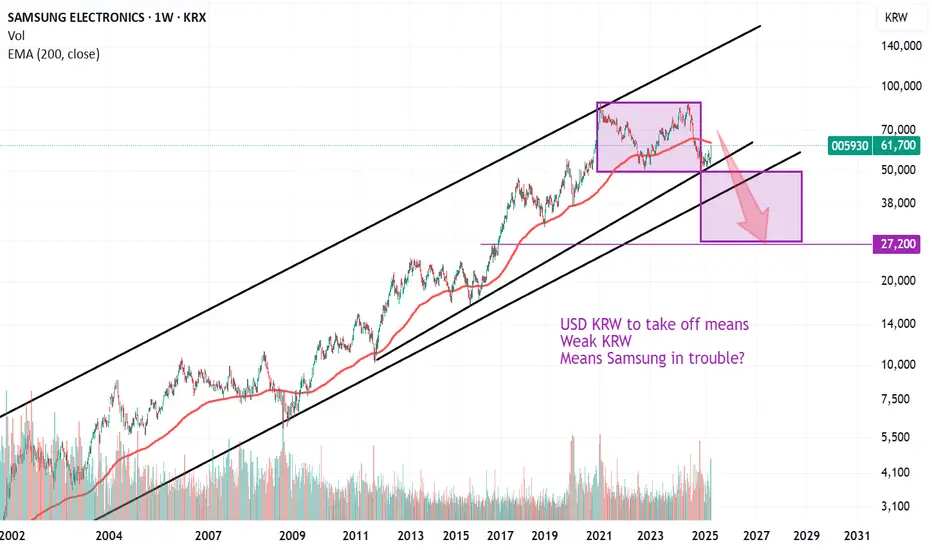
Samsung to move lower, confirm double top and break channel?Bearish for Samsung
Possible double top in place
Also implies that USDKRW would move higher as Samsung fails hence Samsung is mostly the KRW currency.
As global equity indices roll over in 2025 this could move lower
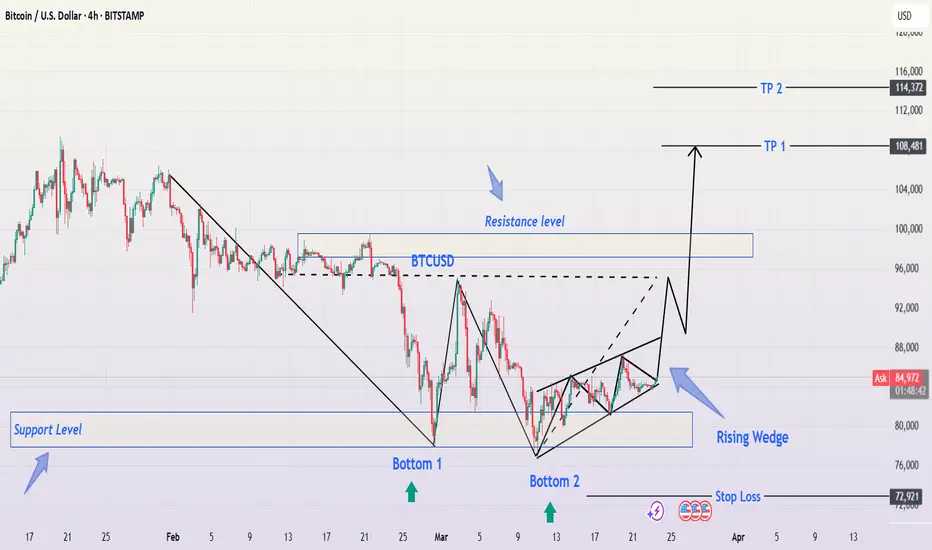
BTC/USD Trading Analysis – Double Bottom & Rising Wedge BreakoutThis BTC/USD 4-hour chart showcases a potential bullish breakout setup based on technical patterns, key support and resistance levels, and price action analysis. The chart suggests a trend reversal following a downtrend, with signs of bullish momentum building up.
Let's break down the full technical analysis, covering the chart structure, key levels, price patterns, and trading strategy.
1. Market Structure & Identified Patterns
A. Double Bottom Reversal – Strong Bullish Signal
A double bottom pattern has formed, which is a bullish reversal signal that indicates the end of a downtrend.
This pattern consists of two significant low points (Bottom 1 and Bottom 2) near the $80,000 - $81,000 support zone.
The pattern confirms strong buying interest at this level, preventing further price drops.
A breakout above the resistance level would confirm the pattern’s validity, signaling a move toward higher targets.
B. Rising Wedge Formation – Potential Bullish Breakout
The price action is consolidating in a rising wedge, forming higher highs and higher lows within a narrowing range.
A rising wedge often suggests a potential breakout.
Since this wedge forms after a double bottom, the breakout is expected to be bullish, rather than a bearish breakdown.
If the price breaks above the wedge’s upper trendline, it will confirm a strong upward momentum.
2. Key Support & Resistance Levels
Support Levels:
Major Support Zone (80,000 – 81,000):
This level has been tested twice, confirming buyer strength.
It serves as the foundation for the double bottom pattern.
Stop Loss Level (72,921):
If the price drops below this level, it would invalidate the bullish setup.
This level is strategically placed to manage risk and protect against potential downturns.
Resistance Levels:
First Resistance Zone (95,000 – 100,000):
This is a critical level, as the price has faced multiple rejections here.
A breakout above this zone would confirm a strong bullish trend continuation.
Take Profit Targets:
TP1 (108,481): The first take-profit target aligns with previous highs and is a logical point for partial profit booking.
TP2 (114,372): This is the second profit target, calculated based on Fibonacci extensions and historical price movements.
3. Trading Strategy & Execution Plan
A. Entry Strategy
To execute a successful trade, we need to wait for confirmation of the breakout.
Ideal Entry: After a strong breakout above 95,000 – 100,000, indicating bullish momentum.
Confirmation Factors:
Increased trading volume → Signals strong buying interest.
Candle close above resistance → Confirms breakout.
Retest of broken resistance as support → Strengthens bullish continuation.
B. Risk Management
Stop Loss Placement: Below 72,921, ensuring limited downside risk.
Risk-to-Reward Ratio: The trade setup aims for a 1:3 or better risk-to-reward ratio.
C. Potential Scenarios
✅ Bullish Breakout:
If BTC breaks and holds above 95,000 – 100,000, we can expect a rally toward 108,481 (TP1) and 114,372 (TP2).
❌ Bearish Rejection:
If BTC fails to break resistance, it could retest 80,000 or drop lower, invalidating the bullish setup.
4. Final Thoughts – What to Expect?
This BTC/USD 4-hour chart analysis provides a high-probability bullish trade setup, supported by:
✅ Double Bottom Formation → Strong Reversal Signal
✅ Rising Wedge Breakout Potential → Momentum Building
✅ Key Resistance Breakout Levels Identified
📌 Conclusion:
If Bitcoin breaks above 95,000 – 100,000, expect a major bullish move toward 108,481 and beyond. However, if resistance holds, we might see a retest of lower support levels. Risk management is essential for a successful trade execution. 🚀
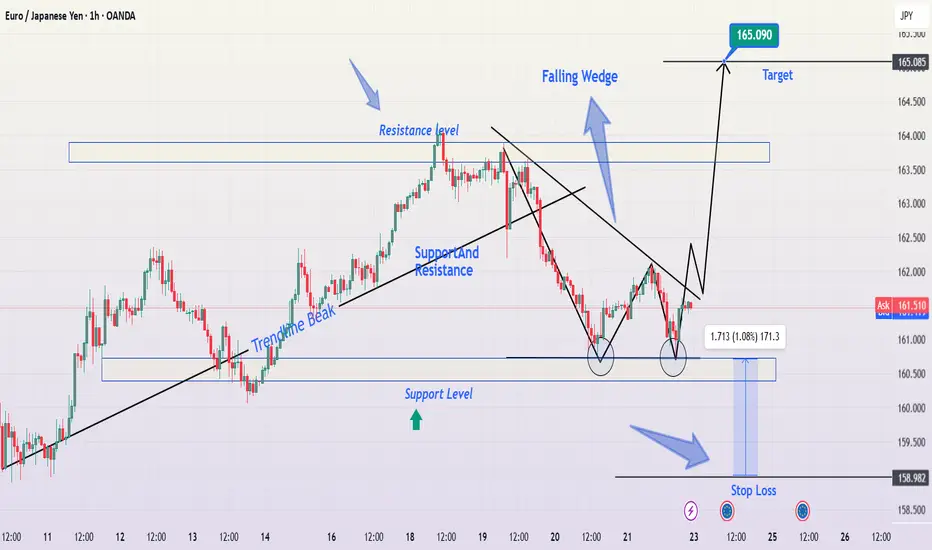
EUR/JPY Chart Analysis - Falling Wedge Target with Bullish SetupThis EUR/JPY 1-hour chart reveals a well-defined falling wedge pattern, which is a bullish reversal formation. Additionally, we see key support and resistance levels, a double bottom, and a breakout potential that traders can use to plan an entry. Let’s dissect this chart in a professional and detailed manner to understand the trade setup and market psychology.
🔹 Market Trend & Structure Analysis
The market was previously in an uptrend, making higher highs and higher lows, until it faced strong resistance at the 163.500 level. Upon reaching this zone, the price reversed downward, forming a series of lower highs and lower lows, which resulted in a falling wedge pattern.
This downward movement was accompanied by a trendline break, signaling a shift in momentum. The price has since reached a strong support level and is showing signs of potential bullish reversal.
🔹 Key Technical Patterns & Indicators
1️⃣ Falling Wedge Pattern (Bullish Reversal Signal)
A falling wedge is a pattern characterized by two downward-sloping trendlines that converge, indicating that selling pressure is weakening. This pattern is considered a bullish signal because:
✔️ The declining price movement shows exhaustion of sellers.
✔️ Volume typically decreases as the wedge forms, indicating a breakout is coming.
✔️ Once price breaks out of the wedge, a strong bullish move often follows.
The key here is to wait for a breakout above the upper trendline, which will confirm the bullish momentum.
2️⃣ Double Bottom Formation at Support (Reversal Confirmation)
The price tested the 160.500 support level twice, forming a double bottom pattern. This is another bullish sign, as it indicates:
✔️ Buyers are actively defending this level.
✔️ There’s strong demand around this price zone.
✔️ If price breaks above the wedge resistance, it could trigger a significant rally.
🔹 Key Support & Resistance Levels
Identifying support and resistance is crucial for defining entry and exit points.
✅ Support Levels:
160.500 – Strong horizontal support (Price tested this twice).
158.982 – Stop-loss level (Below this, the bullish setup is invalid).
✅ Resistance Levels:
163.500 – Major resistance (Previous high and supply zone).
165.090 – Final target (Key breakout level).
If the price successfully breaks out of the wedge, it has room to rise significantly, with 163.500 as the first target and 165.090 as the ultimate goal.
🔹 Trade Setup & Execution Plan
🎯 Bullish Breakout Trade Strategy
Since this setup signals a potential reversal, here’s how traders can execute a high-probability trade:
🔹 Entry Points:
✅ Aggressive Entry: Enter as soon as price breaks above the wedge resistance.
✅ Conservative Entry: Wait for a breakout and a retest of the resistance-turned-support before entering.
🔹 Target Levels:
🎯 First target: 163.500 (Previous resistance level).
🎯 Final target: 165.090 (Major resistance zone).
🔹 Stop-Loss Placement:
❌ Place the stop loss below 158.982, as a break below this level would invalidate the bullish setup.
🔹 Risk-Reward Ratio & Trade Justification
📈 Why This Trade Has a High Potential Reward?
Low-risk, high-reward: The stop loss is tight, while the upside potential is large.
Confluence of bullish signals: Falling wedge + Double bottom + Strong support.
Institutional interest likely: Buyers are stepping in at key levels.
A proper risk-to-reward ratio (RRR) for this trade would be at least 1:3, meaning for every 1% risk, there’s a 3% profit potential. This makes it a great swing trading setup.
🔹 Market Psychology Behind the Setup
The falling wedge represents a market correction after a strong bullish trend.
The double bottom shows that sellers are exhausted and buyers are gaining control.
If price breaks out, many traders will enter, triggering a strong upward rally.
This bullish breakout setup aligns with the smart money concept, where institutions accumulate positions before a big move.
🔹 Final Thoughts & Trade Outlook
This EUR/JPY setup presents a high-probability trade opportunity with a bullish breakout scenario. The combination of:
✅ Falling Wedge Pattern (Bullish reversal)
✅ Double Bottom at Support (Buyers stepping in)
✅ Key Resistance Targets (Clear trade exit points)
…creates a great trading setup.
📌 Trading Plan Summary:
✔️ Buy on breakout above the falling wedge.
✔️ Target 163.500 & 165.090 for profits.
✔️ Stop-loss below 158.982 for risk management.
🚀 If executed correctly, this trade has the potential for strong bullish momentum. Would you like a real-time update once the price confirms the breakout? Let’s keep an eye on this trade! 📊🔥