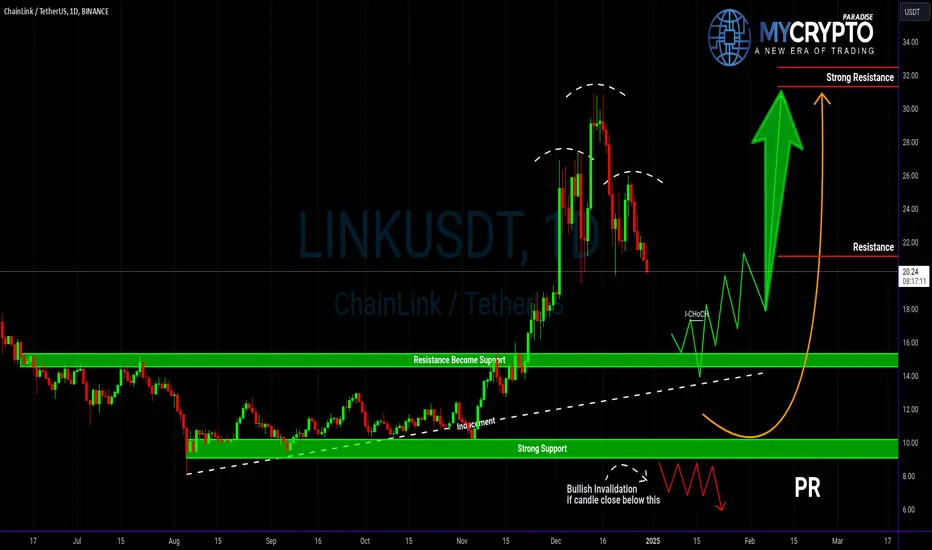
LINKUSDT: Bullish Setup or Breakdown Ahead?Yello, Paradisers! Could this head & shoulders structure spell trouble for LINKUSDT? Or is the market setting up for a bullish reversal?
💎LINKUSDT appears to be showing signs of a retracement due to its head and shoulders pattern. If the price retraces to the identified support zone and presents a bullish I-CHoCH, W-pattern, or inverse head and shoulders on lower timeframes, the probability of a significant bullish move increases.
💎However, if the price drops further to sweep below the current zone (inducement), it’s prudent to wait for confirmation at the strong support zone. Although reaching this level might seem unlikely, if the price does drop, it would strengthen the likelihood of a bullish rebound. In this case, watch for bullish patterns such as I-CHoCH, W-patterns, or inverse head and shoulders to form before taking any action.
💎On the flip side, if a breakdown occurs and the candle closes below the strong support zone, this would invalidate our bullish outlook. In such a scenario, patience will be key—waiting for better price action and clearer market structure before considering the next move.
🎖 As always, the disciplined and patient approach wins in this market. Stick to the plan, follow the confirmations, and trade smart, Paradisers!
MyCryptoParadise
iFeel the success🌴
Double Top or Bottom
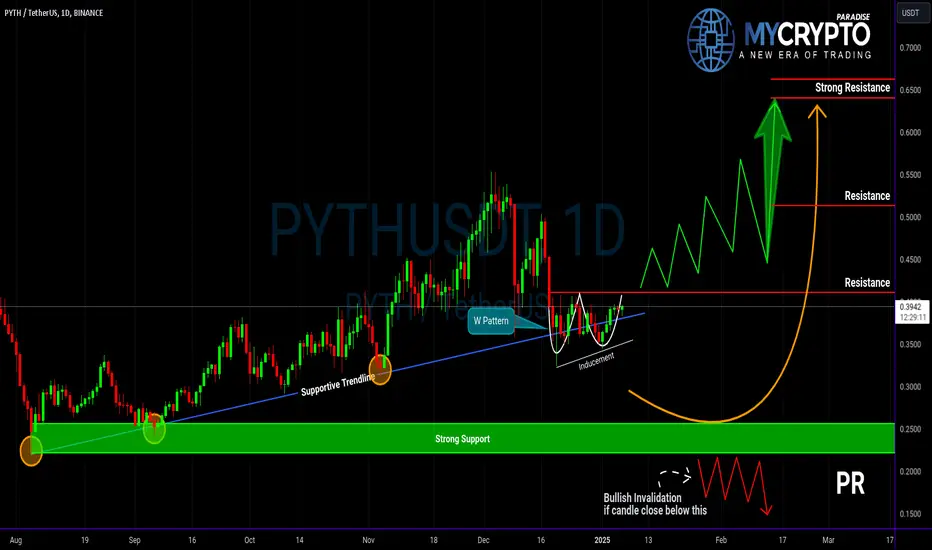
Is PYTHUSDT About to Explode or Break Down?Yello, Paradisers! PYTHUSDT is shaping up nicely after forming a W pattern at a key supportive trendline. But the real question is—will the price hold and push upward, or is a breakdown lurking just around the corner? Let’s break down the critical levels and scenarios you need to watch closely.
💎If PYTHUSDT breaks above the resistance level and closes a candle above it, the odds of a bullish move increase significantly. This breakout would confirm the W pattern, signaling potential upside momentum.
💎There's still a risk that PYTHUSDT could retrace further before any bullish breakout happens. If the price drops lower, it could be a liquidity grab (inducement) to shake out weaker hands before bouncing from the strong support zone.
💎In that case, it’s better to wait for the retracement to play out and then look for a bullish reaction from the strong support zone before taking any action.
💎Now, here’s the worst-case scenario: if PYTHUSDT breaks below the strong support zone and closes a candle beneath it, the bullish structure will be completely invalidated.
💎In this case, it’s better to stay patient and wait for a clearer price structure to form before re-entering any positions. Never chase the trade—we wait for the highest probability setups to align.
🎖 Remember, patience is key in trading! The market will always provide opportunities, but it’s the disciplined traders who capitalize on them. Stay focused on key levels, wait for confirmations, and don’t get caught by false moves.
MyCryptoParadise
iFeel the success🌴
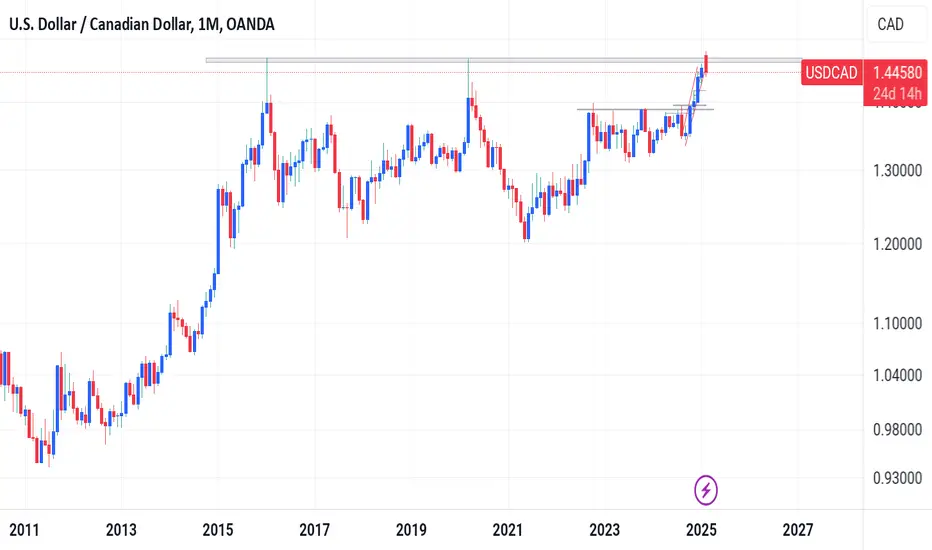
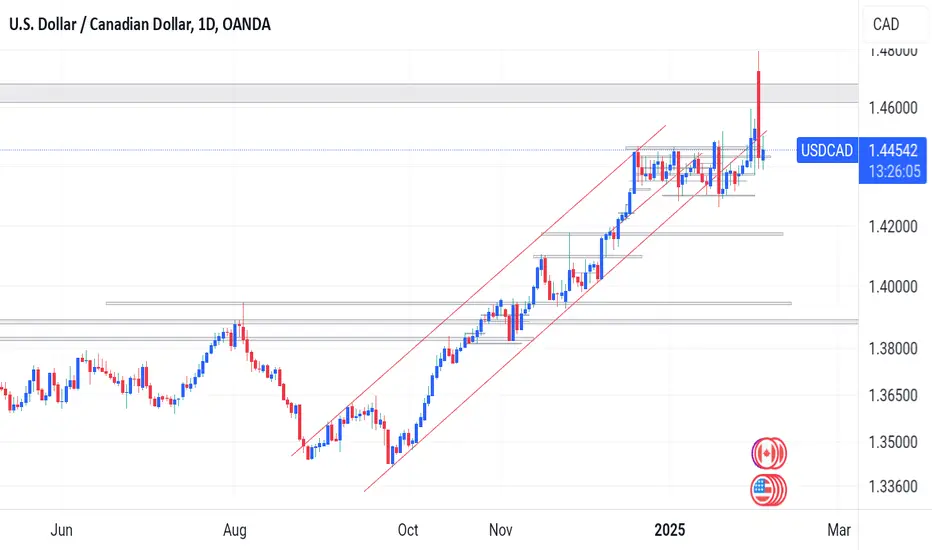
Usdcad Monthly bearish This is a clear and obvious triple high on usdcad
Last week, we patiently waited for a retest on #USDCAD after observing a breakout towards the downside. Now, we have the following indications:
✔ A triple high on the M_Tf timeframe
✔ A retest of the trend
✔ A retest of the bearish pattern
It's time to find your entry point for a potential downside move. This could be a significant opportunity.
Usdcad downside Last week, we patiently waited for a retest on #USDCAD after observing a breakout towards the downside. Now, we have the following indications:
✔ A triple high on the M_Tf timeframe
✔ A retest of the trend
✔ A retest of the bearish pattern
It's time to find your entry point for a potential downside move. This could be a significant opportunity.
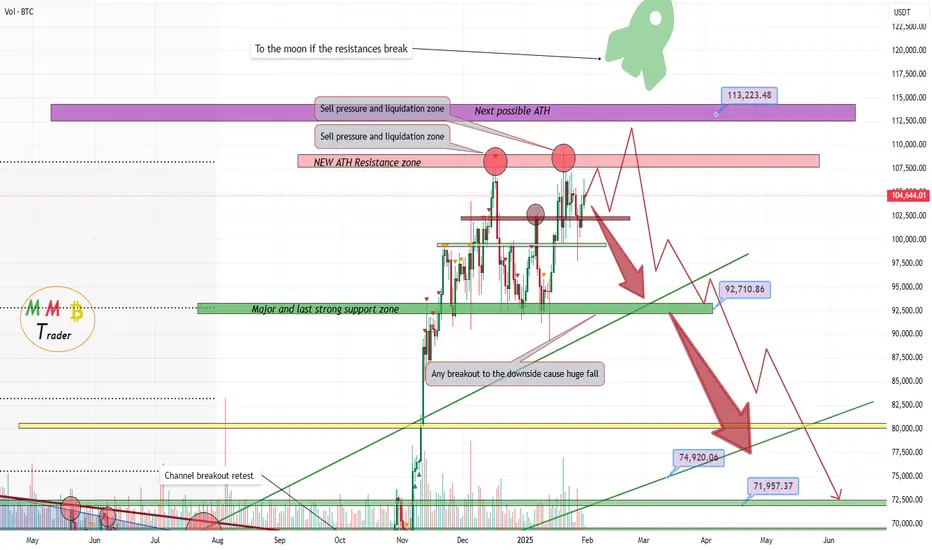
Bitcoin Double Top Forming(Neckline is 92K so wait for breakout)As we can see until now Price test ATH resistance zone Two times and we have Strong support zone near 92K$ so we may have Double Top forming here which is strong Reversal structure and after the neckline support break to the downside this structure is completed and will cause huge dump and fall to the downside like the arrows mentioned on the chart.
Notice: only if the ATH resistance break successfully then this scenario is invalid and price can see more gain to the next possible ATH mentioned on the chart.
DISCLAIMER: ((trade based on your own decision))
<<press like👍 if you enjoy💚
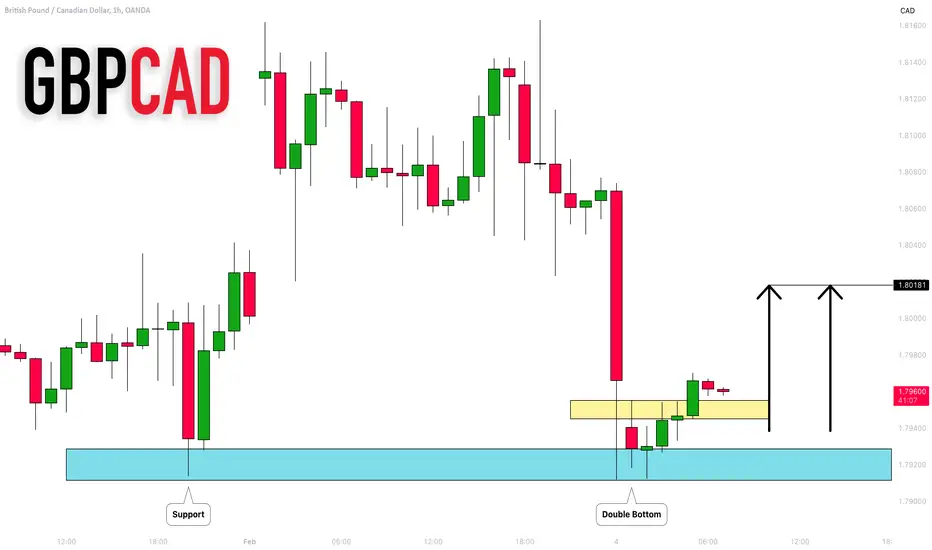
GBPCAD: Pullback From Support 🇬🇧🇨🇦
GBPCAD looks locally bullish after a test of a key horizontal support.
A tiny double bottom pattern on an hourly confirms that.
Target level - 1.8018
❤️Please, support my work with like, thank you!❤️
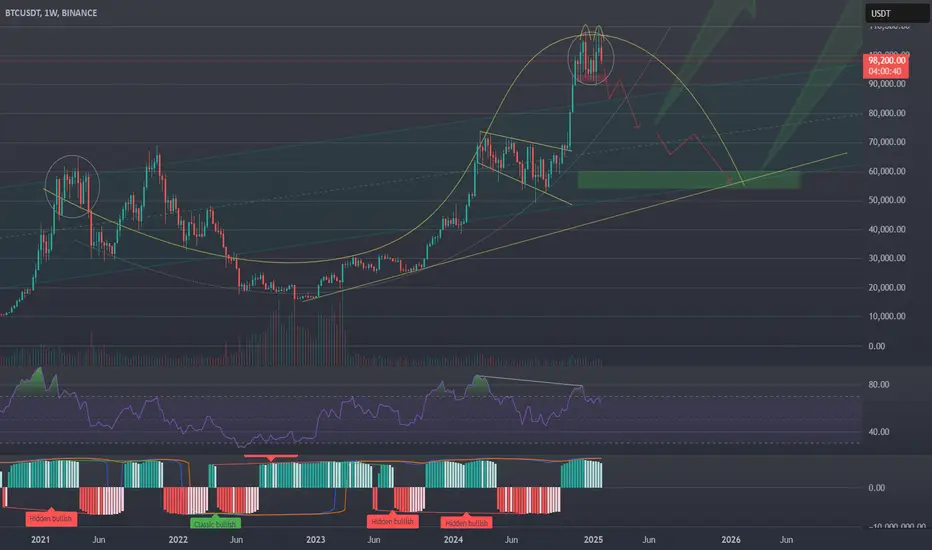
Closing my entire crypto position todayBitcoin prices have been consolidating since December '25 (around 60 days) after multiple failed attempts to continue the uptrend (as indicated by the purple Xs on the chart).
Even though I remain bullish on the asset in the long term, I decided to close all my cryptocurrency positions today and allocate 100% in dollars. From a technical perspective, a double-top pattern has started to form, which is a bearish signal, and I’d rather not risk waiting to see if it gets confirmed or if the asset simply continues moving sideways.
I prefer to watch this consolidation from the sidelines and accept the risk of buying back at a slightly higher price only after a breakout—if it happens. If it doesn’t, closing my positions will have been a successful protective move.
I also acknowledge the formation of a flag pattern near the upper resistance of the range, but again, if it confirms and breaks out, I will re-enter. For now, I’m choosing the more cautious path and prioritizing capital protection.
Part of this position was bought recently, around 100k, speculating on potential euphoria after reaching that price level. Another portion was acquired around 60k in September '24.

New beginning The price has been moving below the daily SMA200 for a year and a half.
All previous attempts to rise above, highlighted by the rectangles, have failed.
In recent weeks, the price has completed a double bottom with a neckline at $1070.
A close above this level confirms the double bottom pattern and positions the price above the 200 average, starting the new bullish cycle.

Doge next moveCould not break previous high and looks like forming double top in daily chart... it should go back 0.136 to 0.14 after touching 0.3... let's Wait...

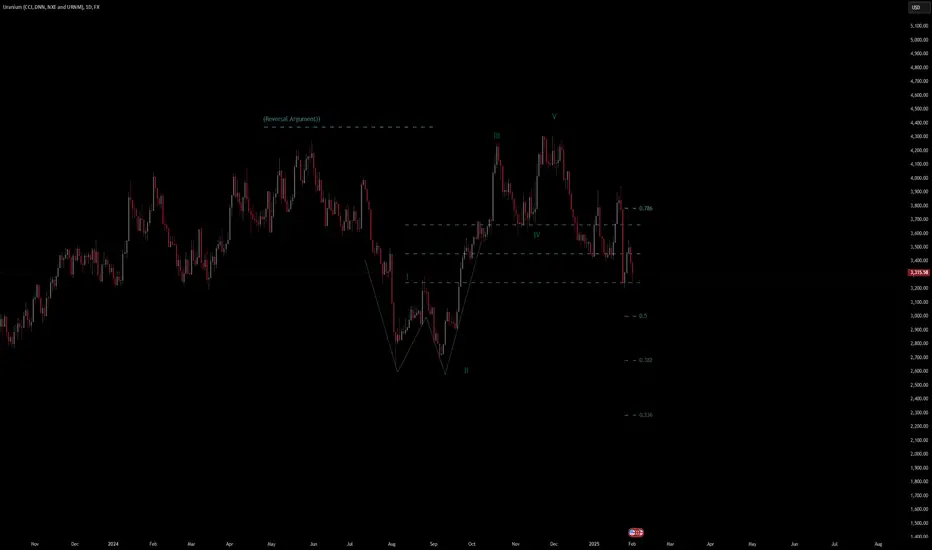
Uranium Commodity Quote | Chart & Forecast SummaryKey Indicators On Trade Set Up In General
1. Push Set Up
2. Range Set up
3. Break & Retest Set Up
Notes On Session
# Uranium Commodity Quote
- Double Formation
* (Reversal Argument)) | Completed Survey & Entry Feature
* 012345 | Wave Count | Subdivision 1
- Triple Formation
* 1st Retracement | Downtrend Bias | Subdivision 2
* 2nd Retracement | Continuation Entry | Subdivision 3
* Daily Time Frame | Trend Settings Condition
Active Sessions On Relevant Range & Elemented Probabilities;
European Session(Upwards) - US-Session(Downwards) - Asian Session(Ranging)
Conclusion | Trade Plan Execution & Risk Management On Demand;
Overall Consensus | Sell
USD/JPY - BullishDouble bottom before trendline was broken. Now retesting trendline and a significant supportlevel at 155.00. Expecting price to move up.

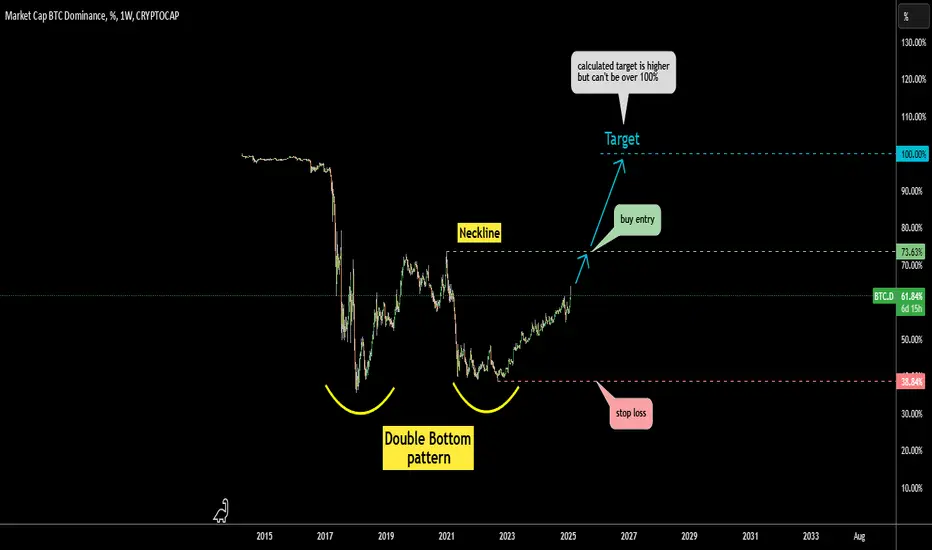
Double Bottom Pattern: Bitcoin Total Domination Last week my post on Bitcoin dominance played out faster than it was expected.
(see related)
This indicator broke out into 60-70% area.
So, I switched to a weekly time frame and spotted a classic reversal pattern called "Double Bottom" in the making for you.
Let's break it down.
We have two bottoms highlighted with yellow arcs in the same area.
Indicator eyes the middle top between bottoms, it is called "Neckline"
Now, let's breakdown buying technique:
1) buy entry is at the breakout above Neckline (green dashed line)
2) stop loss is at the valley of the right bottom (red dashed line)
3) target is located at the depth of the right bottom from the Neckline.
in our case it can't be higher than 100% and is set at the maximum (blue dashed line)
Its amazing that technical analysis could predict things that out of our scope as yet.
Large Bearish idea for current Bitcoin cycle.On the Daily chart very noticeable Double Top ~$107k. Certainly, short term move towards 93k. Afterwards probably the decision to make that will change the outlook of the next 1-2 years.
$85-86k could mean as first support. Then with the break of it, reaching low 70s and high $60s (~530 day downtrend will be near complete). If it were to continue tumble close to $55k (which I don't think it will), I am personally not going to hasitate for a long time to grab as much as I possibly can.
I'm convinced we'll be more than alright after this big Bear Trend.
Hedera Daily: Beware of the Bearish Dragon Pattern
In my previous article, I focused on Elliott Wave counts for HBAR.
()
This time, I’ll approach the analysis from a different perspective:
1. **Dragon Pattern**
2. **Weekly Candlesticks**
3. **Parallel Channel**
4. **Oscillator**
5. **Fundamentals**
6. **Key Levels**
7. **Short-term Forecast and My Position**
---
### 1. Dragon Pattern
The Hedera daily chart suggests a bearish “Dragon Pattern” forming. For a reference on a previous Dragon Pattern in Bitcoin, see:
()
---
### 2. Weekly Candlesticks and the Dow Theory on the daily
Overlaying the weekly candlesticks schematically also indicates a clear bearish bias. Unless the weekly candle closes bullish—or at least recovers to 31 cents—the continuation of the downtrend looks very likely. The daily lower-low in the Dow Theory we already have might emphasize the bearish sentiment more.
---
### 3. Parallel Channel
The price has dropped below the yellow line on the diagonal parallel channel. The following likely targets appear to be the light blue or gray lines. Considering this, it seems natural to expect a move toward the green box, although the path may involve some fluctuations.
---
### 4. Oscillator
At the same time, the oscillator values remain at their respective low levels, suggesting a scenario where any downward move might be more gradual than abrupt. However, such a steep decline itself isn't excluded at the extreme of oscillator values.
---
### 5. Fundamentals
From a fundamental standpoint, overall market sentiment is pessimistic, influenced by the DeepSeek shock and U.S. tariff concerns, making a short-term return to optimism seem unlikely. However, from a TA perspective, this aligns with the scenario many have been anticipating. If a decline materializes now, it may reflect the market providing its catalyst.
---
### 6. Key Levels
On the downside, the area near the 23-cent low is almost particular to command attention. I watch around 17.5 cents (the top of the green box). If the price does reach this level, panic selling could spark wicks down into the 15-cent region. Although the bottom of the box is around 12.6 cents—and the likelihood of dropping that far seems slim—long-term HBAR holders like myself would welcome the opportunity.
---
### 7. Short-term Forecast and My Position
As I posted on X (formerly Twitter), I’m currently short 34.5 cents and plan to take profits around 17.9 cents. Since a minor bounce could happen first, I don’t intend to add to my short position at this level. My spot buy orders are scattered from around 24 to 15 cents, illustrating my long-term bullish stance on Hedera.
For a bullish take, feel free to check out my earlier analysis (admittedly a bit optimistic, but I’m confident in the overall movement):
()

ALI in our buying zone , with double bottom , RSI divergenceali has reached in our buying zone , with clear double bottom pattern , rsi divergence .
use 5% of your capital

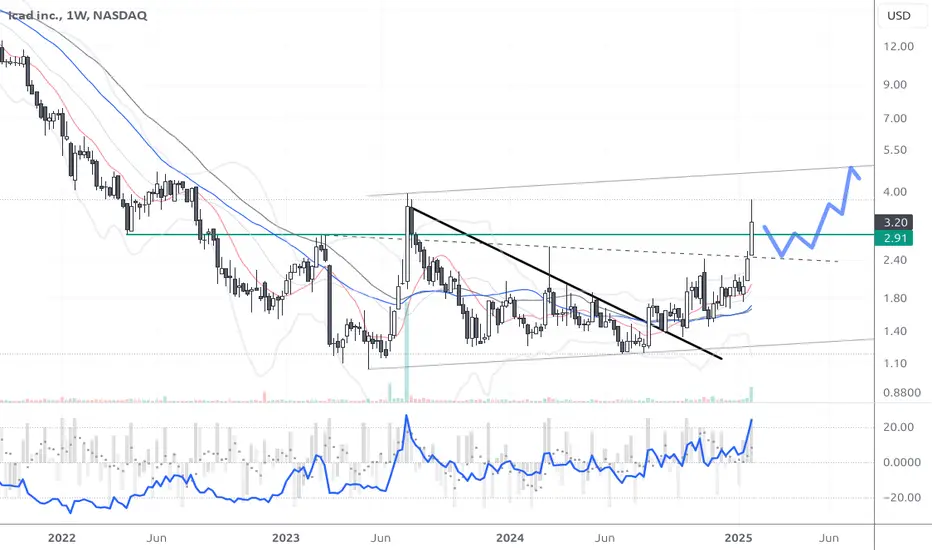
ICAD Long after pullbackWaiting for a pullback. Looking for entries between 2.90 and 2.40.
Trend
Broke out of its base, trading in a confirmed uptrend near its 52-week high.
Price Action
Strong upmove but, with notable regression from recent highs.
Momentum
Very high, rising.
Volatility
High, rising
Volume
Very high
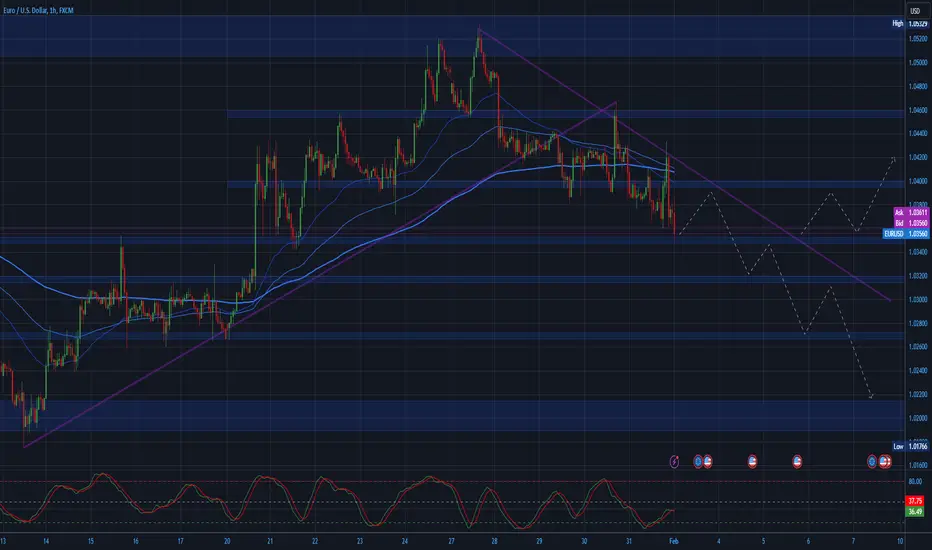
EURUSD (1H) - Bearish Reversal with Double TopOANDA:EURUSD
📶 Technical Analysis:
🟠 From January 13th to January 29th, the market was in a strong bullish trend, with prices steadily moving higher. The trend was supported by consistent higher highs and higher lows.
🟢 Between January 24th and January 28th, a Double Top pattern formed. This is a classic bearish reversal formation that occurs when the price fails to break above a key resistance level, marking two distinct peaks (tops) at roughly the same price level. The failure to surpass the previous high indicates that the buyers are losing momentum and that the market could be turning bearish.
🟢 On January 29th, the trend line was decisively broken, confirming the shift in market sentiment from bullish to bearish. This breakdown is a crucial event, as it suggests that the upward price movement is no longer sustainable, and the market is now in the process of establishing a downward trend.
🟢 Following the break of the trend line, the price started to form lower highs and lower lows, indicating that sellers have gained control of the market. This pattern is typical in a bearish trend, as it shows diminishing buying pressure and an increasing presence of sellers.
🟢 The bearish crossover of the moving averages further solidifies the reversal. Short-term moving averages crossing below longer-term moving averages indicate that the bearish momentum is accelerating. This is often interpreted as a signal to sell or go short, as the market is now in a confirmed downtrend.
🟡 Key support levels along the new trend line will be crucial to monitor. If the price breaks through any of these support levels, the bearish trend is likely to accelerate, leading to further downside potential.
🆕 Fundamental Analysis:
🟢 The US Dollar (USD) continues to strengthen, as the US Dollar Index (DXY) reached a weekly high of 108.35, driven by strong demand for the Greenback as a safe haven.
🟡 President Donald Trump threatened to impose 100% tariffs on BRICS nations and 25% tariffs on Mexico and Canada if they challenge the US Dollar's dominance or attempt to create an alternative currency. This statement could further increase market volatility and impact global trade relations.
🟡 The Fed held interest rates steady on Wednesday and indicated that it will remain in a wait-and-see mode until there’s substantial progress on inflation or weakness in the labor market. This signals a cautious approach in monetary policy.
🟢 The Euro (EUR) continues to weaken amid expectations of easing monetary policy from the European Central Bank (ECB). German CPI data shows inflationary pressures are easing, boosting hopes that the ECB may lower rates in the future.
🔤 Summary:
🟢 The EUR/USD pair remains under pressure due to a combination of factors, including weaker German inflation data and strong US Dollar performance. The pair is expected to maintain a bearish trend, with the focus on potential short positions around the newly formed trend line or key levels of resistance.
🟢 Watch for the trend line or significant resistance zones, as they may offer entry points for short positions if the pair continues to respect the downward trend.
🔴 If the price breaks above the trend line or key resistance, the current bearish analysis will no longer hold. In this case, it would be prudent to wait for further indicators and clear price action formations before taking new positions.
AMZN is looking for an uptrendAMZN hits the target of double top. After reaching the target area, it will form a V-shaped bottom, and if it is maintained, it will form two double bottoms, which makes the stock set for an upward trend.

Colgate-Palmolive close above support forming double bottomNYSE:CL close above support despite earning surprise, volume is also strong. It has lost all the gain in the last year, it looks like an oversold to me. Let’s see if it can form a double bottom next week.

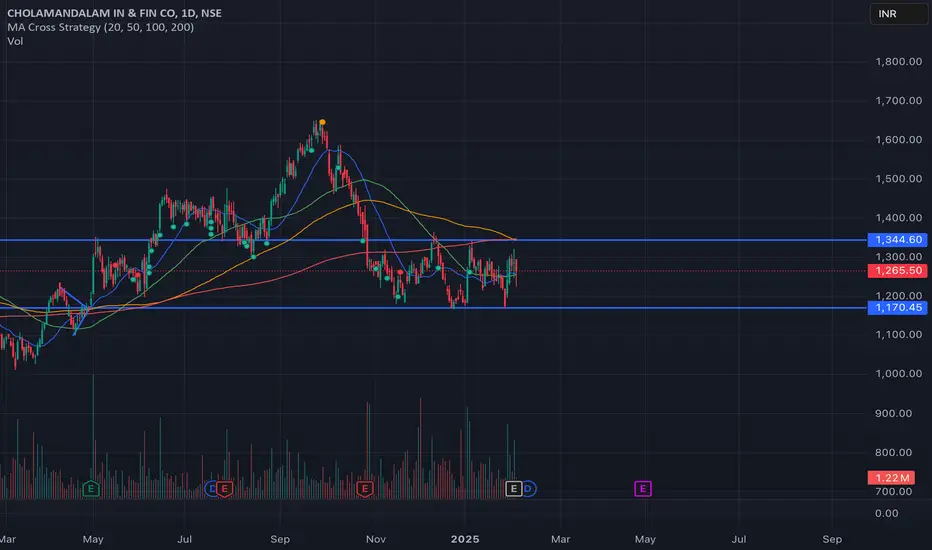
CHOLAFIN - A clear triple bottomCHOLAFIN has formed a clear triple bottom.
Keep this stock in your watch list and watch-out for a break-out with strong volume around the upper blue line. ( Strong resistance)
DALBHARAT - Amazing consolidation!!DALBHARAT has taken a support around ~1720 with a resistance around - 1930!
Will it break 1930 and fly? Keep an eye on this gem!!
DYOR before you invest.

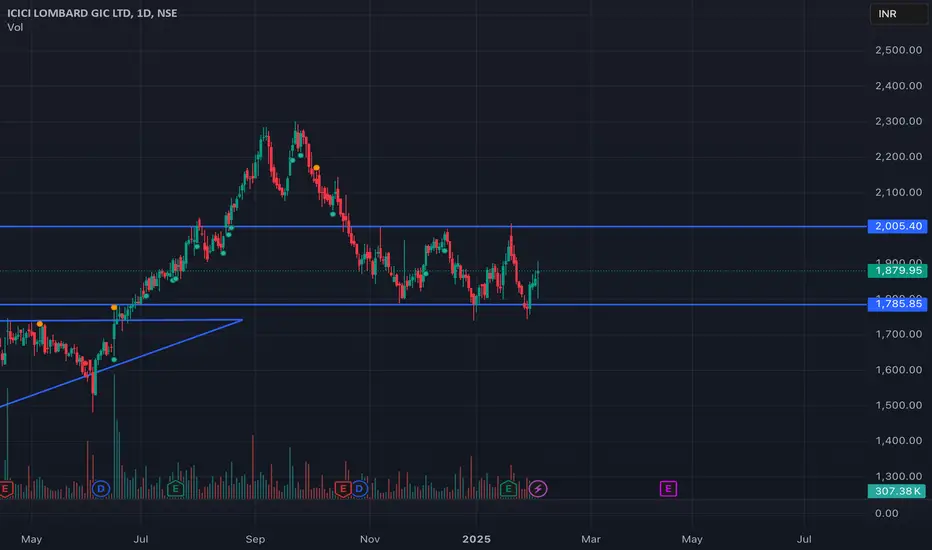
ICICIGI - A comfortable Triple bottom pattern Analysis:
This chart indicates a potential triple bottom pattern, which is a bullish reversal pattern. This pattern typically forms after a downtrend and suggests that the stock may reverse its trend upwards.
Support: The triple bottom is forming around the 17880 level, indicating strong support at this price.
Resistance: The immediate resistance level is around 1,879.95, with a stronger resistance at 2,000.00.
The formation of a triple bottom is a positive sign, but confirmation at resistance through a breakout with high volume is crucial before taking a buy position. Monitor the price action around the resistance levels and moving averages for additional confirmation signals.
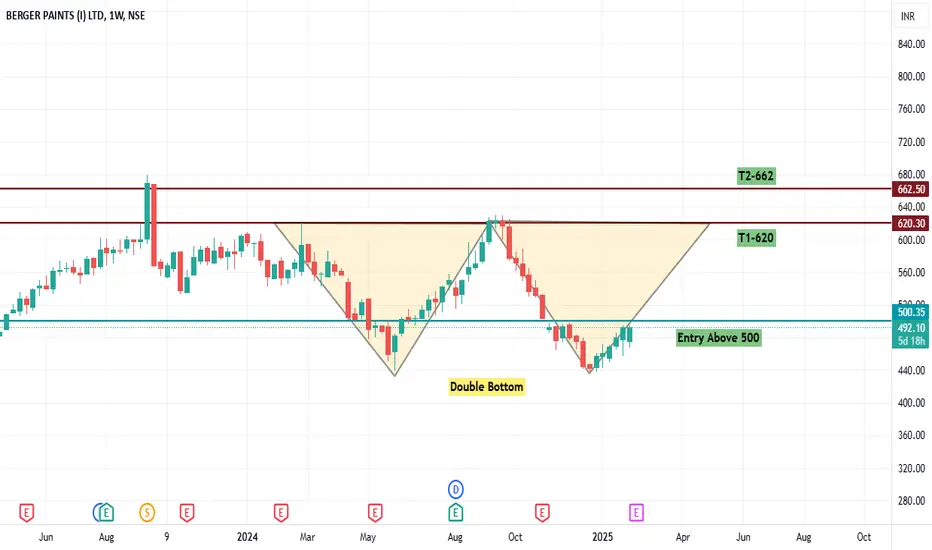
Berger Paints - Double Bottom in ProgressProgressive Double Bottom for Berger Paints
Breakout above 500 can give big targets to 620/662