Can KNX Challenge Resistance with Analyst Support?Trade Summary 📝
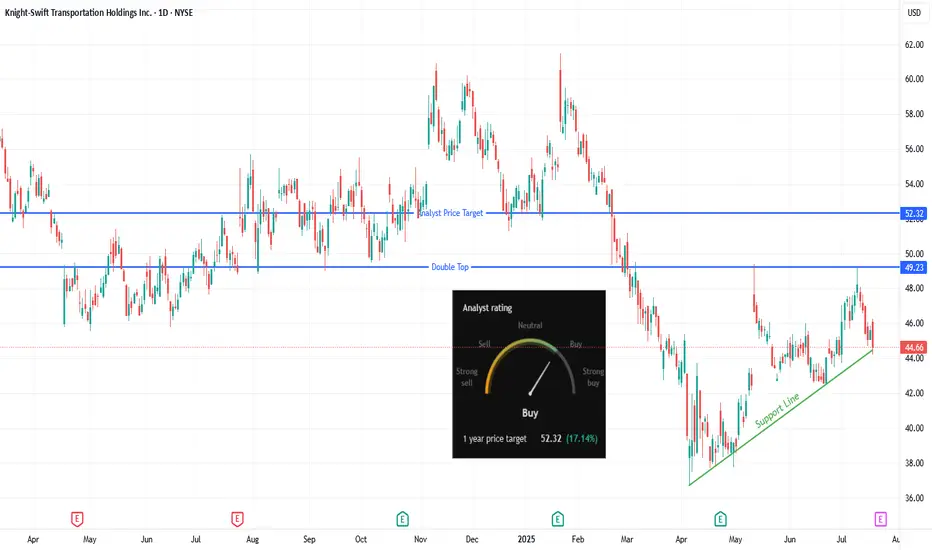
Setup: KNX building higher lows above rising support; testing multi-month resistance zone.
Entry: Watching for long entry on a break above $46.26.
Stop-loss: Below $44.20 (just under trendline support).
Targets: $49 (near double top resistance), $52.32 (analyst price target).
Risk/Reward: Attractive with defined risk and upside to multiple levels.
Technical Rationale 🔍
Rising trendline support shows bulls steadily defending higher.
Price compressing just below a prior pivot/high—breakout could spark new momentum.
Double top at $49 offers a logical first target; further room if bulls push to analyst target at $52.
Catalysts & Context 🚦
Analyst 1-year price target sits at $52.32 (+17%), with a “Buy” consensus rating.
Trucking/transport sector showing signs of rotation after long weakness.
Upcoming earnings and macro data could act as catalysts for a move.
Trade Management Plan 📈
Entry: On confirmed break and close above $46.26.
Stop-loss: Just below $44.20 support.
Scaling: Trim at $49 (double top area); hold runners for $52.32 if momentum continues.
What’s your move on KNX?
🔼 Bullish—Breakout incoming
🔽 Bearish—Resistance will hold
🔄 Waiting for confirmation
*** Follow us now to ensure you don't miss the next big setup ***
Disclaimer ⚠️: Not financial advice. Trade at your own risk and always use stops.
Double Top or Bottom
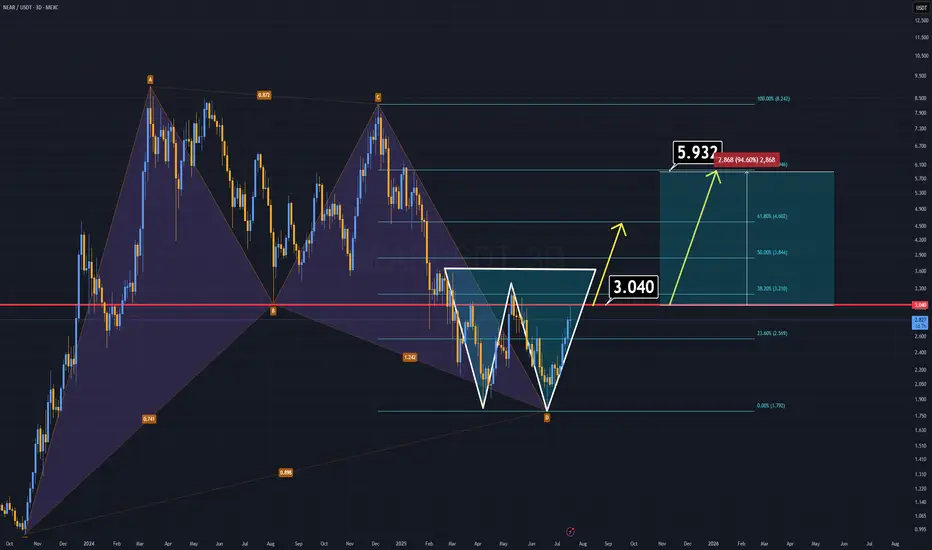
NEAR ANALYSIS (3D)NEAR Protocol has formed two strong bullish patterns and looks ready to climb, especially with the highly anticipated altseason on the horizon.
🔹 A harmonic structure from the previous cycle remains intact.
🔹 A double bottom formation is now clearly developing.
If NEAR manages to close a daily candle above the $3 level, we could see the price double in the short term.
On the fundamental side, NEAR is preparing for a vote to reduce its inflation rate. If the proposal passes, the circulating supply will decrease, potentially triggering a strong bullish run. As a leading AI-focused project, NEAR could spearhead the next wave of AI-related gains in the market.
(Read here for details):
www.near.org
All technical and fundamental signs point upward.
Thanks for reading.
EUR/JPY – Double Top with RSI Divergence (Bearish Setup)Technical Analysis (Short Trade Idea)
EUR/JPY is forming a textbook double top pattern with notable bearish signals:
First top: 173.242
S econd top: 173.111 (lower high, indicating weakening bullish pressure)
Neckline: 171.650 – key support level, potential breakdown trigger
RSI divergence: Bearish divergence observed as RSI prints lower highs while price forms nearly equal tops, signaling momentum loss
This structure suggests a potential reversal from recent highs. A short opportunity may arise if price breaks below the neckline at 171.650 with confirmation.
Trade Setup
Sell Stop: 171.650
Stop Loss: 173.148
Take Profit 1: 170.180
Take Profit 2: 168.642

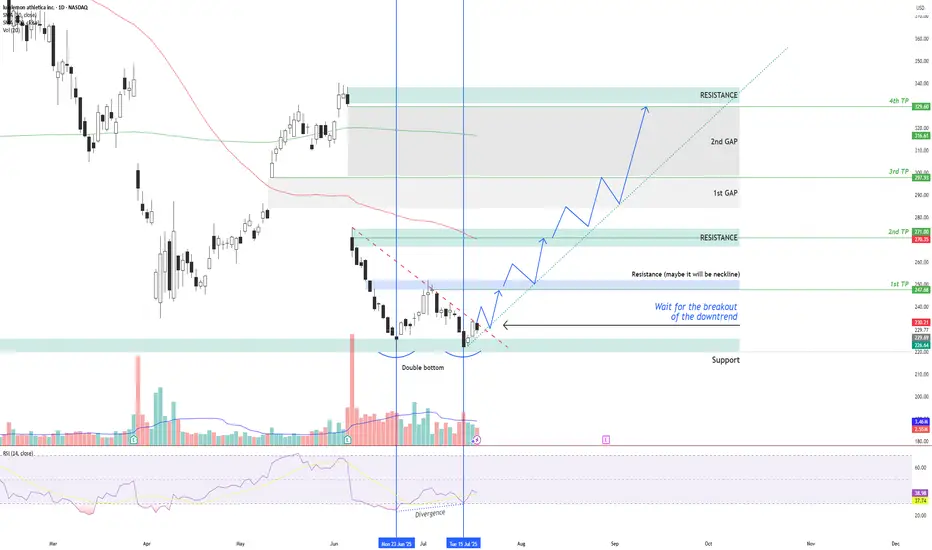
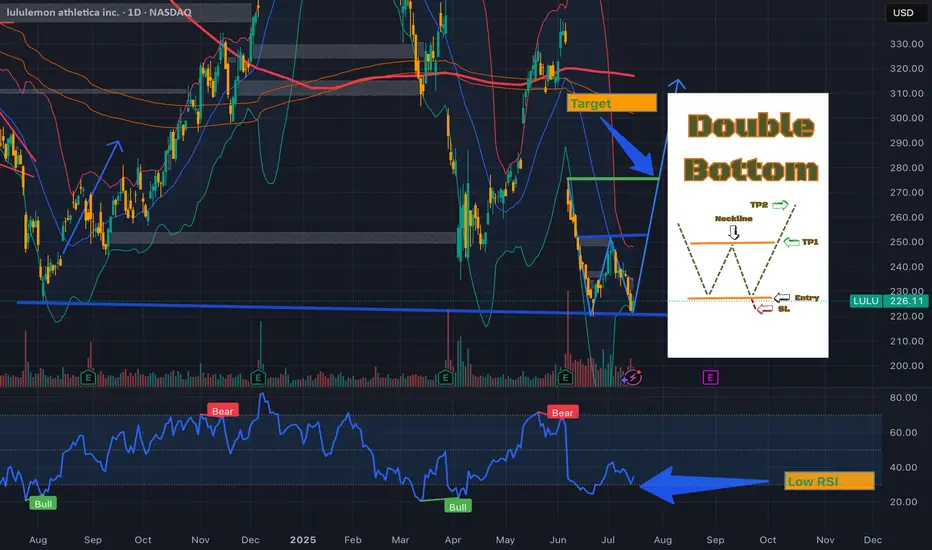
LULU – Double Bottom + RSI Divergence: Multi-Target Setup After LULU NASDAQ:LULU is showing signs of a potential bullish reversal after forming a double bottom structure around the $220 support zone , along with a bullish divergence on the RSI indicator.
Two vertical lines highlight the divergence: while price made a lower low, RSI formed a higher low – indicating a possible momentum shift in favor of buyers.
Currently, price is moving just below a descending trendline, which has been acting as dynamic resistance. The first condition for a long setup is a confirmed breakout above this trendline followed by a successful retest. If that happens, an entry can be considered .
📌 Entry Plan:
Entry: After a breakout and retest of the descending trendline.
1st TP: ~$247 — This level coincides with a local resistance zone, which may act as a neckline of the double bottom.
If price breaks above $247 and retests, it confirms bullish continuation.
📈 Target Structure:
2nd TP: ~$271 — next major resistance zone.
3rd TP: ~$297 — aligns with the first major gap zone.
4th TP: ~$329 — final gap resistance from previous sell-off levels.
This structure allows for scaling into the trade in stages — each breakout and retest offers a new confirmation and extension to the next target zone.
Volume analysis, price action, and RSI momentum all support the probability of a trend reversal — but confirmation is key.
Not financial advice. Always conduct your own research and risk management.
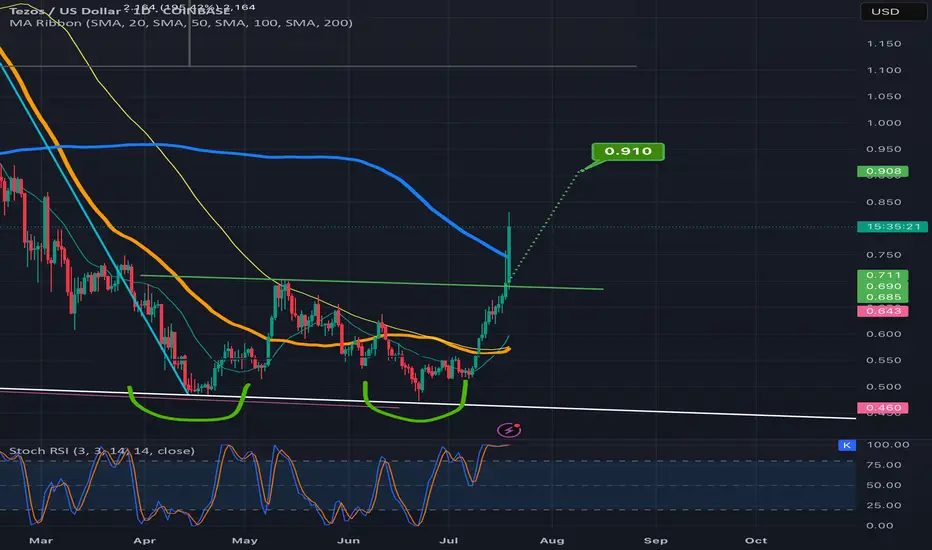
Tezos heading for a double bottom breakout targetPrice action is well above the neckline and already over halfway to the target. *not financial advice*
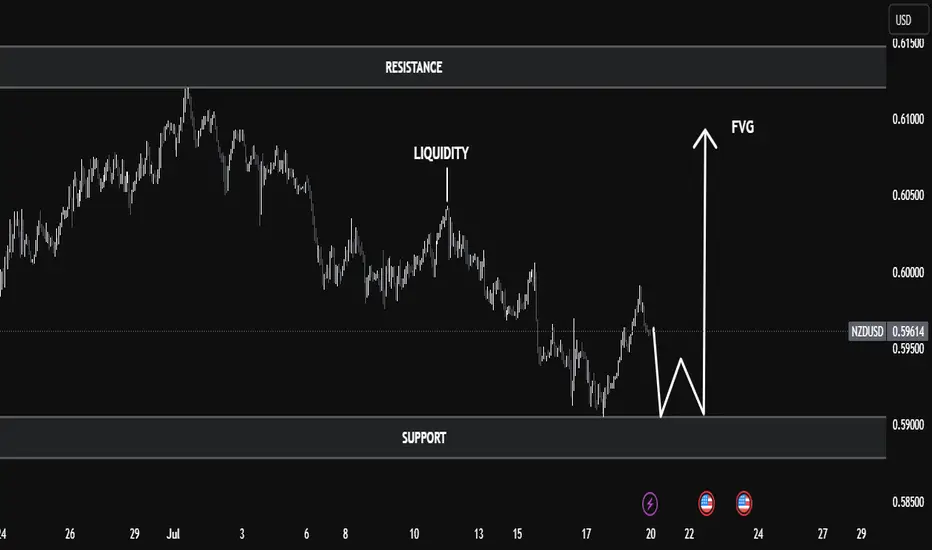
NZD/USD Technical Analysis | Smart Money Perspective🧠 NZD/USD Technical Analysis | Smart Money Perspective
On the current NZD/USD chart, price is trading around 0.5960, positioned between a clearly defined resistance zone (0.6130–0.6150) and a support zone (0.5890–0.5900).
We can observe the following key technical elements:
🔹 1. Liquidity Sweep
Price recently broke below the previous swing low near 0.5900, tapping into a pool of sell-side liquidity. This movement is commonly interpreted as a liquidity grab, where institutions manipulate price to trigger retail stop losses before reversing.
🔹 2. Double Bottom Formation
The chart indicates a potential double bottom forming at the support level — a classic accumulation signal. This pattern suggests buyers may be stepping in after liquidity has been taken out, anticipating a reversal.
🔹 3. Fair Value Gap (FVG)
An FVG (imbalance) is visible in the range of 0.5985 to 0.6015. This inefficiency was created by a sharp bearish move, leaving price action unbalanced. Price is now expected to retrace into this area to rebalance orders — a common smart money behavior.
🔹 4. Market Structure Outlook
If the double bottom confirms with a bullish break of structure above 0.5980, we could expect a continuation toward:
First Target: FVG zone around 0.6015
Second Target: Major resistance near 0.6150, where past distribution occurred.
✅ Conclusion
This setup combines key smart money concepts:
Liquidity grab below support
Accumulation phase at demand
FVG as target
Potential bullish market structure shift
Traders should monitor price action around the support zone for confirmation (e.g., bullish engulfing or break of short-term highs) before entering long positions. Targets remain at the FVG and resistance zones, but risk management is essential in case of a deeper sweep or macroeconomic catalyst.
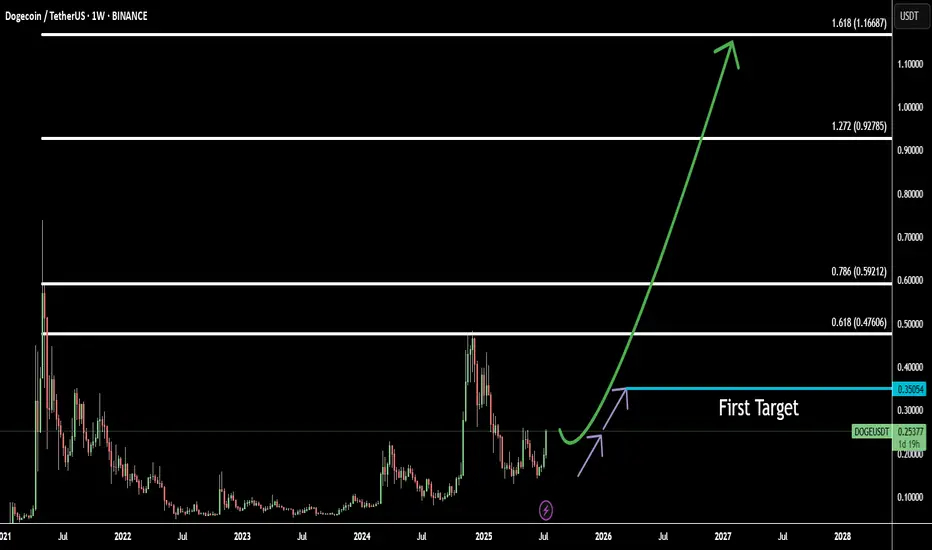
DOGE Weekly Double Bottom: Eyeing 5 Fibonacci TargetsDogecoin (DOGEUSD) is showing a bullish double bottom pattern on the weekly chart, suggesting a potential long-term reversal from previous downtrends. This classic accumulation pattern is forming near a key historical support level, adding confidence to the bullish case.
Using Fibonacci extensions from the neckline breakout, I’ve identified 5 major target zones:
Target 1: 0.35054 — conservative target confirming breakout
Target 2: 0.47606 — often hit during early momentum phases
Target 3: 0.59212 — key level for profit-taking and resistance
Target 4: 0.92785 — full measured move of the double bottom
Target 5: 1.16687 — aggressive bull target if momentum continues
The breakout is only confirmed if price holds above the neckline with strong volume. Risk management is crucial in case of a retest or false breakout.
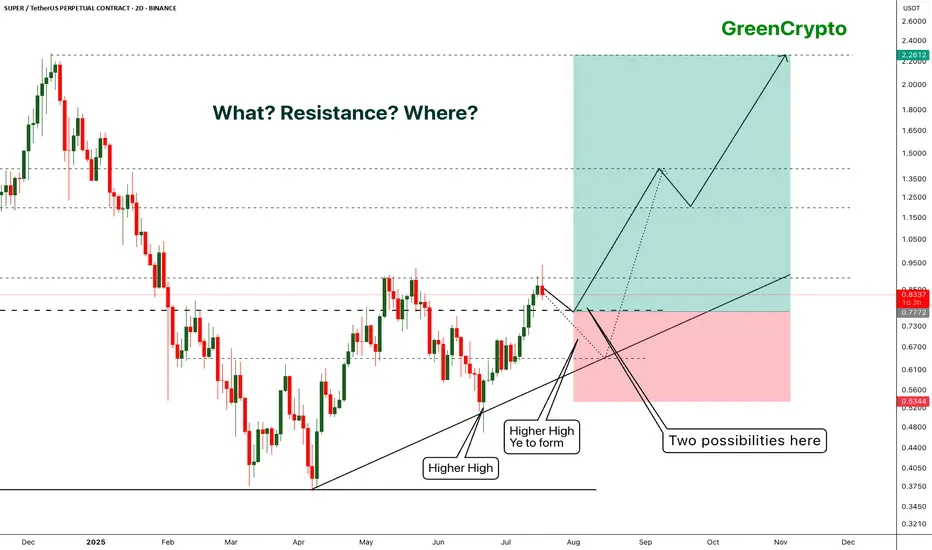
SUPER - Getting ready for the super run- Price is trading near the resistance after forming higher high.
- it's highly likely that price will get rejected around the resistance and will form another higher high.
- this is an excellent opportunity for us to enter the trade.
Entry Price: 0.7322
Stop Loss: 0.5344
TP1: 0.8939
TP2: 1.0517
TP3: 1.2867
TP4: 1.6336
TP5: 2.2243
Max Leverage 5x.
Don't forget to keep stoploss.
Support us by Liking and following.
Thanks and Cheers!
GreenCrypto
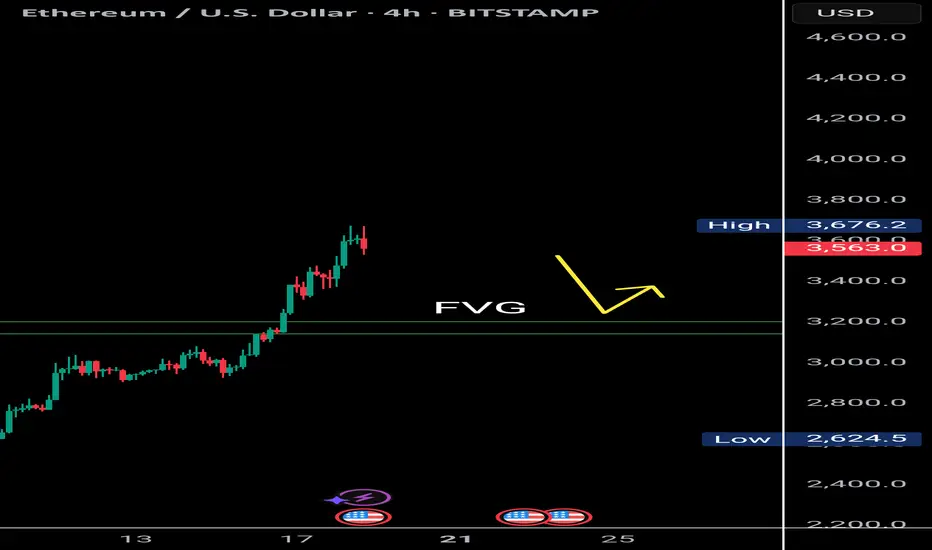
$Eth Faces Double Top Resistance with Bearish RSI DivergenceETH/USDT | 4H Analysis
Ethereum is currently showing signs of weakness on the 4H chart, forming a potential double top pattern around the $3,700-$3,680 range.
Adding to this, the RSI is exhibiting bearish divergence, suggesting that bullish momentum is fading. There's a visible liquidity gap between $3,200–$3,180, which might act as a magnet in the short term. A retest of this zone is likely before ETH attempts to resume its upward move.
Key Observations:
🟠 Double top structure on 4H chart
🔻 Bearish RSI divergence
🕳️ Favorable gap: $3,200 – $3,180
🔁 Watch for price reaction after retest
⚠️ If ETH holds the $3,180 support after filling the gap, a bullish bounce toward higher levels could follow.
📌 This idea is for educational purposes. Trade wisely with proper risk management.
ANDYUSDT double bottom formed breakout cause +100% pump2X is here easy target for tokens like PHEMEX:ANDYUSDT in this bull market but first of all breakout here to the upside is needed as you can see and i think soon it will happen with next bull pump of BINANCE:BTCUSDT so to the moon with ANDYUSDT for at least 2x or 3x.
DISCLAIMER: ((trade based on your own decision))
<<press like👍 if you enjoy💚

$DOGE Double Bottom TargetIf this double bottom "W" pattern on CRYPTOCAP:DOGE plays out, the target is $0.47.
Two notes:
1. The double-bottom pattern has a 60-65% success rate (no guarantees).
2. The Alt market has been very strong, with new dollars entering the market. If we close above $0.25-0.26 and retest, I think this target is likely as it returns to the high for this cycle.

GBPCAD Bearish Continuation Patterns and ConfirmationsA broken daily demand zone, a resistance trendline showing direction to the downside, bearish continuation patterns (rejection patterns) and consistent H4 supply zones all indicate that this market is bearish and if the current H4 supply holds then use bearish confirmations on LTFs to short to the next support or demand zone.

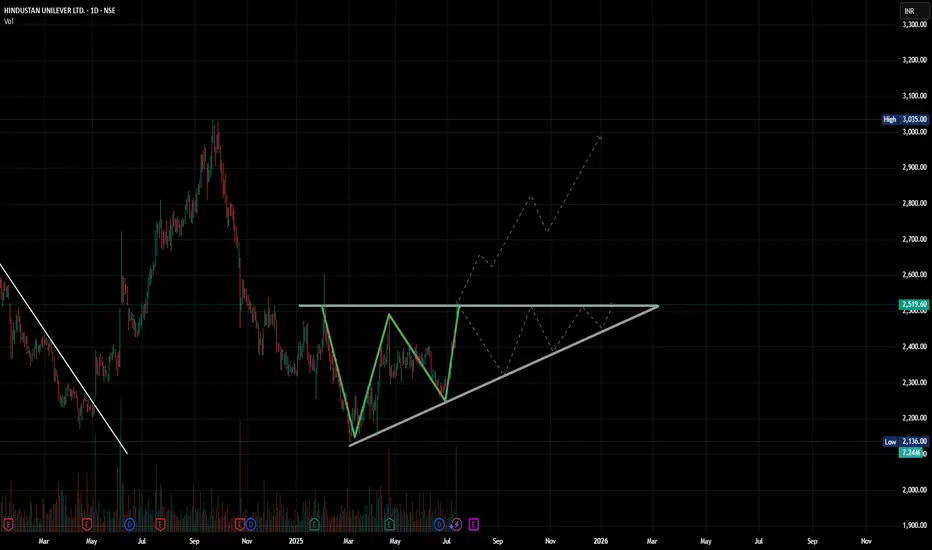
W For Win? HUL Pulls Up with a Perfect Double BottomPrice showing up to resistance like it forgot the last time it got slapped here. But this time it brought volume. Respect?
(Or the probable ascending triangle.. u know?)
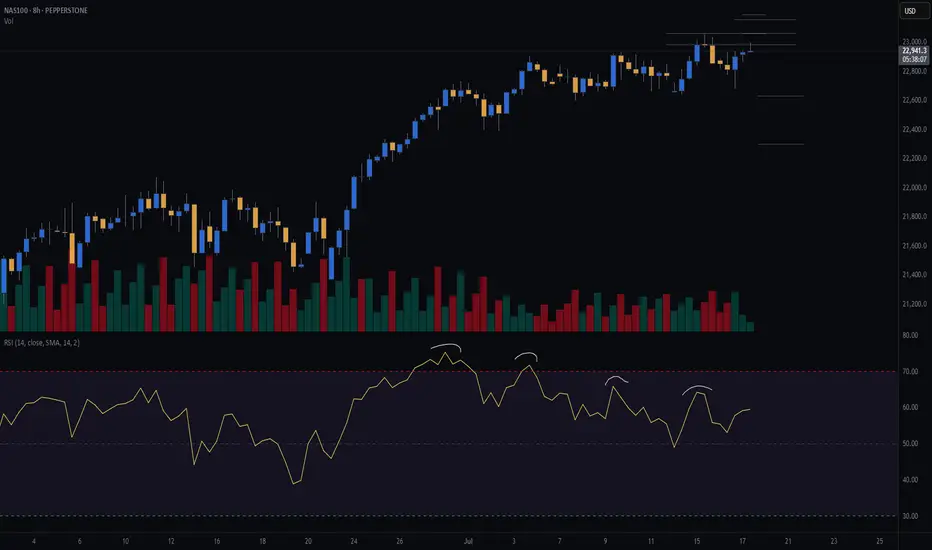
NAS100 (CASH100) SHORT - Double Top H8Risk/reward = 4.6
Entry price = 23 063
Stop loss price = 23 190
Take profit level 1 (50%) = 22 635
Take profit level 2 (50%) = 22 303
Still waiting for confirmation on some variables.
For example, need H8 candle to close in range and volume to validate, amongst other variables.
BTC/USD bearish conf. finally?BTC printed a double top on the 5m and on the 1h.
BTC being very weak all over the day, even running against ETH and co.
That might be the signal for the retracement "everybody" is waiting for.
BYBIT:BTCUSDT.P

CRWV retest incoming?will we retest 130?
That's my bet. I'm sure that Fri 7/18 will be wild as it is the monthly contract. Staying below 140, I'll hold my runners.
After this bottom, I think we will reverse back upward to 145+

USDCHF Double Top Rejection - Bearish Setup for Long Term TradeA Double Top Rejection on the weekly TF is currently at play and despite the current bullish correction, the trend is still very much bearish.
For long-term or position traders, this is an ideal setup to take and hold.

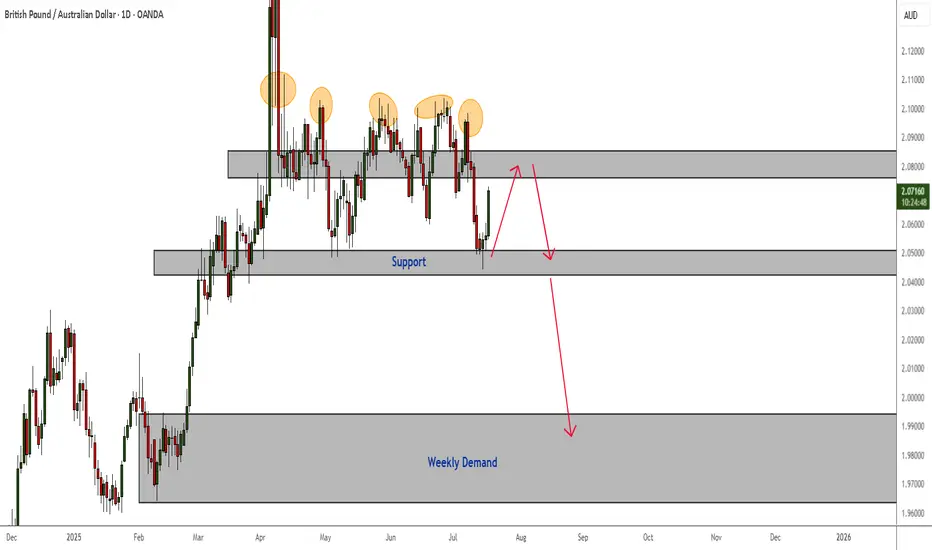
GBPAUD Downward Pressure - Bearish Confirmations Swing TradeAlthough price has been consolidating between a daily resistance and support, I am currently seeing multiple rejections in resistance and bearish candlestick patterns that indicate pressure to the downside will soon follow.
A rejection in the current highlighted resistance and a break of support will take price to weekly demand. Always wait for the right confirmations - especially when price is range-bound like it is now.
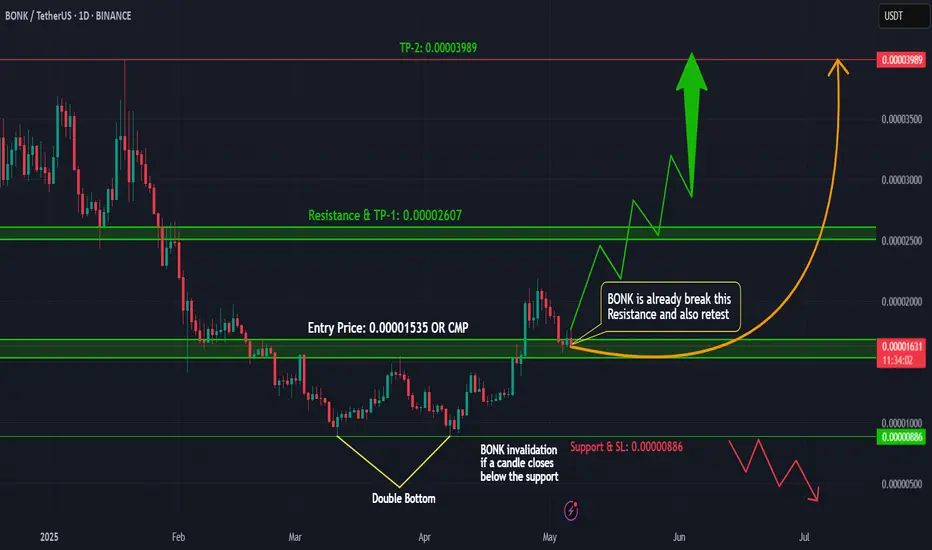
BONKUSDT: Bullish Setup Brewing! Are You In?#BONK is flashing strong bullish signals on the 1D timeframe:
Double Bottom Pattern – A textbook reversal signal
Break & Retest of Key Resistance – Now acting as solid support
Price at CMP (Current Market Price) – In the ideal buy zone
This confluence of signals suggests momentum is shifting in favor of the bulls. If volume kicks in, we could see a sharp breakout toward the next resistance levels.
Trade Plan:
Entry: CMP
SL: 0.00000886
Target 1: 0.00002607
Target 2: 0.00003989
Always use proper risk management!
What’s your view on #BONK? Bullish or Bearish?
Drop your thoughts in the comments and let's discuss!
Don’t forget to like and follow for more setups!
#BONK #Crypto #Altcoins #TechnicalAnalysis #Breakout #DoubleBottom #TradingView
Double Bottom Pattern on LULU“LULU is forming a potential Double Bottom on the daily chart, with two lows around $222 (support) and a neckline at $252. The pattern suggests a bullish reversal if the price breaks above $252 with strong volume. RSI is showing bullish divergence, and the 50-day MA is converging near the neckline, adding confluence. Target: $275.50 (pattern height added to neckline). Stop loss below $215 for a 1:2 risk-reward. Watching for a breakout with increased volume to confirm.”
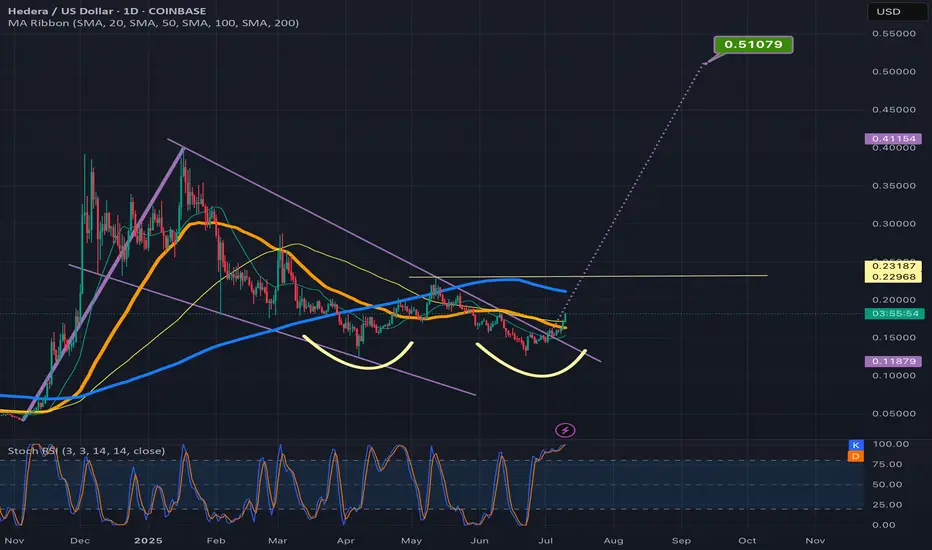
Hbar breaking upwar from fallingwedge/pennantAlso in a smaller double bottom setup here. *not financial advice*
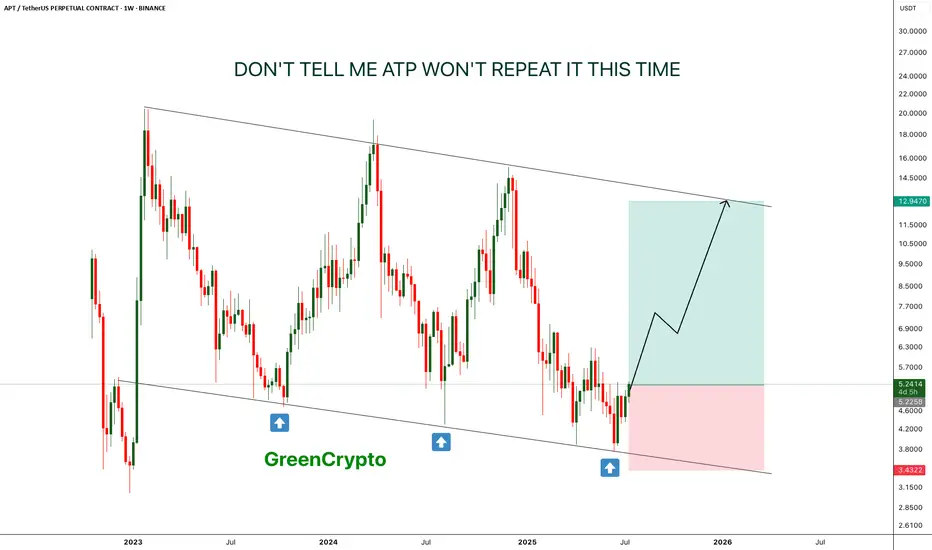
APT - Don't tell me this pattern won't repeat- This time is the charm, APT is is reversing from lower low on weekly chart.
- just like last two time, it is expect to forma new HL.
- there is a high chance that previous two patterns will repeat again
Entry Price: 5.22
Stop Loss: 3.4
TP1: 6.6632
TP2: 8.5059
TP3: 12.6945
Max Leverage: 5x
Don't forget to keep stoploss
Cheers
GreenCrypto
Current XAUUSD TradeDate: July 16, 2025
Platform: TradingView (Demo Account)
Timeframe: 15M (Entry), 4H (Bias/Context)
Direction: Long
Status: Entry zone identified, waiting for confirmation
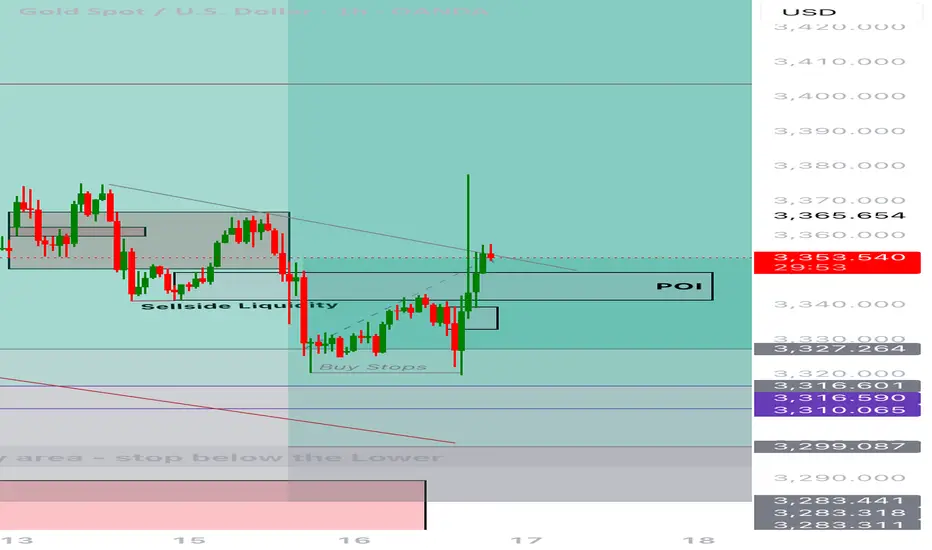
Strategy Type: POI Re-entry after BOS (Break of Structure)
⸻
🔍 Market Context
• On the 4H, bullish BMS is confirmed after sweeping sell-side liquidity.
• Price has aggressively moved upward, showing intent to continue bullish.
• 15M structure now shows break of previous SND zone, shifting lower-timeframe flow to bullish.
• POI zone identified — price likely to return here for a mitigation tap before full continuation.
⸻
🧠 Trade Rationale
• POI marked as a mitigation zone for re-entry after BOS on 15M.
• Confirmation will be valid only after price closes above the wick (shows strength).
• Expecting return to POI to mitigate imbalance or unfilled orders.
⸻
📍 Entry Criteria
• POI zone: between ~3,327 and 3,316
• Watch for:
• Bullish SFP (swing failure pattern)
• Bullish engulfing candle
• 15M BOS + higher low confirmation inside POI
• Entry trigger: Price must close above the wick, then return to POI with bullish reaction
⸻
🧾 Management Plan
• Stop Loss: Below POI (~3,316 or slightly lower)
• Take Profit: 3,492 (upper 4H imbalance zone)
• Trail stop based on 15M structure if price accelerates
⸻
😌 Emotional Reflection
Comfortable identifying refined entry after HTF structure shift. No FOMO — POI must react cleanly and respect my conditions.
⸻
✅ Reflection Questions
• Did I wait for the proper 15M BOS before marking my POI?
• Did I define my confirmation model clearly?
• Will I enter only if the wick is closed above and POI is respected?